What’s the difference between monitoring and observability
Today, the second most active project in CNCF is the Open Telemetry project that provides a solution to the Observability problem of modern cloud native applications.
A question often asked is – I have monitoring for my legacy applications that I can extend to include any new apps, so why do I need observability? And what’s the difference between monitoring and observability anyways? There is much debate in the industry about this and if you ask ten people about their take on this, you will probably get ten different answers. Let us see some common interpretations of the two.
How legacy monitoring systems worked
Remember those times when we deployed our applications on a bunch of servers? We even knew those servers by name – just like our pets! To assess the health and performance of our applications, we collected events from every application and every network entity. We deployed centralized monitoring systems that collected standard (remember SNMP?) and vendor proprietary notifications. Correlation engines, which were basically vendor specific, executed on this vast number of events and identified failure objects with custom rules.
Here’s a very simplistic view of a legacy monitoring system:
Simplistic view of a legacy monitoring system
Trend analysis with custom dashboards came to our aid when we had to trouble shoot a production problem. Traditional monitoring worked off a known set of anticipated problems. Monitoring systems were built around that, reacting to issues as and when they occurred with a prebuilt set of actions. Failure domains were known ahead of time and identified with customized correlation rules. Telemetry data such as logs, metrics, and traces were siloed. Operators did a manual correlation of the three sets of data. Alerting was after the fact (or reactive) when thresholds exceeded a preset minor, major or critical threshold.
Servers hosting our critical applications were our “pets”
The entire application landscape, including infrastructure, was operationalized with proprietary monitoring systems. It seemed quite adequate. Operators had a deep understanding of the architecture of applications and the systems hosting them. Operating guides laid out alerting and details on resolutions. Everything seemed to function like a well-oiled machine aligned with the goal of those times – to help I&O teams keep the lights on.
And then the applications split and spread their wings, migrating to the clouds!
Enter microservices
We now deal with “cattle.” That is, short lived containers that come and go – everything seems dispensable, replaceable, and scalable. Considering the magnitude of containers, traditional monitoring systems prove totally insufficient to manage this new breed of applications with their unimaginable number of events. This scenario is only made more complex considering that there are no standards for cloud monitoring with each public cloud provider inserting their own little stickiness into the mix.
Microservices make it hard to update monitoring systems
Microservices no longer deal with long release cycles. With monolithic apps, there used to be a sync up among various teams on architecture changes to the services being updated. However, it’s hard on I&O teams to update monitoring systems as microservices change. The bottom line is that I&O teams will possibly be operating apps that they don’t totally understand architecturally.
Enter “observability”
Observability promises to address the complexities of tracking cloud native application health and performance.
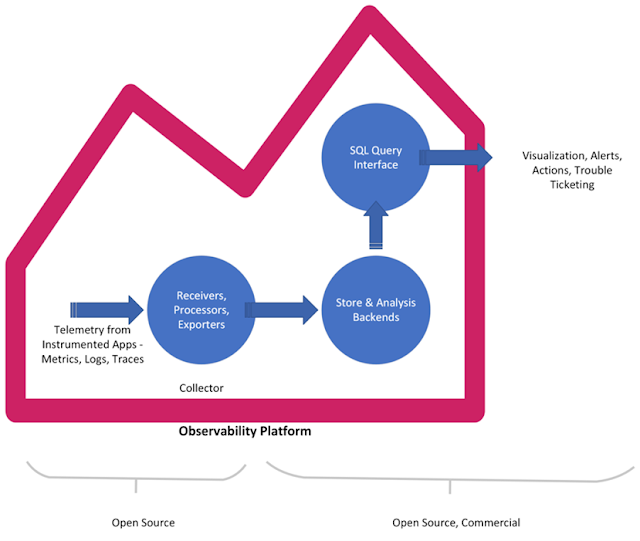
Observability is for systems that can be pretty much of a black box. It helps I&O teams who are trying to identify the internal state of the black box from telemetry data collected. It involves finding an answer to the unknown unknowns – meaning we cannot predict what’s going to happen but need the ability to ask questions and get answers so we can best formulate an action to the issue. Observability is about deriving signals from raw telemetry data as an integrated platform for logs, metrics, and traces.
In today’s dynamic, polyglot ecosystem where services are individually scaling to meet demands, simple monitoring built around a known set of events and alerts will fail. An Observability platform will ingest an insightful set of data generated by instrumentation of apps. Then, transform and collate trace/metrics/log data and funnel it into data stores that can then be queried to gauge the system health and performance. The key here is the context that can be attached to any aggregated data that can help decipher the internal state of the system and failures.
Extracting valuable signals from correlated data
In conclusion, the nirvana that we are striving for seems to be a scenario where we have literally all the data we need from instrumented apps as a correlated set of metrics, logs, and traces. Following this, the right set of tools will extract valuable signals from this correlated data revealing not only the service model but also failure objects to address health and performance issues.
Watch out for future blogs where we will explore OpenTelemetry as a solution to observability and explore MELT (metrics, events, logs, traces) with open source and commercial tools.
Source: cisco.com


0 comments:
Post a Comment