Showing posts with label Machine Learning. Show all posts

Thursday, 18 January 2024

How to Use Ansible with CML

How can Ansible help people building simulations with Cisco Modeling Labs (CML)?

Similar to Terraform, Ansible is a common, open-source automation tool often used in Continuous Integration/Continuous Deployment (CI/CD) DevOps methodologies. They are both a type of Infrastructure as Code (IaC) or Infrastructure as Data that allow you to render your infrastructure as text files and control it using tools such as Git. The advantage is reproducibility, consistency, speed, and the knowledge that, when you change the code, people approve, and it gets tested before it’s pushed out to your production network. This paradigm allows enterprises to run their network infrastructure in the same way they run their software and cloud practices. Afterall, the infrastructure is there to support the apps, so why manage them differently? 

Although overlaps exist in the capabilities of Terraform and Ansible, they are very complementary. While Terraform is better at the initial deployment and ensuring ongoing consistency of the underlying infrastructure, Ansible is better at the initial configuration and ongoing management of the things that live in that infrastructure, such as systems, network devices, and so on. 

In a common workflow in which an operator wants to make a change to the network, let’s say adding a new network to be advertised via BGP, a network engineer would specify that change in the code or more likely as configuration data in YAML or JSON. In a typical CI workflow, that change would need to be approved by others for correctness or adherence to corporate and security concerns, for instance. In addition to the eyeball tests, a series of automated testing validates the data and then deploys the proposed change in a test network. Those tests can be run in a physical test network, a virtual test network, or a combination of the two. That flow might look like the following:

How to Use Ansible with CML

The advantage of leveraging virtual test networks is profound. The cost is dramatically lower, and the ability to automate testing is increased significantly. For example, a network engineer can spin up and configure a new, complex topology multiple times without the likelihood of old tests messing up the accuracy of the current testing. Cisco Modeling Labs is a great tool for this type of test. 

Here’s where the Ansible CML Collection comes in. Similar to the CML Terraform integration covered in a previous blog, the Ansible CML Collection can automate the deployment of topologies in CML for testing. The Ansible CML Collection has modules to create, start, and stop a topology and the hosts within it, but more importantly, it has a dynamic inventory plugin for getting information about the topology. This is important for automation because topologies can change. Or multiple topologies could exist, depending on the tests being performed. If your topology uses dynamic host configuration protocol (DHCP) and/or CML’s PATty functionality, the information for how Ansible communicates with the nodes needs to be communicated to the playbook. 

Let’s go over some of the features of the Ansible CML Collection’s dynamic inventory plugin. 

First, we need to install the collection: 

ansible-galaxy collection install cisco.cml 

Next, we create a cml.yml in the inventory with the following contents to tell Ansible to use the Ansible CML Collection’s dynamic inventory plugin: 

plugin: cisco.cml.cml_inventory 

group_tags: network, ios, nxos, router

In addition to specifying the plugin name, we can also define tags that, when found on the devices in the topology, add that device to an Ansible group to be used later in the playbook:

How to Use Ansible with CML

In addition to specifying the plugin name, we can also define tags that, when found on the devices in the topology, add that device to an Ansible group to be used later in the playbook:

  • CML_USERNAME: Username for the CML user
  • CML_PASSWORD: Password for the CML user
  • CML_HOST: The CML host
  • CML_LAB: The name of the lab 

Once the plugin knows how to communicate with the CML server and which lab to use, it can return information about the nodes in the lab: 

ok: [hq-rtr1] => { 

    "cml_facts": { 

        "config": "hostname hq-rtr1\nvrf definition Mgmt-intf\n!\naddress-family ipv4\nexit-address-family\n!\naddress-family ipv6\nexit-address-family\n!\nusername admin privilege 15 secret 0 admin\ncdp run\nno aaa new-model\nip domain-name mdd.cisco.com\n!\ninterface GigabitEthernet1\nvrf forwarding Mgmt-intf\nip address dhcp\nnegotiation auto\nno cdp enable\nno shutdown\n!\ninterface GigabitEthernet2\ncdp enable\n!\ninterface GigabitEthernet3\ncdp enable\n!\ninterface GigabitEthernet4\ncdp enable\n!\nip http server\nip http secure-server\nip http max-connections 2\n!\nip ssh time-out 60\nip ssh version 2\nip ssh server algorithm encryption aes128-ctr aes192-ctr aes256-ctr\nip ssh client algorithm encryption aes128-ctr aes192-ctr aes256-ctr\n!\nline vty 0 4\nexec-timeout 30 0\nabsolute-timeout 60\nsession-limit 16\nlogin local\ntransport input ssh\n!\nend", 

        "cpus": 1, 

        "data_volume": null, 

        "image_definition": null, 

        "interfaces": [ 

            { 

                "ipv4_addresses": null, 

                "ipv6_addresses": null, 

                "mac_address": null, 

                "name": "Loopback0", 

                "state": "STARTED" 

            }, 

            { 

                "ipv4_addresses": [ 

                    "192.168.255.199" 

                ], 

                "ipv6_addresses": [], 

                "mac_address": "52:54:00:13:51:66", 

                "name": "GigabitEthernet1", 

                "state": "STARTED" 

            } 

        ], 

        "node_definition": "csr1000v", 

        "ram": 3072, 

        "state": "BOOTED" 

    } 


The first IPv4 address found (in order of the interfaces) is used as `ansible_host` to enable the playbook to connect to the device. We can use the cisco.cml.inventory playbook included in the collection to show the inventory. In this case, we only specify that we want devices that are in the “router” group created by the inventory plugin as informed by the tags on the devices: 

mdd % ansible-playbook cisco.cml.inventory --limit=router 

ok: [hq-rtr1] => { 

    "msg": "Node: hq-rtr1(csr1000v), State: BOOTED, Address: 192.168.255.199:22" 


ok: [hq-rtr2] => { 

    "msg": "Node: hq-rtr2(csr1000v), State: BOOTED, Address: 192.168.255.53:22" 


ok: [site1-rtr1] => { 

    "msg": "Node: site1-rtr1(csr1000v), State: BOOTED, Address: 192.168.255.63:22" 


ok: [site2-rtr1] => { 

    "msg": "Node: site2-rtr1(csr1000v), State: BOOTED, Address: 192.168.255.7:22" 


In addition to group tags, the CML dynamic inventory plugin will also parse tags to pass information from PATty and to create generic inventory facts:

How to Use Ansible with CML

If a CML tag is specified that matches `^pat:(?:tcp|udp)?:?(\d+):(\d+)`, the CML server address (as opposed to the first IPv4 address found) will be used for `ansible_host`. To change `ansible_port` to point to the translated SSH port, the tag `ansible:ansible_port=2020` can be set. These two tags tell the Ansible playbook to connect to port 2020 of the CML server to automate the specified host in the topology. The `ansible:` tag can also be used to specify other host facts. For example, the tag `ansible:nso_api_port=2021` can be used to tell the playbook the port to use to reach the Cisco NSO API. Any arbitrary fact can be set in this way. 

Getting started 

Trying out the CML Ansible Collection is easy. You can use the playbooks provided in the collection to load and start a topology in your CML server. To start, define the environment variable that tells the collection how to access your CML server: 

% export CML_HOST=my-cml-server.my-domain.com 

% export CML_USERNAME=my-cml-username 

% export CML_PASSWORD=my-cml-password 

The next step is to define your topology file. This is a standard topology file you can export from CML. There are two ways to define the topology file. First, you can use an environment variable: 

% export CML_LAB=my-cml-labfile 

Alternatively, you can specify the topology file when you run the playbook as an extra–var. For example, to spin up a topology using the built in cisco.cml.build playbook: 

% ansible-playbook cisco.cml.build -e wait='yes' -e cml_lab_file=topology.yaml 

This command loads and starts the topology; then it waits until all nodes are running to complete. If -e startup=’host’ is specified, the playbook will start each host individually as opposed to starting them all at once. This allows for the config to be generated and fed into the host on startup. When cml_config_file is defined in the host’s inventory, it is parsed as a Jinja file and fed into that host as config at startup. This allows for just-in-time configuration to occur. 

Once the playbook completes, you can use another built-in playbook, cisco.cml.inventory, to get the inventory for the topology. In order to use it, first create a cml.yml in the inventory directory as shown above, then run the playbook as follows: 

% ansible-playbook cisco.cml.inventory 

PLAY [cml_hosts] ********************************************************************** 

TASK [debug] ********************************************************************** 

ok: [WAN-rtr1] => { 

    "msg": "Node: WAN-rtr1(csr1000v), State: BOOTED, Address: 192.168.255.53:22" 


ok: [nso1] => { 

    "msg": "Node: nso1(ubuntu), State: BOOTED, Address: my-cml-server.my-domain.com:2010" 


ok: [site1-host1] => { 

    "msg": "Node: site1-host1(ubuntu), State: BOOTED, Address: site1-host1:22" 


In this truncated output, three different scenarios are shown. First, WAN-rtr1 is assigned the DHCP address it received for its ansible_host value, and ansible port is 22. If the host running the playbook has IP connectivity (either in the topology or a network connected to the topology with an external connector), it will be able to reach that host. 

The second scenario shows an example of the PATty functionality with the host nso1 in which the dynamic inventory plugin reads those tags to determine that the host is available through the CML server’s interface (i.e. ansible_host is set to my-cml-server.my-domain.com). Also, it knows that ansible_port should be set to the port specified in the tags (i.e. 2010). After these values are set, the ansible playbook can reach the host in the topology using the PATty functionality in CML. 

The last example, site1-host1, shows the scenario in which the CML dynamic inventory script can either find a DHCP allocated address or tags to specify to what ansible_host should be set, so it uses the node name. For the playbook to reach those hosts, it would have to have IP connectivity and be able to resolve the node name to an IP address. 

These built-in playbooks show examples of how to use the functionality in the CML Ansible Collection to build your own playbooks, but you can also use them directly as part of your pipeline. In fact, we often use them directly in the pipelines we build for customers. 

Source: cisco.com

Thursday, 17 August 2023

Cisco Drives Full-Stack Observability with Telemetry

Cisco Career, Cisco skills, Cisco Jobs, Cisco Prep, Cisco Preparation, Cisco Tutorial and Materials, Cisco Guides, Cisco Learning

Telemetry data holds the key to flawless, secure, and performant digital experiences


Organizations need to build complete customer-centric environments that deliver superb, secure, personalized digital experiences every time, or risk losing out in the race for competitive advantage. Prioritizing both internal- and external-facing applications and ensuring they are running optimally is the engine behind every successful modern business.

The complexity of cloud native and distributed systems has risen in lockstep with the expectations of customers and end users. This rachets up the pressure on the teams responsible for applications. They need to aggregate petabytes of incoming data from applications, services, infrastructure, and the internet and connect it to business outcomes.


This telemetry data — called MELT or metrics, events, logs, and traces — contains the information needed to keep digital experiences running at peak performance. Understanding, remediating, and fixing any current or potential breakdown of the digital experience depends on this collective data to isolate the root cause.

Given our dependence on performant, real-time applications, even a minor disruption can be costly. A recent global survey by IDC reveals the cost of a single hour’s downtime averages a quarter of a million dollars — so it’s vital that teams can find, triage, and resolve issues proactively or as quickly as possible.

The answers lie in telemetry, but there are two hurdles to clear


The first is sorting through vast volumes of siloed telemetry in a workable timeframe. While solutions on the market can identify anomalies, or issues out of baseline, that doesn’t necessarily mean they are a meaningful tool for cross-domain resolution. In fact, only 17% of IDC’s survey respondents said current monitoring and visibility options are meeting their needs, though they are running multiple solutions.

The second is that some data may not even be captured by some monitoring solutions because they see only parts of the technology stack. Today’s applications and workloads are so distributed that solutions lacking visibility into the full stack — application to infrastructure and security, up to the cloud and out to the internet where the user is connected — are missing some vital telemetry altogether.

Effective observability requires a clear line of sight to every possible touchpoint that could impact the business and affect the way its applications and associated dependencies perform, and how they are used. Getting it right involves receiving and interpreting a massive stream of incoming telemetry from networks, applications and cloud services, security devices, and more, used to gain insights as a basis for action.

Cisco occupies a commanding position with access to billions upon billions of data points


Surfacing 630 billion observability metrics daily and absorbing 400 billion security events every 24 hours, Cisco has long been sourcing telemetry data from elements that are deeply embedded in networks, such as routers, switches, access points and firewalls, all of which hold a wealth of intelligence. Further performance insights, uptime records and even logs are sourced from hyperscalers, application security solutions, the internet, and business applications.

This wide range of telemetry sources is even more critical because the distributed reality of today’s workforce means that end-to-end connectivity, application performance and end-user experience are closely correlated. In fact, rapid problem resolution is only possible if available MELT signals represent connectivity, performance, and security, as well as dependencies, quality of code, end-user journey, and more.

To assess this telemetry, artificial intelligence (AI) and machine learning (ML) are essential for predictive data models that can reliably point the way to performance-impacting issues, using multiple integration points to collect different pieces of data, analyze behavior and root causes, and match patterns to predict incidents and outcomes.

Cisco plays a leading role in the OpenTelemetry movement, and in making systems observable


As one of the leading contributors to the OpenTelemetry project, Cisco is committed to ensuring that different types of data can be captured and collected from traditional and cloud native applications and services as well as from the associated infrastructure, without dependence on any tool or vendor.

While OpenTelemetry involves metrics, events/logs and traces, all four types of telemetry data are essential. Uniquely, Cisco Full-Stack Observability has leveraged the power of traces to surface issues and insights throughout the full stack rather than within a single domain. Critically, these insights are connected to business context to provide actionable recommendations.

For instance, the c-suite can visualize the business impact of a poor mobile application end-user experience while their site reliability engineers (SREs) see the automated action required to address the cause.

By tapping into billions of points of telemetry data across multiple sources, Cisco is leading the way in making systems observable so teams can deliver quality digital experiences that help them achieve their business objectives.

Source: cisco.com

Wednesday, 1 September 2021

Accelerate Data Lake on Cisco Data Intelligence Platform with NVIDIA and Cloudera

Cisco Data Intelligence Platform, Cisco Prep, Cisco Learning, Cisco Guides, Cisco Tutorial and Materials, Cisco Preparation, Cisco Career

The Big Data (Hadoop) ecosystem has evolved over the years from batch processing (Hadoop 1.0) to streaming and near real-time analytics (Hadoop 2.0) to Hadoop meets AI (Hadoop 3.0). These technical capabilities continue to evolve, delivering the data lake as a private cloud with separation of storage and compute. Future enhancements include support for a hybrid cloud (and multi-cloud) enablement.

Cloudera and NVIDIA Partnerships

Cloudera released the following two software platforms in the second half of 2020, which, together, enables the data lake as a private cloud:

◉ Cloudera Data Platform Private Cloud Base – Provides storage and supports traditional data lake environments; introduced Apache Ozone, the next generation filesystem for data lake

◉ Cloudera Data Platform Private Cloud Experiences – Allows experience- or persona-based processing of workloads (such as data analyst, data scientist, data engineer) for data stored in the CDP Private Cloud Base.

Today we are excited to announce that our collaboration with NVIDIA has gone to the next level with Cloudera, as the Cloudera Data Platform Private Cloud Base 7.1.6. will bring in full support of Apache Spark 3.0 with NVIDIA GPU on Cisco CDIP.

Cisco Data Intelligence Platform (CDIP)

Cisco Data Intelligence Platform (CDIP) is a thoughtfully designed private cloud for data lake requirements, supporting data-intensive workloads with the Cloudera Data Platform (CDP) Private Cloud Base and compute-rich (AI/ML) and compute-intensive workloads with the Cloudera Data Platform Private Cloud Experiences — all the while providing storage consolidation with Apache Ozone on the Cisco UCS infrastructure. And it is all fully managed through Cisco Intersight. Cisco Intersight simplifies hybrid cloud management, and, among other things, moves the management of servers from the network into the cloud.

CDIP as a private cloud is based on the new Cisco UCS M6 family of servers that support NVIDIA GPUs and 3rd Gen Intel Xeon Scalable family processors with PCIe Gen 4 capabilities. These servers include the following:

◉ Cisco UCS C240 M6 Server for Storage (Apache Ozone and HDFS) with CDP Private Cloud Base — extends the capabilities of the Cisco UCS rack server portfolio with 3rd Gen Intel Xeon Scalable Processors, supporting more than 43% more cores per socket and 33% more memory than the previous generation.

◉ Cisco UCS® X-Series for CDP Private Cloud Experiences — a modular system managed from the cloud (Cisco Intersight). Its adaptable, future-ready, modular design meets the needs of modern applications and improves operational efficiency, agility, and scale.

Cisco Data Intelligence Platform, Cisco Prep, Cisco Learning, Cisco Guides, Cisco Tutorial and Materials, Cisco Preparation, Cisco Career

CDIP is designed for hybrid clouds to help customers address the needs of modern apps and extensible data platforms. They can further accelerate their AI/ML and ETL workloads on their data lake with GA of Apache Spark 3.0 enabling GPU-accelerated workloads powered by NVIDIA RAPIDS data science libraries in the CDP Private Cloud Base 7.1.6.

The NVIDIA RAPIDS suite of open-source software libraries gives you the freedom to execute end-to-end data science and analytics pipelines entirely on GPUs. RAPIDS uses NVIDIA CUDA and exposes GPU parallelism to accelerate ETL and machine-learning workloads. NVIDIA RAPIDS Accelerator for Apache Spark leverages GPUs to accelerate data processing in Apache Spark 3.0 using the RAPIDS libraries. This allows users to run existing Apache Applications ten times faster with no code changes.

On the AI/ML side, NVIDIA GPUs integrates with libraries like TensorFlow and PyTorch to accelerate the training of Neural Networks for various use cases, such as Computer Vision and Natural Language processing, on a single GPU node or on multiple nodes, reducing the training time from weeks to days (or hours). This saves our customers valuable time.

The Cisco, NVIDIA, and Cloudera three-way partnership brings our joint customers a much richer data lake experience through solution technology advancements, validated designs, and it all comes with full product support.

Source: cisco.com

Tuesday, 2 March 2021

Machine Reasoning is the new AI/ML technology that will save you time and facilitate offsite NetOps

Cisco Prep, Cisco Tutorials and Material, Cisco Career, Cisco Preparation, Cisco Guides

Machine reasoning is a new category of AI/ML technologies that can enable a computer to work through complex processes that would normally require a human. Common applications for machine reasoning are detail-driven workflows that are extremely time-consuming and tedious, like optimizing your tax returns by selecting the best deductions based on the many available options. Another example is the execution of workflows that require immediate attention and precise detail, like the shut-off protocols in a refinery following a fire alarm. What both examples have in common is that executing each process requires a clear understanding of the relationship between the variables, including order, location, timing, and rules. Because, in a workflow, each decision can alter subsequent steps.

So how can we program a computer to perform these complex workflows? Let’s start by understanding how the process of human reasoning works. A good example in everyday life is the front door to a coffee shop. As you approach the door, your brain goes into reasoning mode and looks for clues that tell you how to open the door. A vertical handle usually means pull, while a horizontal bar could mean push. If the building is older and the door has a knob, you might need to twist the knob and they push or pull depending on which side of the threshold the door is mounted. Your brain does all of this reasoning in an instant, because it’s quite simple and based on having opened thousands of doors. We could program a computer to react to each of these variables in order, based on incoming data, and step through this same process.

Now let’s apply these concepts to networking. A common task in most companies is compliance checking where each network device, (switch, access point, wireless controller, and router) is checked for software version, security patches, and consistent configuration. In small networks, this is a full day of work; larger companies might have an IT administrator dedicated to this process full-time. A cloud-connected machine reasoning engine (MRE) can keep tabs on your device manufacturer’s online software updates and security patches in real time. It can also identify identical configurations for device models and organize them in groups, so as to verify consistency for all devices in a group. In this example, the MRE is automating a very tedious and time-consuming process that is critical to network performance and security, but a task that nobody really enjoys doing.

Another good real world example is troubleshooting an STP data loop in your network. Spanning Tree Protocol (STP) loops often appear after upgrades or additions to a layer-2 access network and can data storms that result in severe performance degradation. The process for diagnosing, locating, and resolving an STP loop can be time-consuming and stressful. It also requires a certain level of networking knowledge that newer IT staff members might not yet have. An AI-powered machine reasoning engine can scan your network, locate the source of the loop, and recommend the appropriate action in minutes.

Cisco DNA Center delivers some incredible machine reasoning workflows with the addition of a powerful cloud-connected Machine Reasoning Engine (MRE). The solution offers two ways to experience the usefulness of this new MRE. The first way is something many of you are already aware of, because it’s been part of our AI/ML insights in Cisco DNA Center for a while now: proactive insights. When Cisco DNA Center’s assurance engine flags an issue, it may determine to send this issue to the MRE for automated troubleshooting. If there is an MRE workflow to resolve this issue, you will be presented with a run button to execute that workflow and resolve the issue. Since we’ve already mentioned STP loops, let’s take a look at how that would work.

When a broadcast storm is detected, AI/ML can look at the IP addresses and determine that it’s a good candidate for STP troubleshooting. You’ll get the following window when you click on the alert:

Cisco Prep, Cisco Tutorials and Material, Cisco Career, Cisco Preparation, Cisco Guides
Image 1: Broadcast storm detected

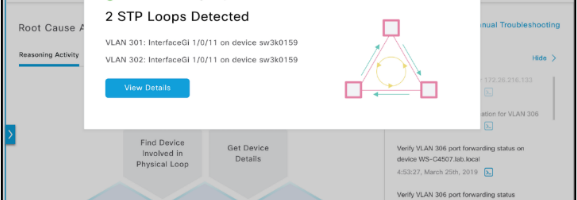
When you click on the button “Start Automate Troubleshooting” you spin-up the machine reasoning engine and it traces the host flaps. If it detects STP loops, you’ll see this window:

Cisco Prep, Cisco Tutorials and Material, Cisco Career, Cisco Preparation, Cisco Guides
Image 2: STP Loops Detected

Cisco Prep, Cisco Tutorials and Material, Cisco Career, Cisco Preparation, Cisco Guides
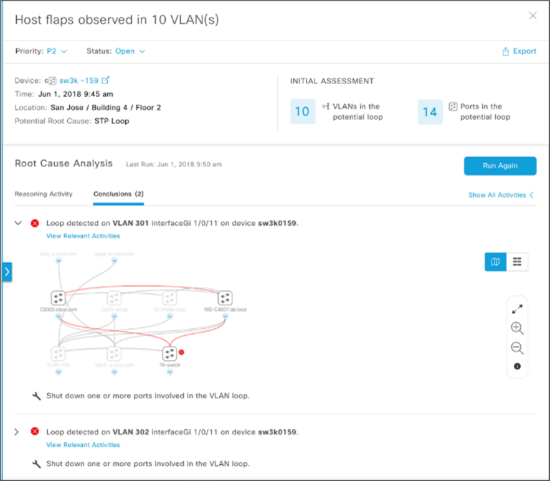
Image 3: STP loops identified by device and VLAN

Now click on view details and the MRE will present you the specifics for the related VLANs as well as a logical map of the loop with the name of the relevant devices and the VLAN number. All you need to do now is prune your VLANs in those switches, and you’ve solved a complex issue in just a couple minutes. The ease at which this problem is resolved shows how MRE can bridge the skill gap and enable lesser trained IT members to proactively resolve network issues. It also demonstrates that machines can discover, investigate, and resolve network issues much faster than a human can. Eliminating human latency in issue resolution can greatly improve user experience on your network.

Another example of a proactive workflow is the “PSIRT alert” that flag Cisco devices which have advisories for bug or vulnerability software patches. You will see this alert automatically, anytime Cisco has released a PSIRT advisory that is relevant to one of your devices. Simply click the PSIRT alert and the software patch will be displayed and ready to load. The Cisco DNA Center team is working hard to create more proactive MRE workflows, so you’ll see more of these automated troubleshooting solutions in future upgrades.

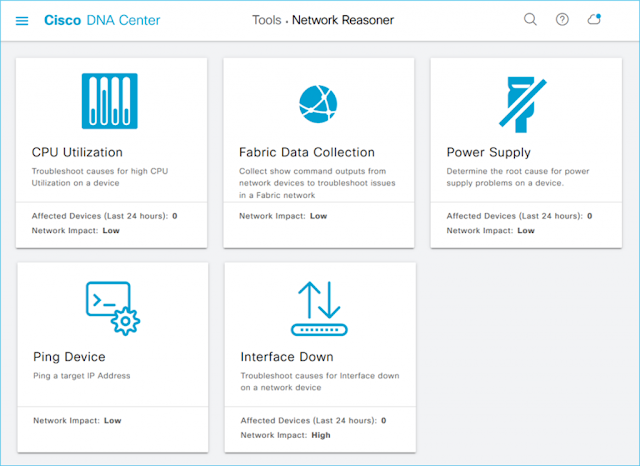
The second way to experience machine reasoning in Cisco DNA Center, is in the new “Network Reasoner Dashboard,” which is located in the “Tools” menu. There you will find five new buttons that execute automated workflows through the MRE.

Cisco Prep, Cisco Tutorials and Material, Cisco Career, Cisco Preparation, Cisco Guides
Image 4: Network Reasoner Dashboard

1. CPU Utilization: There are a number of reasons that the CPU in a networking device would be experiencing high utilization. If you have ever had to troubleshoot this, you know that the remediation list for this is quite long and the tasks involved are both time-consuming and require a seasoned IT engineer to perform. This button works through numerous tasks, such as IOS process, packets per second flow, broadcast storm, etc. It then returns a result with specific guided remediation to resolve the issue.

2. Interface Down: Understanding the reasons for an interface that doesn’t come up requires deep knowledge of virtual routing and forwarding (VRF). This means that your less experienced team members will likely escalate this issue to a higher level engineer to be resolved. Furthermore, unless your switch has the capability of advanced telemetry you would need to have physical access to the switch in order to rule out a Layer-1 problem such as an SPF, cables, connectors, patch panel, etc. This button compares the interface link parameters at each end, runs a loopback, ping, traceroute, and other tests before returning a result for the most likely cause.

3. Power supply: Cisco Catalyst switches can detect power issues related to inconsistent voltage, fluctuating input, no connection, etc. This is generally done on site with visible inspection of the interface and LEDs. The MRE workflow uses sensors and logic reasoning to determine the probable cause. So, press this button if you want to skip a trip to the switch site.

4. Ping Device: I know what you’re thinking, it’s so simple to ping a device. But, it does take time to open a CLI window and it’s a distraction from the window you have open. Now all you need to do is push a button and enter the target IP address.

5. Fabric Data Collection: Moving to a software defined network with a fully layered fabric and micro-segmentation has tremendous benefits, but it does take some training to master. This button will collect show command outputs from network devices for complete visibility of your overlay (virtual) network. Having clear visibility can help troubleshoot issues in your fabric network.

Now that you know what machine reasoning is, and what it can offer your team, let’s take a look at how it works. It all starts with Cisco subject matter experts that have created a knowledge base of processes required to achieve certain outcomes which are based on best practices, defect signatures, PSIRTs, and other data. Using a “workflow editor” these processes are encapsulated into a central knowledge base, located in the Cisco cloud. When the AI/ML assurance engine in Cisco DNA Center sees and issue, it will send this issue to the MRE, which then uses inferences to select a relevant workflow from the knowledge base in the cloud. Cisco DNA Center can then present remediation or execute a complete workflow to resolve the issue. In the case of the workflows on demand in the network reasoner dashboard, the MRE simply selects the workflow from the knowledge base and executes it.

Cisco Prep, Cisco Tutorials and Material, Cisco Career, Cisco Preparation, Cisco Guides
Figure 1: MRE architecture

If you’re following my description of the process on the image above, you’ll notice I left out a couple icons in the diagram: Community, Partners, and Governance. Cisco is inviting our DEVNET community and fabulous Cisco Partners to create and publish MRE workflows. In conjunction with Cisco CX, we have developed a governance process, which works inside of our software Early Field Trials (EFT) program. This allows us to grow the library of workflows in the Network Reasoner window with industry-specific as well as other interesting and time-saving workflows. What tedious networking tasks would you like to automate? Let me know in the comments below!

If you haven’t yet installed the latest Cisco DNA Center software (version 2.1.2.x), the newly expanded machine reasoning engine is a great reason to do it. Look for continued development in our AI/ML machine reasoning engine in the coming releases with features for compliance verification (HIPPA, PCI, and DSS), network consistence checks (DNS, DHCP, IPAM, and AAA), security vulnerabilities (PSIRTs), and more.

Source: cisco.com

Saturday, 26 September 2020

Automated response with Cisco Stealthwatch

Cisco Stealthwatch provides enterprise-wide visibility by collecting telemetry from all corners of your environment and applying best in class security analytics by leveraging multiple engines including behavioral modeling and machine learning to pinpoint anomalies and detect threats in real-time. Once threats are detected, events and alarms are generated and displayed within the user interface. The system also provides the ability to automatically respond to, or share alarms by using the Response Manager. In release 7.3 of the solution, the Response Management module has been modernized and is now available from the web-based user interface to facilitate data-sharing with third party event gathering and ticketing systems. Additional enhancements include a range of customizable action and rule configurations that offer numerous new ways to share and respond to alarms to improve operational efficiencies by accelerating incident investigation efforts. In this post, I’ll provide an overview of new enhancements to this capability.

Benefits: 

◉ The new modernized Response Management module facilitates data-sharing with third party event gathering and ticketing systems through a range of action options.

◉ Save time and reduce noise by specifying which alarms are shared with SecureX threat response.

◉ Automate responses with pre-built workflows through SecureX orchestration capabilities.

Cisco Prep, Cisco Learning, Cisco Tutorial and Material, Cisco Certification
The Response Management module allows you to configure how Stealthwatch responds to alarms. The Response Manager uses two main functions:

◉ Rules: A set of one or multiple nested condition types that define when one or multiple response actions should be triggered.

◉ Actions: Response actions that are associated with specific rules and are used to perform specific types of actions when triggered.

Cisco Prep, Cisco Learning, Cisco Tutorial and Material, Cisco Certification
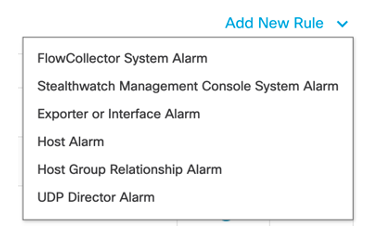
Response Management module Rule types consist of the six alarms depicted above.

Alarms generally fall into two categories:


Threat response-related alarms:

◉ Host: Alarms associated with core and custom detections for hosts or host groups such as C&C alarms, data hoarding alarms, port scan alarms, data exfiltration alarms, etc.

◉ Host Group Relationship: Alarms associated with relationship policies or network map-related policies such as, high traffic, SYN flood, round rip time, and more.

Stealthwatch appliance management-related alarms:

◉ Flow Collector System: Alarms associated with the Flow Collector component of the solution such as database alarms, raid alarms, management channel alarms, etc.

◉ Stealthwatch Management Console (SMC) System: Alarms associated with the SMC component of the solution such as Raid alarms, Cisco Identity Services Engine (ISE) connection and license status alarms.

◉ Exporter or Interface: Alarms associated with exporters and their interfaces such as interface utilization alarms, Flow Sensor alarms, flow data exporter alarms, and longest duration alarms.

◉ UDP Director: Alarms associated with the UDP Collector component of the solution such as Raid alarms, management channel alarms, high availability Alarms, etc.

Cisco Prep, Cisco Learning, Cisco Tutorial and Material, Cisco Certification
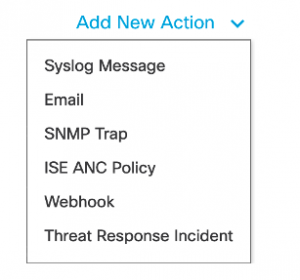
Choose from the above Response Management module Action options.
 
Available types of response actions consist of the following:

◉ Syslog Message: Allows you to configure your own customized formats based off of alarm variables such as alarm type, source, destination, category, and more for Syslog messages to be sent to third party solutions such as SIEMs and management systems.

◉ Email: Sends email messages with configurable formats including alarm variables such as alarm type, source, destination, category, and more.

◉ SNMP Trap: Sends SNMP Traps messages with configurable formats including alarm variables such as alarm type, source, destination, category, etc.
ISE ANC Policy: Triggers Adaptive Network Control (ANC) policy changes to modify or limit an endpoint’s level of access to the network when Stealthwatch is integrated with ISE.

◉ Webhook: Uses webhooks exposed by other solutions which could vary from an API call to a web triggered script to enhance data sharing with third-party tools.

◉ Threat Response Incident: Sends Stealthwatch alarms to SecureX threat response with the ability to specify incident confidence levels and host information.

The combination of rules and actions gives numerous possibilities on how to share or respond to alarms generated from Cisco Stealthwatch. Below is an example of a usage combination that triggers a response for employees connected locally or remotely in case their devices triggers a remote access breach alarm or a botnet infected host alarm. The response actions include isolating the device via ISE, sharing the incident to SecureX threat response and opening up a ticket with webhooks.

Cisco Prep, Cisco Learning, Cisco Tutorial and Material, Cisco Certification
1) Set up rules to trigger when an alarm fires, and 2) Configure specific actions or responses that will take place once the above rule is triggered.

The ongoing growth of critical security and network operations continues to increase the need to reduce complexity and automate response capabilities. Cisco Stealthwatch release 7.3.0’s modernized Response Management module helps to cut down on noise by eliminating repetitive tasks, accelerate incident investigations, and streamline remediation operations through its industry leading high fidelity and easy to configure automated response rules and actions.

Thursday, 10 September 2020

Introducing Stealthwatch product updates for enhanced network detection and response

Cisco Exam Prep, Cisco Tutorial and Material, Cisco Learning, Cisco Stealthwatch, Cisco Cert Exam

We are very excited to announce new features of Cisco Stealthwatch! With release 7.3.0, we are announcing significant enhancements for the Stealthwatch Administrator and the Security Analyst to detect and respond to threats faster and manage the tool more efficiently.

Automated Response updates


Release 7.3, introduces automated response capabilities to Stealthwatch, giving you new methods to share and respond to alarms through improvements to the Response Management module, and through SecureX threat response integration enhancements.

New methods for sharing and responding to alarms

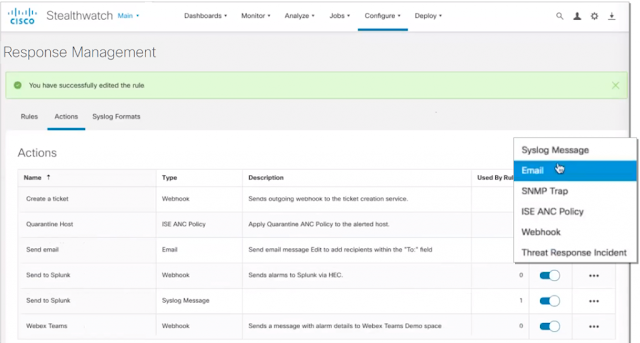
Stealthwatch’s Response Management module has been moved to the web-based UI and modernized to facilitate data-sharing with 3rd party event gathering and ticketing systems. Streamline remediation operations and accelerate containment through numerous new ways to share and respond to alarms through a range of customizable action and rule options. New response actions include:

◉ Webhooks to enhance data-sharing with third-party tools that will provide unparalleled response management flexibility and save time

◉ The ability to specify which malware detections to send to SecureX threat response as well as associated response actions to accelerate incident investigation and remediation efforts

◉ The ability to automate limiting a compromised device’s network access when a detection occurs through customizable quarantine policies that leverage Cisco’s Identity Services Engine (ISE) and Adaptive Network Control (ANC)

Cisco Exam Prep, Cisco Tutorial and Material, Cisco Learning, Cisco Stealthwatch, Cisco Cert Exam

Figure 1. Modernized Response Management module with new response action options

SecureX threat response integration enhancements

Get granular and be specific with flexible rule configurations that provide the ability to:

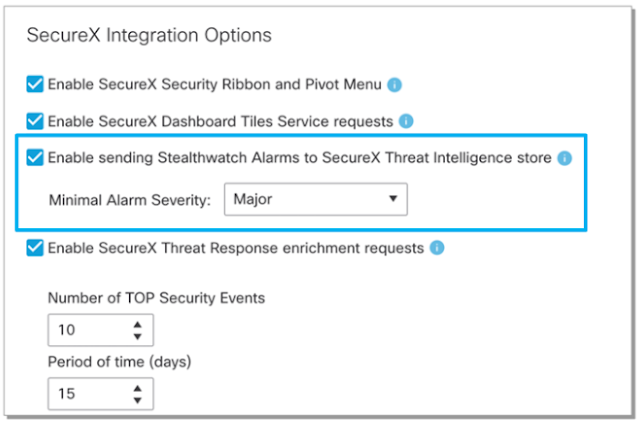
◉ Define which alarms from Stealthwatch are shared with SecureX threat response

◉ Base shared alarms off multiple parameters, such as alarm severity, alarm type, and host group

◉ Share alarms from mission critical services with the ability to define incident confidence levels, how target objects are formed, and rule conditions based off targets created for internal or external hosts

Cisco Exam Prep, Cisco Tutorial and Material, Cisco Learning, Cisco Stealthwatch, Cisco Cert Exam

Figure 2. Customize which alarms are sent to SecureX threat response by severity

SecureX platform integration enhancements

Cisco’s SecureX platform unifies visibility, centralizes alerts, and enables automation across your entire security infrastructure on a single dashboard. Maximize operational efficiency, eliminate repetitive tasks, simplify business processes, and reduce human errors by:

1. Automating responses with pre-built workflows through SecureX’s orchestration capabilities
2. Creating playbooks with all your integrated security tools through SecureX’s intuitive interface

Cisco Exam Prep, Cisco Tutorial and Material, Cisco Learning, Cisco Stealthwatch, Cisco Cert Exam

Figure 3. SecureX’s pre-built workflows and customizable playbooks

Enhanced security analytics


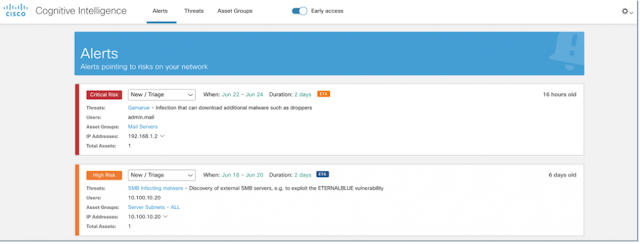
As threats continue to evolve, so do the analytical capabilities of Stealthwatch to deliver fast and high-fidelity threat detections. The cloud-based machine learning engine (Cognitive Intelligence) has been updated to include:

◉ New confirmed detections
◉ New machine learning classifiers for anomalous TLS fingerprint, URL superforest, and content spoofing detections
◉ Smart alert fusion in the new user interface (currently available in beta)
◉ New Stealthwatch use cases including Remote Access Trojan and Emotet malware detections

Cisco Exam Prep, Cisco Tutorial and Material, Cisco Learning, Cisco Stealthwatch, Cisco Cert Exam

Figure 4. An example of the new content spoofing detector classifier in action.

Cisco Exam Prep, Cisco Tutorial and Material, Cisco Learning, Cisco Stealthwatch, Cisco Cert Exam

Figure 5. Stealthwatch’s new GUI with smart alert fusion.

Easier management


Web UI improvements

Don’t let the setup process slow you down! Optimize installation with web UI enhancements that reduce deployment time and support full configuration of (both?) the appliance and vital services before the first reboot to save time.

Flow Sensor versatility and visibility enhancements

Get visibility into more places than ever before through ERSPAN (Encapsulated Remote Switch Port Analyzer) support now added to Flow Sensors. Benefits include:

◉ Visibility improvements through the ability to see within VMware’s NSX-T data centers to facilitate Flow Sensor deployment and network configuration

◉ Removed requirement of direct physical connectivity

◉ ACI traffic monitoring from Spine and Leaf nodes

Wednesday, 2 September 2020

Tools to Help You Deliver A Machine Learning Platform And Address Skill Gaps

Public Clouds have set the pace and standards for satisfying Data Scientist’s technology needs, but on-premise offerings are starting to be viable using innovations such as Kubernetes and Kubeflow.

…but it still can be hard!

With expectations  set very high in Public Cloud, ML platforms delivered on-premise by IT teams have been made even more difficult because the automation flows and their associated tooling  to power these, have been well-hidden behind public cloud customer consoles and therefore, the process to replicate these is not very obvious.

Even though abstraction technologies, such as Kubernetes, reflect and relate well to the underlying infrastructure, the education needed to bridge current Data Center skills over to  cloud native tools takes enthusiasm and persistence in the face of potential frustration as these technology ‘stacks’ are learned and mastered.

Considering this, the Cisco community has developed an open source tool named “MLAnywhere” to  assist with the skills needed for  cloud native ML platforms.  MLAnywhere provides an actual, usable deployed Kubeflow workflow (pipeline) with sample ML applications, all of this on top of Kubernetes via a clean and intuitive interface. As well as addressing the educational aspects for IT teams, it significantly speeds up and automates the deployment of a Kubeflow environment including many of the unseen essential aspects.

How MLAnywhere works


MLAnywhere is a simple Microservice, built using container technologies, and designed to be easily installed, maintained and evolved. The fundamental goal of this open-source project is to help IT teams understand what it takes to configure these environments whilst providing the Data Scientist a usable platform, including real world examples of ML code built into the tool via Jupyter Notebook samples.

The installation process is very straight forward — simply download the project files from the Cisco DevNet repository, follow the instructions to build a container using a Dockerfile, and launch the resulting container on an existing Kubernetes cluster.

Cisco Prep, Cisco Tutorial and Materials, Cisco Learning, Cisco Certification

Image 1: MLA Installation Process

MLAnywhere layers on top of technologies such as the Cisco Container Platform, a Kubernetes cluster management solution. Cisco Container Platform greatly simplifies both  day-1 deployment, and day-2 operations of Kubernetes and does so in a secure, production-grade and fully- supported fashion.

Importantly for ML workloads, Cisco Container Platform also eases the burden of having to align GPU drivers and software as MLAnywhere uses the Cisco Container Platform provided APIs to seamlessly consume the underlying GPU resources upon the deployment of the supporting Kubernetes clusters, and exposes these into the Kubeflow tools.

So what’s in it for IT Operations teams?


For IT teams, clear descriptive explanatory steps are presented within the ML interface for deploying the relevant elements, including the all-important logging information to help educate the user on what is going on under the surface, and what it takes within the underlying Kubernetes platform to prepare, deploy and run the Kubeflow tooling.

Cisco Prep, Cisco Tutorial and Materials, Cisco Learning, Cisco Certification

Image 3: MLAnywhere driven Kubeflow deployment

Not forgetting the Data Scientists


On the Data Scientist’s side, many  will have experience using traditional methodologies in the ML space and therefore will see the benefits that container technology can bring in areas such as dependencies, environment variables management and GPU driver deployments. But importantly, they get to do this whilst leveraging the scale and speed that Kubernetes brings, from the comfort of the abstraction away from the infrastructure, and still uses well known frameworks such as Tensorflow and Pytorch.

As the ML engineers and data scientists are generally more concerned about getting access to the actual dashboards and tools than the underlying plumbing, appropriate links are provided within MLAnywhere to the Kubeflow interface as the environments are dynamically built out on-demand.

Cisco Prep, Cisco Tutorial and Materials, Cisco Learning, Cisco Certification

Image 4: Kubeflow Interface

What does the future hold?


Hopefully you can see that MLAnywhere can bring quick and instant value to various teams involved in the ML process with a focus on the educational aspects helping Data Scientists and IT Operation teams make the transition over to cloud native methodologies.

Moving forward, we will continue to add further nuggets of value into MLA but an important aspect to point out is we intend to merge this project with another Cisco initiative around Kubeflow called “The Cisco Kubeflow Starter Pack”  as these two complementary approaches when combined, will bring their best aspects together into a compelling open source project.

Finally, we will leave you with a practical note, a well used phrase in the ML world is “it takes many months to deliver an ML platform into the hands of data scientists”, MLAnywhere can do this in less than 30 minutes!!

Saturday, 28 March 2020

Cisco Announces Kubeflow Starter Pack

Recently the Kubeflow Community released Kubeflow 1.0. Kubeflow brings together features such as TensorFlow, PyTorch, and other machine learning capabilities into a cohesive tool – from data ingestion to inferencing. Cisco is one of the top contributors to Kubeflow, helping to make operationalizing machine learning for large scale deployments easier for everyone. As a result, we are announcing Cisco Kubeflow Starter Pack.

Here are are the major components of Kubeflow 1.0:

Jupyter Notebook


Many data science teams live on Jupyter notebook since it allows them to collaborate and share their projects, with multi-tenant support. Personally, I use it to develop Python code because I like its ability to single step my code, with immediate results. Within the data science context, Jupyter becomes the primary user interface for data scientists, machine learning engineers.

TensorFlow and Other Deep Learning Frameworks


Originally designed to only support TensorFlow, Kubeflow version 1.0 now supports other deep learning frameworks, including PyTorch. These are two of the leading deep learning frameworks that customers are asking about today.

Model Serving


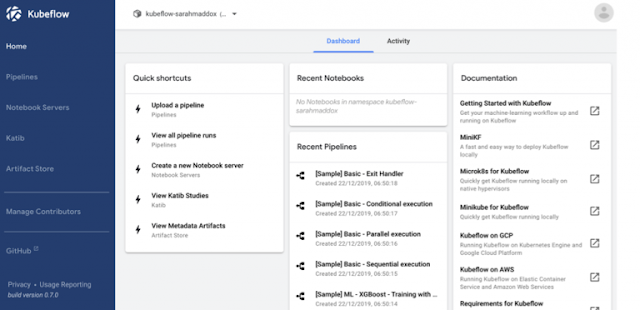
Once a machine learning model is created, the data science team often must create an application or web page to feed new data and execute the trained model.  With Kubeflow, there are built-in capabilities with TFServing enabling models to be used without worrying about the detailed logistics of a custom application.  As you can see in the screen shot below, the data pipeline enables data model to be served.  In fact, the model can be called through a URL.

Cisco Prep, Cisco Tutorial and Materials, Cisco Learning, Cisco Kubeflow, Cisco Certifications

Kubeflow Data Pipeline. Note the Deploy Stage for Trained Model Serving

Cisco Prep, Cisco Tutorial and Materials, Cisco Learning, Cisco Kubeflow, Cisco Certifications

Kubeflow Model Serving. Note the “Service endpoint” URL where the trained model can be accessed

Other Components


There are many other components to Kubeflow, including integration with other open source projects that enable more advanced model inferencing, such as Seldon Core. The Kubeflow Pipelines platform, currently in beta, allows users to define a machine learning workflow from data ingestion through training and inferencing.

As you can see, Kubeflow is an open source integrated tool chain for data science teams.  At the same time, Kubeflow enables the IT team to manage the infrastructure for the resulting data pipeline.

Cisco Kubeflow Starter Pack


To enable IT teams to work more closely with their data science counterparts, Cisco is introducing the Cisco Kubeflow Starter Pack, which provides IT teams with a baseline set of tools to get started with Kubeflow. The Cisco Kubeflow Starter Pack includes:

     ◉ Kubeflow Installer: Deploys Kubeflow on Cisco UCS and HyperFlex

     ◉ Kubeflow Ready Checker: Checks the system requirements for Kubeflow deployment. It also checks whether the particular prescribed Kubernetes distribution is able to support Kubeflow.

     ◉ Sample Kubeflow Data Pipelines: Cisco will be releasing multiple Kubeflow pipelines to provide data science teams working Kubeflow use cases for them to experiment with and enhance.

     ◉ Cisco Kubeflow Community Support:  Cisco will be providing free community support for Cisco customers who would like to check out Kubeflow.

Thursday, 20 February 2020

Answering The Big Three Data Science Questions At Cisco

Data Science Applied In Business


In the past decade, there has been an explosion in the application of data science outside of academic realms. The use of general, statistical, predictive machine learning models has achieved high success rates across multiple occupations including finance, marketing, sales, and engineering, as well as multiple industries including entertainment, online and store front retail, transportation, service and hospitality, healthcare, insurance, manufacturing and many others. The applications of data science seem to be nearly endless in today’s modern landscape, with each company jockeying for position in the new data and insights economy. Yet, what if I told you that companies may be achieving only a third of the value they could be getting with the use of data science for their companies? I know, it sounds almost fantastical given how much success has already been achieved using data science. However, many opportunities for value generation may be getting over looked because data scientists and statisticians are not traditionally trained to answer some of the questions companies in industry care about.

Most of the technical data science analysis done today is either classification (labeling with discrete values), regression (labeling with a number), or pattern recognition. These forms of analysis answer the business questions ‘can I understand what is going on’ and ‘can I predict what will happen next’. Examples of questions are ‘can I predict which customers will churn?’, ‘can I forecast my next quarter revenue?’, ‘can I predict products customers are interested in?’, ‘are there important customer activity patterns?’, etc… These are extremely valuable questions to companies that can be answered by data science. In fact, answering these questions is what has caused the explosion in interest in applying data science in business applications. However, most companies have two other major categories of important questions that are being totally ignored. Namely, once a problem has been identified or predicted, can we determine what’s causing it? Furthermore, can we take action to resolve or prevent the problem?

I start this article discussing why most data driven companies aren’t as data driven as they think they are. I then introduce the idea of the 3 categories of questions companies care about the most (The Big 3), discuss why data scientists have been missing these opportunities. I then outline how data scientists and companies can partner to answer these questions.

Why Even Advanced Tech Companies Aren’t as Data Driven As They Think They Are.


Many companies want to become more ‘data driven’, and to generate more ‘prescriptive insights’. They want to use data to make effective decisions about their business plans, operations, products and services. The current idea of being ‘data driven’ and ‘prescriptive insights’ in the industry today seems to be defined as using trends or descriptive statistics about about data to try to make informed business decisions. This is the most basic form of being data driven. Some companies, particularly the more advanced technology companies go a step further and use predictive machine learning models and more advanced statistical inference and analysis methods to generate more advanced descriptive numbers. But that’s just it. These numbers, even those generated by predictive machine learning models, are just descriptive (those with a statistical background must forgive me for the overloaded use of the term ‘descriptive’). They may be descriptive in different ways, such as machine learning generating a predicted number about something that may happen in the future, while a descriptive statistic indicates what is happening in the present, but these methods ultimately focus on producing a number. To take action to bring about a desired change in an environment requires more than a number. It’s not enough to predict a metric of interest. Businesses want to use numbers to make decisions. In other words, businesses want causal stories. They want to know why a metric is the way it is, and how their actions can move that metric in a desired direction. The problem is that classic statistics and data science falls short in pursuit of answers to these questions.

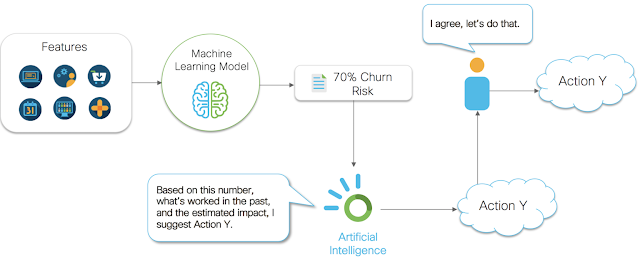
Take the example diagram shown in figure 1 below. Figure 1 shows a very common business problem of predicting the risk of a customer churning. For this problem, a data scientist may gather many pieces of data (features) about a customer and then build a predictive model. Once a model is developed, it is deployed as a continually running insight service, and integrated into a business process. In this case, let’s say we have a renewal manager that wants to use these insights. The business process is as follows. First, the automated insight service that was deployed gathers data about the customer. It then passes that data to the predictive model. The predictive model then outputs a predicted risk of churn number. This number is then passed to the renewal manager. The renewal manager then uses their gut intuition to determine what action to take to reduce the risk of churn. This all seems straightforward enough. However, we’ve broken the chain of being data driven. How is that you ask? Well, our data driven business process stopped at the point of generating our churn risk number. We simply gave our churn risk number to a human, and they used their gut intuition to make a decision. This isn’t data driven decision making, this is gut driven decision making. It’s a subtle thing to notice, so don’t feel too bad if you didn’t see it at first. In fact, most people don’t recognize this subtlety. That’s because it’s so natural these days to think that getting a number to a human is how making ‘data driven decisions’ works. The subtlety exists because we are not using data and statistical methods to evaluate the impact of actions the human can take on the metric they care about. A human sees a number or a graph, and then *decides* to take *action*. This implies they have an idea about how their *action* will *effect* the number or graph that they see. Thus, they are making a cause and effect judgement about their decision making and their actions. Yet, they aren’t using any sort of mathematical methods for evaluating their options. They are simply using their personal judgement to make a decision. What can end up happening in this case is that a human may see a number, make a decision, and end up making that number worse.

Let’s take the churn risk example again. Let’s say the customer is 70% likely to churn and that they were likely to churn because their experience with the service was poor, but assume that the renewal manager doesn’t know this (this too is actually a cause and effect statement). Let’s also say that a renewal manager sends a specially crafted renewal email to this customer in an attempt to reduce the likelihood of churn. That seems like a reasonable action to take, right? However, this customer receives the email, and is reminded of how bad their experience was, and is now even more annoyed with our company. Suddenly the likelihood to churn increases to 90% for this customer. If we had taken no action, or possibly a different action (say connecting them with digital support resources) then we would have been better off. But without an analysis of cause and effect, and without systems that can analyze our actions and prescribe the best ones to take, we are gambling with the metrics we care about.

Cisco Prep, Cisco Tutorial and Material, Cisco Guides, Cisco Certifications, Ciscoa Learning
Figure 1

So how can we attempt to solve this problem? We need to incorporate mathematical models and measurement into the business process after the number is generated. We need to collect data on what actions are being taken, measure their relationship with the metrics we care about, and then optimize over our actions using causal inference models and AI systems. Figure 2 below shows how we can insert an AI system into the business process to help track, measure, and optimize the actions our company is taking. Using a combination of mathematical analysis methods, we can begin to optimize the entire process using data science end to end. The stages of this process can be abstracted and generalized as answering 3 categories of questions companies care about. Those 3 categories are described in the next section.

Cisco Prep, Cisco Tutorial and Material, Cisco Guides, Cisco Certifications, Ciscoa Learning

Comparing Machine Learning to Causal Analysis (Inference)


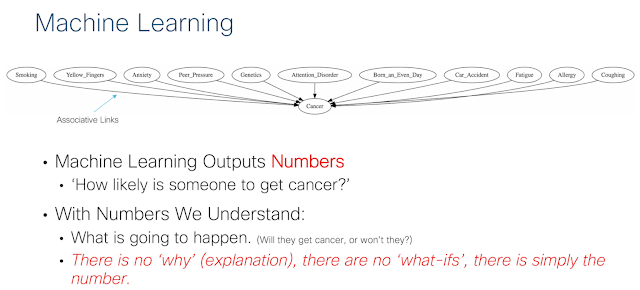
To get a better understanding of what machine learning does and where it falls short, we introduce figure 3 and figure 4 below. Figure 3 and Figure 4 both describe the problem space of understanding cancer. Machine learning can be used to do things like predict whether or not a patient will get cancer given characteristics that have been measured about them. Figure 3 shows this by assigning directed arrows from independent variables to the dependent variable (in this case cancer). These links are associative by their construction. The main point is that machine learning focuses on numbers and the accurate production of a number. This can in many cases be enough to gain a significant amount of value. For example, predicting the path of a hurricane has value on it’s own. There exists no confusion about what should be done given the prediction. If you are in the predicted path of the hurricane, the action is clearly to get out of the way. Sometimes however, we want to know why something is happening. Many times we want to play ‘what-if’ games. What if the patient stopped smoking? What if the patient had less peer pressure? To answer these questions, we need to perform a causal analysis.

Cisco Prep, Cisco Tutorial and Material, Cisco Guides, Cisco Certifications, Ciscoa Learning
Figure 3

Figure 4 below shows a visual example of what causal analysis provides. Causal analysis outputs stories, not just numbers. The diagram shows the directed causal links between all variables in an environment. For example, given this diagram anxiety causes smoking. Causal stories are important any time we or our business stakeholders want to take action to improve the environment. The causal story allows us to quantify cause and effect relationships, play what-if scenarios, and perform root-cause analysis. Machine learning falls short of being able to do this because these all require a modeling of cause and effect relationships.

What Are the Big 3?


Cisco Prep, Cisco Tutorial and Material, Cisco Guides, Cisco Certifications, Ciscoa Learning
Figure 5

Figure 5 above describes what ‘The Big 3’ questions companies care about are. The big 3 questions seem fairly obvious. In fact, these questions are at the foundation of most of problem solving in the real world. Yet, almost all data science in industry today revolves around answering only the first question. What most data scientists understand as supervised, unsupervised, and semi-supervised learning revolves around answering what is happening or what will happen. Even with something like a product recommendation system (which you might believe prescribes something because of the term ‘recommend’), we only know what products a customer is interested in (thus it’s only an indication of interest, not a reason for interest). We don’t know the most effective way to act on that information. Should we send an ad? Should we call them? Do certain engagements with them cause a decrease their chances of purchase? To answer what is *causing* something to happen, we need to rely on foundational work in the area of Causal Inference developed by researchers like Ronald Fisher, Jerzy Neyman, Judea Pearl, Donald B. Rubin, Paul Holland, and many others. Once we understand what is causing a metric we care about, we can at least begin to think intelligently about the actions we can take to change those metrics. This is where the third question mentioned in figure 3 above comes in. To answer this question we can rely on a wide variety of techniques that have been developed including causal inference for the cause and effect relationship between actions and the metrics they are supposed to affect, statistical decision theory, decision support systems, control systems, reinforcement learning, and game theory.

Cisco Prep, Cisco Tutorial and Material, Cisco Guides, Cisco Certifications, Ciscoa Learning
Figure 6

Figure 6 above breaks down some of the methods in a more technical way. The methodology column outlines the major methods, fields, and approaches that can be in general used each of the big 3 questions in turn. The algorithms column lists some specific algorithms that may be applied to answer each of the big 3 questions. While some of these algorithms should be familiar to the average data scientist (deep neural networks, random forests, etc.), others are maybe only known in passing (multi-armed bandits, reinforcement learning, etc). Still more algorithms are likely to be totally new to some data scientists (Difference in Differences, Propensity Score Matching, etc). The main paper delves into each question and the important technical details of the methods used to answer each question. It’s very important to understand these methods, particularly for performing causal analysis and optimizing actions. These methods are highly nuanced, with many difference kinds of assumptions. Naively applying these methods without understanding their limitations and assumptions will almost certainly lead to incorrect conclusions.

Example Use Case for Renewals.


A well known question, in which we have applied the big 3 methodology, is for understanding Cisco product and service renewals. Understanding and predicting renewals is a prime example of how many companies are attempting to get value through data science. The problem is also typically referred to as predicting churn, churn risk prediction, predicting attrition. Focusing on renewals is also useful for demonstration purposes because most of the data science applied to problems of this kind fall short of providing full value. That’s because renewals is a problem where providing a number is not the goal. Simply providing likelihood of a customer to renew is not enough. The company wants to **do** something about this. The company wants to take action to cause an increase in the likelihood to renew. For this, and any other time where the goal is to **do** something, we rely on causal inference and methods for optimizing actions.

Question 1: What is happening or will happen?

As we’ve already stated, the main question that is typically posed to a team of data scientists is ‘Can we accurately predict which customers will renew and which ones won’t?’ While this is a primary question asked by the business, there are many other questions that fall into the area of prediction and pattern mining including,

1. How much revenue can we expect from renewals? What does the distribution look like?
2. What’s the upper/lower bound on the expected revenue predicted by the models?
3. What are the similar attributes among customers likely to churn versus not churn?
4. What are the descriptive statistics for customers likely to churn vs not churn collectively, in each label grouping, and in each unsupervised grouping?

Each of the above questions can be answered systematically by framing them as problems either in prediction or pattern mining, and by using the wide variety of mathematical methods found in the referenced materials in the main paper here. These are the questions and methods data scientists are most familiar, and will most commonly be answered for a business.

Question 2: Why is this happening or going to happen?

Given this first question, the immediate next question is why. Why are customers likely or not likely to churn? For each question that we can build a model for, we can also perform a causal analysis. Thus, we can already potentially double the value that a data science project returns by simply adding on a causal analysis to each predictive model built. It’s important to bring up again that this question is so important that most data scientists are either answering it incorrectly, or are misrepresenting the information from statistical associations.

Specifically, when a data scientist is asked the question of why a customer is likely to churn, they almost exclusively turn to feature importance and local models such as LIME, SHAP, and others. These methods for describing the reason for a prediction are almost always incorrect because there is a disconnect between what the business stakeholder is asking for and what the data scientist is providing because of two different interpretations of the term ‘why’. Technically, one can argue that feature importance measures what features are important to ‘why’ a model makes a prediction, and this would be correct. However, a business stakeholder usually wants to know ‘what is causing the metric itself’ and not ‘what is causing the metric prediction’. The business stakeholder wants to know the causal mechanisms for why a metric is a particular number. This is something that feature importance absolutely does not answer. The stakeholder wants to use the understanding of the causal mechanisms to take an action to change the prediction to be more in their favor. This requires a causal analysis. However, most data scientists simply take the features with highest measured importance and present them to the stakeholder as though they are the answer to their causal question. This is objectively wrong, yet is time and again presented to stakeholders by seasoned statisticians and data scientists.

The issue is compounded by the further confusion added by discussions around ‘interpretable models’ and by the descriptions of feature importance analysis. LIME describes it’s package as ‘explaining what machine learning classifiers (or models) are doing’. While still a technically correct statement, these methods are being used to incorrectly answer causal questions, leading stakeholders to take actions that may have the opposite effect of what they intended.

While we’ve outlined the main causal question, there are a number of questions that can also be asked, and corresponding analysis that can be performed including,

1. How are variables correlated with each other and the churn label? (A non-causal question)

2. What are the important features for prediction in a model in general? (A non-causal question)

3. What are the most important features for prediction for an individual? Do groupings of customers with locally similar relationships exist? (A non-causal question)

4. What are the possible confounding variables? (A causal question)

5. After controlling for confounding variables, how do the predictions change? (A non-causal question benefiting from causal methods)

6. What does the causal bayes net structure look like? What are all of the reasonable structures? (A causal question)

7. What are the causal effect estimates between variables? What about between variables and the class label? (A causal question).

Many of these questions can be answered in whole or in part by a thorough causal analysis using the methods we outlined in the corresponding causal inference section of the main paper here, and further multiply the value returned by a particular data science project.

Question 3: How can we take action to make the metrics improve?

The third question to answer is ‘what actions can a stakeholder take to prevent churn?’ This is ultimately the most valueable of the three questions. The first two question set the context for who to focus on and where to focus efforts. Answering this question provides stakeholders with a directed and statistically valid means to improve the metrics they care about given complex environments. While still challenging given the methods available today (and presented in the section on intelligent action), it provides one of the greatest value opportunities. Some other questions that can be answered related to intelligent action that stakeholders may be interested in include,

1. What variables are likely to reduce churn risk if our actions could influence them?

2. What actions have the strongest impact on the variables that are likely to influence churn risk, or to reduce churn risk directly?

3. What are the important pieces of contextual information relevant for taking an action?

4. What are the new actions that should be developed and tested in an attempt to influence churn risk?

5. What actions are counter-productive or negatively impact churn risk?

6. What does the diminishing marginal utility of an action look like? At what point should an action no longer be taken?

The right method to use for prescribing intelligent action depends largely on the problem and the environment. If the environment is complex, the risks high, and there is not much chance for an automated system to be implemented, then methods from causal inference, decision theory, influence diagrams, and game theory based analysis are good candidates. However, if a problem and stakeholder are open to the use of an automated agent to learn and prescribe intelligent actions, then reinforcement learning may be a good choice. While possibly the most valuable of the big three questions to answer, it also exists as one of the most challenging. There still many open research questions related to answering this question, but the value proposition means that it’s likely an area that will see increased industry investment in the coming years.

How We Are Improving CX By Using Data Science to Answer the Big 3 at Cisco.


Like many other companies, Cisco has many models for answering the first of the big 3 questions. The digital lifecycle journey data science team has many predictive models for understanding Cisco’s customers. This includes analysis of customer purchasing behavior, digital activity, telemetry, support interaction, and renewal activity using a wide variety of machine learning based algorithms. We also apply the latest and greatest forms of advanced statistical and deep learning based supervised learning methods for understanding and predicting the expected behavior of our customers, their interactions with Cisco, and their interactions with Cisco products and services. We go a step further in this area by attempting to quantify and predict metrics valuable to both Cisco and Cisco’s customers. For example, we predict metrics like how a customer is going to keep progressing through the expected engagement with their product over the next several days to next several weeks. This is just one of the many metrics we are trying to understand about the Cisco customer experience. Others include customer satisfaction, customer health, customer ROI, renewal metrics, and many others. These metrics allow us to understand where there may be issues with our journey so that we can start trying to apply data science methods to answer the ‘why’ and ‘intelligent action’ questions we’ve previously mentioned.

We are also using causality to attempt to understand the Cisco’s customer experience, and what causes a good or bad customer experience. We go a step further by trying to complete the causal chain of reasoning to quantify how a customer experience causes Cisco’s business metrics to rise and fall. For example, we’ve used causal inference methods to measure the cause and effect aspects of customer behavior, product utilization, and digital engagements on a customer’s likelihood to renew Cisco services. Using causal inference, we are gaining deeper insights into what is causing our customers and Cisco to succeed or fail, and are using that information to guide our strategy for maximizing the customer experience.

Finally, to answer the third of the big three questions, we are employing causality, statistical decision theory, intelligent agent theory, and reinforcement learning to gain visibility to the impact our activities have on helping our customers and improving Cisco’s business metrics, and to learn to prescribe optimal actions over time to maximize these metrics. We have developed intelligent action systems that we working to integrate with our digital email engagements journeys to optimize our interactions with customers to help them achieve a return on investment. We are, in general, applying this advanced intelligent agent system to quantify the impact of our digital interactions, and to prescribe the right digital customer engagements to have, with the most effective content, at the right time, in the right order, personalized to each and every individual customer.

Why Many Data Scientists Don’t Know the Big 3, or How to Answer Them.


Those learned readers experienced with data science may be asking themselves, ‘is anything new being said here’? It’s true that no new technical algorithm, mathematical analysis, or in depth proof is being presented. I’m not presenting some new mathematical modeling method, or some novel comparison of existing methods. What is new is how I’m framing the problems for data science in industry, and the existing methodologies that can start to solve those problems. Causal inference has been used heavily in medicine for observational studies where controlled trials aren’t feasible, and for things like adverse drug effect discovery. However, Causal Inference hasn’t received wide spread application in areas outside of the medical, economic, or social science fields yet. The idea of prescribed actions is also something that isn’t totally new. Prescribed actions can be thought of as just a restatement of the field of control systems, decision analysis, and intelligent agent theory. However, the utilization of these methods for completing the end-to-end data driven methodology for business hasn’t received wide spread application in industry applications. Why is this? Why aren’t data scientists and businesses working together to frame all of their problems this way?

There could be a couple of reasons for this. The most obvious answer is that most data scientists are trained to answer the first of the big 3 questions. Most data scientists and statisticians are trained on statistical inference, classification, regression, and general unsupervised learning methods like clustering and anomaly detection. Statistical methods like causal inference aren’t widely known, and are therefore not widely taught. Register with any online course, university, or other platform for learning about data science and machine learning and you’ll be hard pressed to find discussions about identifying causal patterns in data sets. The same goes for the ideas of intelligent agents, control systems, and reinforcement learning to a lesser degree. These methods tend to be relegated to domains that have simulators and a tolerance for failure. Thankfully there is less of a gap for these methods. They typically are given their own special courses in either machine learning, electronics, and signals and systems processing curriculums.

Another possible explanation may be that many data scientists in industry tend to be enamored with the latest and greatest popular algorithm or methodology. As math and tech nerds we become enamored with the technical intricacies of how things work, particularly mathematical algorithms and methodologies. We tend to develop models and then go looking for solutions rather than the other way around, potentially blinding us to the methods in data science that can provide business value time and time again.

Yet another explanation may be that many data scientists are not well versed enough in statistics and the statistical literature. Many data scientists are asked questions about how a predictive model produced a number. For example, in our churn risk problem, renewal managers typically want to know why someone is at risk. The average data scientist hears this, and then uses methods like feature importance and more interpretable models to answer this question. However this doesn’t really answer the actual question being asked. The data scientist provides what might be important associations between model inputs and the predicted metric, but this doesn’t provide the information the renewal manager wants. They want to know about information they can act on, which requires cause and effect analysis. This is a classic case of ‘correlation is not causation’ that everyone seems to know but can still trip up even statistically minded data scientists. It’s such an issue that many companies I’ve talked with that claim to provide ‘next best actions’ are statistically invalid (mainly because they use feature importance and sensitivity analysis type methods instead of understanding basic counter factual analysis and confounding variables).

Moving forward the data science community operating in industry domains will become more aware of the big 3 questions and the analysis methods that can be performed to answer them. Companies that can quickly realize value from answering these questions using data science will be at the head of the pack in the emerging data science and insights economy. Companies that focus on answering all of the big 3 questions will have a distinct competitive advantage, and will have transformed themselves to be truly data driven.