Showing posts with label Security Analytics. Show all posts

Thursday, 10 September 2020

Introducing Stealthwatch product updates for enhanced network detection and response

Cisco Exam Prep, Cisco Tutorial and Material, Cisco Learning, Cisco Stealthwatch, Cisco Cert Exam

We are very excited to announce new features of Cisco Stealthwatch! With release 7.3.0, we are announcing significant enhancements for the Stealthwatch Administrator and the Security Analyst to detect and respond to threats faster and manage the tool more efficiently.

Automated Response updates


Release 7.3, introduces automated response capabilities to Stealthwatch, giving you new methods to share and respond to alarms through improvements to the Response Management module, and through SecureX threat response integration enhancements.

New methods for sharing and responding to alarms

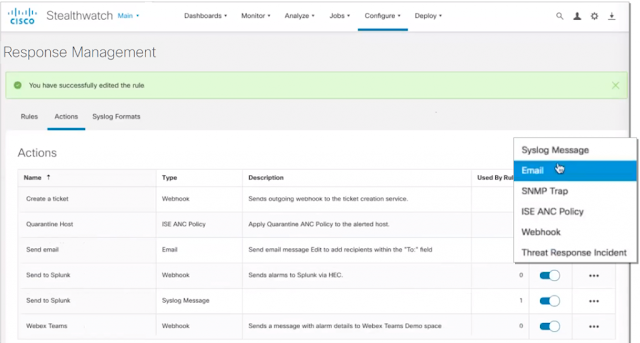
Stealthwatch’s Response Management module has been moved to the web-based UI and modernized to facilitate data-sharing with 3rd party event gathering and ticketing systems. Streamline remediation operations and accelerate containment through numerous new ways to share and respond to alarms through a range of customizable action and rule options. New response actions include:

◉ Webhooks to enhance data-sharing with third-party tools that will provide unparalleled response management flexibility and save time

◉ The ability to specify which malware detections to send to SecureX threat response as well as associated response actions to accelerate incident investigation and remediation efforts

◉ The ability to automate limiting a compromised device’s network access when a detection occurs through customizable quarantine policies that leverage Cisco’s Identity Services Engine (ISE) and Adaptive Network Control (ANC)

Cisco Exam Prep, Cisco Tutorial and Material, Cisco Learning, Cisco Stealthwatch, Cisco Cert Exam

Figure 1. Modernized Response Management module with new response action options

SecureX threat response integration enhancements

Get granular and be specific with flexible rule configurations that provide the ability to:

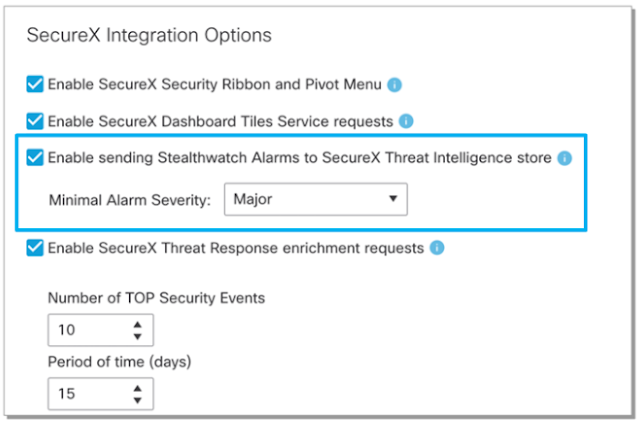
◉ Define which alarms from Stealthwatch are shared with SecureX threat response

◉ Base shared alarms off multiple parameters, such as alarm severity, alarm type, and host group

◉ Share alarms from mission critical services with the ability to define incident confidence levels, how target objects are formed, and rule conditions based off targets created for internal or external hosts

Cisco Exam Prep, Cisco Tutorial and Material, Cisco Learning, Cisco Stealthwatch, Cisco Cert Exam

Figure 2. Customize which alarms are sent to SecureX threat response by severity

SecureX platform integration enhancements

Cisco’s SecureX platform unifies visibility, centralizes alerts, and enables automation across your entire security infrastructure on a single dashboard. Maximize operational efficiency, eliminate repetitive tasks, simplify business processes, and reduce human errors by:

1. Automating responses with pre-built workflows through SecureX’s orchestration capabilities
2. Creating playbooks with all your integrated security tools through SecureX’s intuitive interface

Cisco Exam Prep, Cisco Tutorial and Material, Cisco Learning, Cisco Stealthwatch, Cisco Cert Exam

Figure 3. SecureX’s pre-built workflows and customizable playbooks

Enhanced security analytics


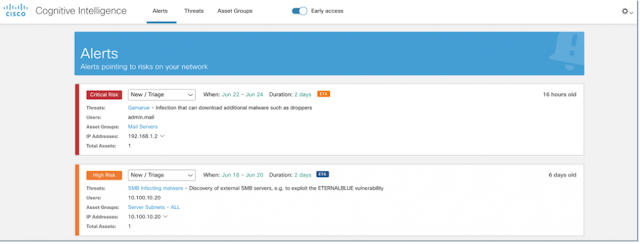
As threats continue to evolve, so do the analytical capabilities of Stealthwatch to deliver fast and high-fidelity threat detections. The cloud-based machine learning engine (Cognitive Intelligence) has been updated to include:

◉ New confirmed detections
◉ New machine learning classifiers for anomalous TLS fingerprint, URL superforest, and content spoofing detections
◉ Smart alert fusion in the new user interface (currently available in beta)
◉ New Stealthwatch use cases including Remote Access Trojan and Emotet malware detections

Cisco Exam Prep, Cisco Tutorial and Material, Cisco Learning, Cisco Stealthwatch, Cisco Cert Exam

Figure 4. An example of the new content spoofing detector classifier in action.

Cisco Exam Prep, Cisco Tutorial and Material, Cisco Learning, Cisco Stealthwatch, Cisco Cert Exam

Figure 5. Stealthwatch’s new GUI with smart alert fusion.

Easier management


Web UI improvements

Don’t let the setup process slow you down! Optimize installation with web UI enhancements that reduce deployment time and support full configuration of (both?) the appliance and vital services before the first reboot to save time.

Flow Sensor versatility and visibility enhancements

Get visibility into more places than ever before through ERSPAN (Encapsulated Remote Switch Port Analyzer) support now added to Flow Sensors. Benefits include:

◉ Visibility improvements through the ability to see within VMware’s NSX-T data centers to facilitate Flow Sensor deployment and network configuration

◉ Removed requirement of direct physical connectivity

◉ ACI traffic monitoring from Spine and Leaf nodes

Thursday, 25 July 2019

Cisco Threat Response Plugin: Defeat Threats With Just a Few Clicks

One of the best tools in your SOC’s arsenal is something you might already have access to and didn’t even have to pay for. If you already deploy Cisco Umbrella, AMP for Endpoints, Firepower devices, next-generation intrusion prevention system (NGIPS), Email Security, or Threat Grid, then you can immediately access Cisco Threat Response for FREE. As in no charge. Zero extra dollars. No strings attached.

With Cisco Threat Response, customers receive a powerful solution that can streamline and simplify detection, investigation, and remediation of threats. In addition, Threat Response offers a very easy, powerful tool in the new browser plugin (for Chrome and Firefox). By adding the plugin, security professionals now have instant access to threat intelligence and response capabilities directly from their browser. To prove the simplicity of this, let’s use a straightforward example.

For the threat, we will use the Karkoff malware, used in the DNSpionage campaign.

Cisco Online Exam, Cisco Tutorials and Material, Cisco Learning, Cisco Certification, Cisco Study Materials

Ah, it seems that Talos has a full spotlight of Karkoff. Towards the bottom of the blog, Talos gives a full report on Indicators of Compromise for Karkoff.

Cisco Online Exam, Cisco Tutorials and Material, Cisco Learning, Cisco Certification, Cisco Study Materials

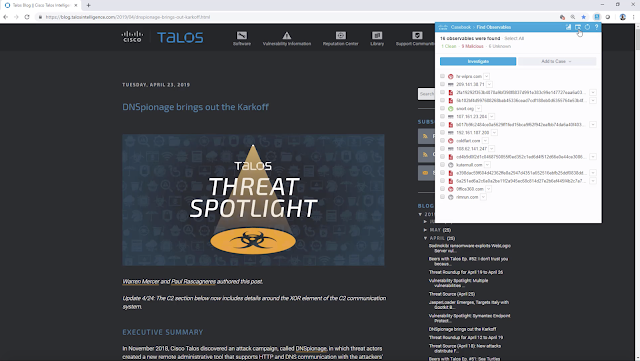
Traditionally, you’d have to manually copy and paste  each file, IP address, etc. from the blog, editing them to remove the defanging “safety brackets”, searching for each one in turn, in each of your telemetry sources – a laborious, manual activity. Cisco Threat Response simplifies this entire process by bringing all of these capabilities to one central source. So, let’s open the Cisco Threat Response browser plugin.

Cisco Online Exam, Cisco Tutorials and Material, Cisco Learning, Cisco Certification, Cisco Study Materials

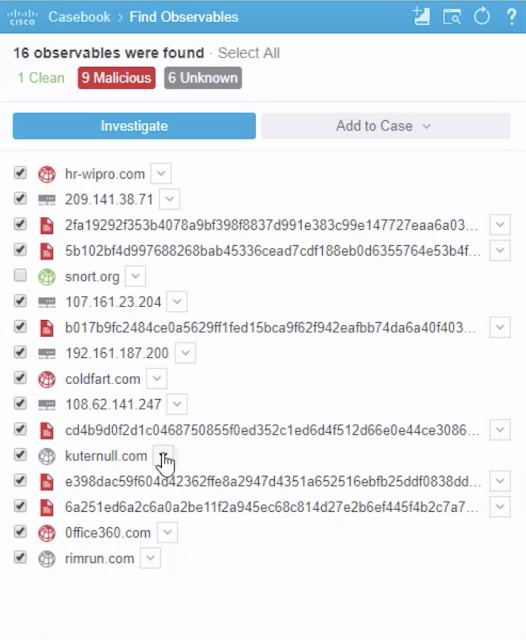
Immediately, Cisco Threat Response identifies 16 observables from this threat intelligence blog. 1 clean. 9 malicious. 6 unknown.

Cisco Online Exam, Cisco Tutorials and Material, Cisco Learning, Cisco Certification, Cisco Study Materials

By clicking the malicious and unknown observables, we can tailor our investigation. We will not worry at all about snort.org, because we know Snorty is never up to anything bad!

Cisco Online Exam, Cisco Tutorials and Material, Cisco Learning, Cisco Certification, Cisco Study Materials

As an example of how quickly we can take response actions, even before pivoting into Threat Response to do a more complete investigation, let’s look at kuternull.com. It is listed as “unknown.” By clicking the dropdown menu next to it, and pivoting out to other trusted intelligence sources like the Talos database or Threat Grid, we could quickly gather more information to determine a course of action.

Cisco Online Exam, Cisco Tutorials and Material, Cisco Learning, Cisco Certification, Cisco Study Materials

For the purposes of simply showing the ease of the plugin, let’s assume we investigated this domain and there is no legitimate business need for our organization to be contacting it. In order to prevent potential malware activity, we will proactively block it now as a first level stopgap while we continue our investigation. Threat Response directly integrates with Umbrella, so we can immediately block the domain across our entire network with one click within the plugin.

Cisco Online Exam, Cisco Tutorials and Material, Cisco Learning, Cisco Certification, Cisco Study Materials

Within a few seconds, Threat Response will flash a green banner confirming the blocking of the domain with Umbrella.

Cisco Online Exam, Cisco Tutorials and Material, Cisco Learning, Cisco Certification, Cisco Study Materials

Now, after blocking a few domains quickly, our network is certainly better protected from Karkoff, but there is more investigation to be done. A quick click of the “Investigate” button will launch Cisco Threat Response’s cloud-based dashboard.

Cisco Online Exam, Cisco Tutorials and Material, Cisco Learning, Cisco Certification, Cisco Study Materials

Cisco Threat Response will automatically load the list of the observables and provide insights with relation graphs, file hashes, and others.

Previously, Security Operations Centers (SOCs) would hear about trending threats and wonder, “Is my network affected by this threat?” To answer that question, it would require a series of manual processes that required investigating observables hundreds of times across the network, and then, writing sufficient policy to defend against these threats. To make life even more difficult, these solutions were often from different vendors and require manual processes to implement across different parts of the next work.

With Cisco Threat Response, within minutes, your SOC can:

1. Identify a trending threat from your SIEM, Talos, other threat intel sources, or virtually any third party product that has a web based interface

2. Identify a list of observables with one click

3. Quickly block domains across the network

4. Launch Cisco Threat Response for further investigation

It is important to note that Cisco Threat Response is a FREE add-on to existing Cisco Security solutions. In the example above, the user has Threat Response integrated with their AMP For Endpoints, Cisco Threat Grid, and Umbrella solutions. In addition, every user of Threat Response automatically gets access to the Talos Intelligence and AMP File Reputation databases for use in Threat Response. While Cisco Threat Response provides significant value when integrated with only one product, it becomes even more useful with each additional Cisco Security solution integration. It offers unparalleled central-management for detection, investigation, and remediation – and the browser plugins bring all those capabilities into any type of web content. Whether it is a blog entry like in this example, any other intelligence source, or the browser-based management console of any Cisco or third-party security or networking product.

Friday, 21 September 2018

Automated Policy & Segmentation Violation Alerting with Stealthwatch Cloud

Stealthwatch Cloud is best known for network behavioral anomaly detection and entity modeling, but the level network visibility value it provides far exceeds these two capabilities. The underlying traffic dataset provides an incredibly accurate recording for every network conversation that has transpired throughout your global network.  This includes traffic at remote locations and deep into the access layer that is far more pervasive than sensor-based solutions could provide visibility into.

Stealthwatch Cloud can perform policy and segmentation auditing in an automated set-it and forget-it fashion. This allows security staff to detect policy violations across firewalls, hardened segments and applications forbidden on user endpoints. I like to call this setting virtual “tripwires” all over your network, unbeknownst to users, by leveraging your entire network infrastructure as a giant security sensor grid. You cannot hide from the network…therefore you cannot hide from Stealthwatch Cloud.

Here is how we set this framework up and put it into action!

1. Navigate to Alerts from the main dashboard under the gear icon:

Cisco Stealthwatch, Cisco Stealthwatch Cloud, Security Analytics, Cisco Certifications

2. Click Configure Watchlists on the Settings screen:

Cisco Stealthwatch, Cisco Stealthwatch Cloud, Security Analytics, Cisco Certifications

3. Click Internal Connection Blacklist on the Watchlist Config screen:

Cisco Stealthwatch, Cisco Stealthwatch Cloud, Security Analytics, Cisco Certifications

4. Here are your options:

Cisco Stealthwatch, Cisco Stealthwatch Cloud, Security Analytics, Cisco Certifications

5. From here you’ll want to fill out the above form as such:

Name:  Whatever you’d like to call this rule, for example “Prohibited outbound RDP” or “permitted internal RDP”Source IP:  Source IP address or CIDR rangeSource Block Size:  CIDR notation block size, for example (0, 8, 16, 24, etc.)Source Ports:  Typically this is left blank as the source ports are usually random ephemeral ports but you have the option if you require a specific source port to trigger the alert.
Destination IP:  Target IP Address or CIDR range

Destination Block Size:  CIDR notation block size, for example (0, 8, 16, 24, etc.)

Destination Ports:  The target port traffic you wish to allow or disallow, for example (21, 3389, etc)

Connections are Allowed checkbox:  Check this if this is the traffic you’re going to permit.  This is used in conjunction with a second rule to specify all other traffic that’s not allowed.

Reason:  Enter a user friendly description of the intent for this rule.

6. Click Add to make the rule active.

7. Here’s an example of a set of rules both permitting and denying traffic on Remote Desktop over TCP 3389:

1. Permit rule:

Cisco Stealthwatch, Cisco Stealthwatch Cloud, Security Analytics, Cisco Certifications

2. Deny Rule:

Cisco Stealthwatch, Cisco Stealthwatch Cloud, Security Analytics, Cisco Certifications

8. Resulting Alert set:

Cisco Stealthwatch, Cisco Stealthwatch Cloud, Security Analytics, Cisco Certifications

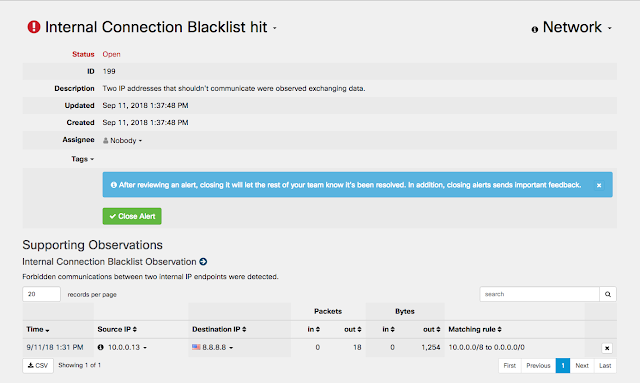
9. Now to test this new ruleset, I will attempt two RDP connections within my Lab.  The first will be a lateral connection to another host on the 10.0.0.0/8 subnet and the second to an external IP residing on the public Internet.

10. Here is the resulting observation that triggered:

Cisco Stealthwatch, Cisco Stealthwatch Cloud, Security Analytics, Cisco Certifications

11. And the resulting Alert:

Cisco Stealthwatch, Cisco Stealthwatch Cloud, Security Analytics, Cisco Certifications

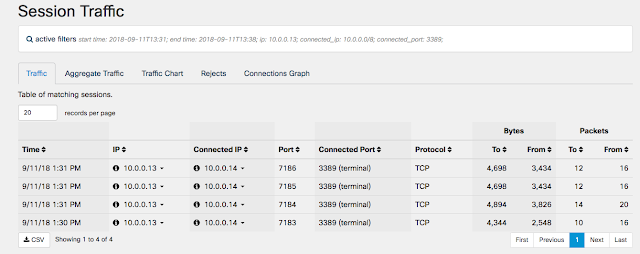
12. You can also see the observed ALLOWED traffic from my lateral RDP testing. This traffic did not trigger any observation or alert:

Cisco Stealthwatch, Cisco Stealthwatch Cloud, Security Analytics, Cisco Certifications

This policy violation alerting framework allows you to be fully accountable for all network prohibited network traffic that will inevitably transit your network laterally or through an egress point.  Firewall rules, hardening standards and compliance policies should be adhered to but how can you be certain that they are?  Human error, lack of expertise and troubleshooting can and will easily lead to a gap in your posture and Stealthwatch Cloud is the second line of defense to catch any violation the moment that first packet traverses a segment using a prohibited protocol.  It’s not a matter of IF your posture will be compromised but WHEN.

Saturday, 8 September 2018

Deploying Stealthwatch Cloud in a Google GKE Kubernetes Cluster

Cisco Stealthwatch Cloud has the unique ability to provide an unprecedented level of visibility and security analytic capabilities within a Kubernetes cluster. It really doesn’t matter where the cluster resides, whether on-premise or in any public cloud environment. Stealthwatch Cloud deploys as a daemonset via a yaml file on the cluster master node, ensuring that it will deploy on every worker node in the cluster and both expand and contract as the cluster’s elasticity fluctuates. It’s very simple to configure this and once it’s configured, the sensor will deploy with each node and ensure full visibility into all node, pod and container traffic. This is done via deploying with a host-level networking shim that ensures full traffic visibility into every packet that involves any container, pod or node.

How’s this done? In this guide I’m going to walk you through how to deploy Stealthwatch Cloud within the Google Cloud Kubernetes Engine or GKE.  I’m choosing this because its incredibly simple to deploy a K8s cluster for labbing purposes in a few minutes in GKE, which will allow us to focus our attention on the nuts and bolts of deploying Stealthwatch Cloud step by step into an existing K8s cluster.

The first step is to login to the GKE utility within your Google Cloud Platform console:

Security, Kubernetes, Security Analytics, Cisco Stealthwatch, Cisco Stealthwatch Cloud

Create your cluster:

Security, Kubernetes, Security Analytics, Cisco Stealthwatch, Cisco Stealthwatch Cloud

Security, Kubernetes, Security Analytics, Cisco Stealthwatch, Cisco Stealthwatch Cloud

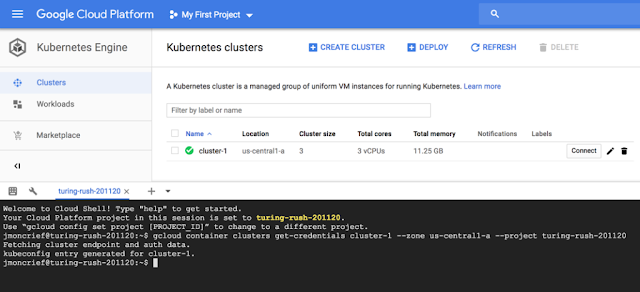
Click Connect to get your option to connect using the built-in console utility. Click the option for “Run in Cloud Shell”:

Security, Kubernetes, Security Analytics, Cisco Stealthwatch, Cisco Stealthwatch Cloud

Click Start Cloud Shell:

Security, Kubernetes, Security Analytics, Cisco Stealthwatch, Cisco Stealthwatch Cloud

You will now be brought into the GKE Cloud Shell where you can now fully interact with your GKE Kubernetes cluster:

Security, Kubernetes, Security Analytics, Cisco Stealthwatch, Cisco Stealthwatch Cloud

You can check  the status of the nodes in your 3-node cluster by issuing the following command:
kubectl get nodes

Security, Kubernetes, Security Analytics, Cisco Stealthwatch, Cisco Stealthwatch Cloud

You can also verify that there are currently no deployed pods in the cluster:

kubectl get pods

Security, Kubernetes, Security Analytics, Cisco Stealthwatch, Cisco Stealthwatch Cloud

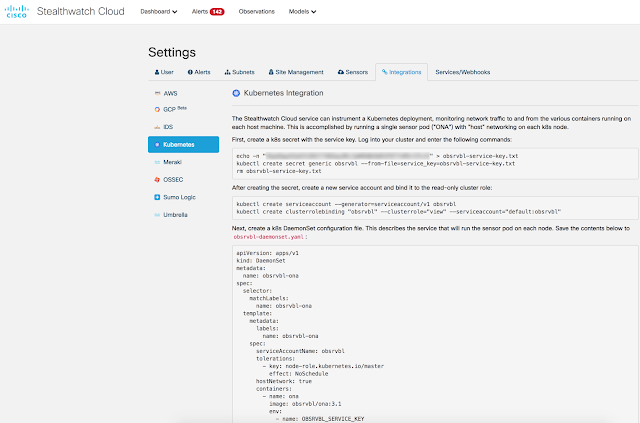
At this point you’ll want to reference the instructions provided in your Stealthwatch Cloud portal on how to integrate Stealthwatch Cloud with your new cluster. In the Integrations page you find the Kubernetes integration page:

Security, Kubernetes, Security Analytics, Cisco Stealthwatch, Cisco Stealthwatch Cloud

First we’ll create a Kubernetes “Secret” with a Service Key as instructed in the setup steps:

Security, Kubernetes, Security Analytics, Cisco Stealthwatch, Cisco Stealthwatch Cloud

Now we’ll create a service account and bind it to the read-only cluster role:

Security, Kubernetes, Security Analytics, Cisco Stealthwatch, Cisco Stealthwatch Cloud

Next, create a k8s DaemonSet configuration file.  This describes the service that will run the sensor pod on each node. Save the contents below to obsrvbl-daemonset.yaml:

Security, Kubernetes, Security Analytics, Cisco Stealthwatch, Cisco Stealthwatch Cloud

Security, Kubernetes, Security Analytics, Cisco Stealthwatch, Cisco Stealthwatch Cloud

Save the file and then create the sensor pod via:

Security, Kubernetes, Security Analytics, Cisco Stealthwatch, Cisco Stealthwatch Cloud

You can see that now we have a Stealthwatch Cloud sensor pod deployed on each of the 3 nodes. That daemonset.yaml will ensure that the pod is deployed on any new worker node replicas as the cluster expands, automatically. We can now switch over to the Stealthwatch Cloud portal to see if the new sensors are available and reporting flow telemetry into the Stealthwatch Cloud engine. Within a few minutes the sensor pods from GKE should start reporting in and when they do you’ll see them populate the sensors page as unique sensors in your Sensor List:

Security, Kubernetes, Security Analytics, Cisco Stealthwatch, Cisco Stealthwatch Cloud

At this point Stealthwatch Cloud is now providing full visibility into all pods on all nodes including the K8s Master node and the full capabilities of Stealthwatch Cloud including Entity Modeling and behavioral anomaly detection will be protecting the GKE cluster.

We can now deploy an application in our cluster to monitor and protect. For simplicity’s sake we’ll deploy a quick NGINX app into a pod in our cluster using the following command:

sudo kubectl create deployment nginx --image=nginx

You can verify the status of the application along with the Stealtwatch Cloud sensors with the following kubectl command:

kubectl get pods -o wide

Security, Kubernetes, Security Analytics, Cisco Stealthwatch, Cisco Stealthwatch Cloud

You’ll see in the above that I actually have 2 NGINX instances running and it’s simply because I edited the YAML file for the NGINX app to ensure that 2 replicas were running upon deployment. This can easily be adjusted to set your needs as you scale your K8s cluster.

After a few minutes you can now query your Stealthwatch Cloud portal for anything with “NGINX” and you should see the following type of results:

Security, Kubernetes, Security Analytics, Cisco Stealthwatch, Cisco Stealthwatch Cloud

You’ll see both existing and non-existing NGINX pods in the search results above. This is because as the cluster expands and contracts and the pods deploy, each pod gets a unique IP Address to communicate on. The non-existent pods in the Stealthwatch Cloud search results represent previously existent pods in our cluster that were torn down to do reducing and increasing replica pods over time.

At this point you have full visibility into all of the traffic across the NGINX pods and full baselining and anomaly detection capabilities as well should any of them become compromised or begin behaving suspiciously.

Friday, 15 June 2018

Cisco Stealthwatch and DNA Center bridge the SecOps – NetOps divide

By sheer necessity, there is an increasingly interdependent role between NetOps and SecOps in many enterprises. Cisco has been monitoring three trends:

1. Networks are connecting ever more devices, locations and users. The complexity of managing them is creating openings for new threats.

2. As advanced threats multiply, organizations need to control the cost of containment by automating and extending visibility across different functions.

3. And as threats become more advanced, they are becoming an inhibitor to network assurance. For example, instead of breaking in, attackers simply hide in encrypted traffic to gain access to the network.

In short, SecOps needs immediate access to security telemetry to get visibility from all the new endpoints being added to the network, and NetOps needs to know about threats that could impact uptime, particularly encrypted threats.

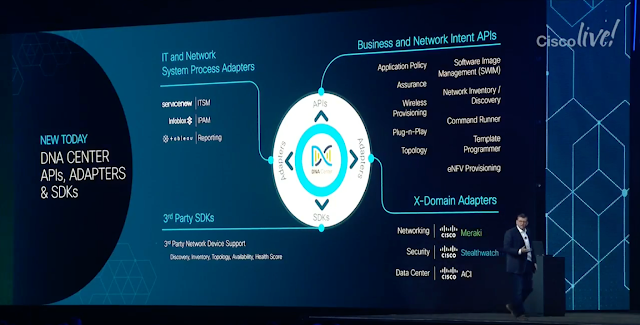
These are some of the challenges that led to the integration of Cisco DNA Center and Cisco Stealthwatch.

Better IT workflow for faster threat resolution


Cisco Stealthwatch extends threat detection and containment to the DNA Center, the one-stop NetOps management for distributed enterprises.  DNA Center now automates enabling threat telemetry, including enhanced telemetry from encrypted traffic (Encrypted Traffic Analytics or ETA), to be sent to Stealthwatch. The critical threats from Stealthwatch, in turn, can now be monitored from the DNA Center, which provides a platform for custom resolution services such as opening a ticket for automated threat containment.

Cisco DNA, Cisco Guides, Cisco Study Materials, Cisco Certifications

In the past, these workflows have never been integrated seamlessly. But now we have the ability to streamline them with the new, open DNA Center Platform. Highlighting the power of the DNA Center open platform approach, combined with the expertise of Cisco Advanced Services engineers – the application development and integration required for this workflow was completed in just 3 weeks

Step 0

Automatically find and turn-on threat telemetry from your network devices, including Encrypted Traffic Analytics. Today, customers can take weeks to months to identify and turn on necessary telemetry for security visibility.  We can do it in minutes.

Step 1

Stealthwatch applies advanced security analytics in the form of behavioral modeling, machine learning and global threat intelligence to pinpoint critical threats with high confidence, including where they are originating from. This info now appears in the 360 dashboard for every client on the network.

Step 2

DNA Center instantly communicates with the ITSM (IT Service Management) to generate a ticket related to this incident. And also communicates the incident to customer-specific Security Operations app (developed by Cisco Advanced Services) used by SecOps team to contain the threat.

Step 3

SecOps informs DNA Center to quarantine the user using the Security Operations App, and DNA Center isolates the user.

Step 4

DNA Center confirms containment and informs  SecOps that the user has been quarantined.

Step 5

SecOps uses the Security Operations app to update the ticket in the ITSM.

This workflow can be simpler or more complex depending on the type of threat, but the key is that it is seamless and intuitive between NetOps and SecOps.

Security is everyone’s problem now and containing threats quickly while maintaining network performance requires cooperation, automation, and visibility across IT, Network and Security Operations.

Cisco DNA, Cisco Guides, Cisco Study Materials, Cisco Certifications

If you are attending Cisco Live Orlando this week, come and see the solution in action at the DNA Center Platform demo stand in the World of Solutions!

Saturday, 23 December 2017

Introducing executive dashboards in CTA

No security risk assessment is complete without the executive summary section. Something that can answer the high level questions security teams get asked including “how secure are we?”, “what threats are affecting our network today?” and “how healthy is our network?” We have recently revamped the Cognitive Threat Analytics dashboard to provide answers to these questions and more.