Showing posts with label Developer. Show all posts

Saturday, 8 June 2024

Cisco AI Assistant for Managing Firewall Policies Is Now Available

Cisco AI Assistant is now available for Cisco XDR and Cisco Defense Orchestrator


Managing firewall policies and locating relevant documentation can be daunting for firewall administrators. However, the AI Assistant integrated with the Cisco Defense Orchestrator (CDO) and the cloud-delivered Firewall Management Center simplifies these processes. With this powerful combination, administrators can effortlessly manage firewall devices, configure policies, and access reference materials whenever required, streamlining their workflow and boosting overall efficiency.

Prerequisites


Administrators need to ensure they have met the following prerequisites to use the AI Assistant:

User roles:

● CDO and cloud-delivered Firewall Management Center – Super Admin or Admin
● On-Prem FMC – Global Domain Admin

Upon successful login into your tenant, you will notice an AI Assistant button positioned in the top menu bar of the dashboard.

Cisco AI Assistant for Managing Firewall Policies Is Now Available

Click the AI Assistant button on the CDO or cloud-delivered Firewall Management Center home page to access the AI Assistant.

The Cisco AI Assistant interface contains the following components: Text Input Box, New Chat, Chat History, Expand View, and Feedback.

Cisco AI Assistant for Managing Firewall Policies Is Now Available

Cisco AI Assistant interface following the best Generative AI assistant practices.

AI Assistant interaction


AI Assistant completion with the prompt “Can you provide me with the distinct IP addresses that are currently blocked by our firewall policies?”

Cisco AI Assistant for Managing Firewall Policies Is Now Available

AI Assistant completion with the prompt “What access control rules are disabled?”

Cisco AI Assistant for Managing Firewall Policies Is Now Available

If you think that response is wrong, please click the thumbs-down button below for the related completion and fill out and submit the form.

Cisco AI Assistant for Managing Firewall Policies Is Now Available

AI Assistant can’t proceed with some prompts and questions. In this case, you can see the following completion:

Cisco AI Assistant for Managing Firewall Policies Is Now Available

It looks like the engineering team decided not to display answers if there is insufficient data to correct them or in cases where the model can hallucinate.

Source: cisco.com

Thursday, 23 May 2024

The Crux of Android 14 Application Migration and Its Impact

The Crux of Android 14 Application Migration and Its Impact

First I would like to give an overview of the Meraki Systems Manager (SM) application. Systems Manager is Meraki’s endpoint management product. We support management for many different platforms, including iOS, Android, macOS, and Windows. “Managing” a device can mean monitoring its online status, pushing profiles and apps to it, and/or enforcing security policies, among other things. With Systems Manager, this management all happens through Meraki’s online interface called Dashboard. Examples and code snippets mentioned in this blog are more specific to the Android SM application.

Migration of applications to any SDK mainly includes 2 tasks from the developer’s perspective. One is – how the application behaves when installed on a device with an Android version other than the target SDK of the app. And secondly, how the app will behave when the target SDK is changed. Developers need to understand what new features, or updates of any existing feature, and its impact on the application are.

This document focuses on some of the changes impacting developers with Android 14 migration. It also covers migration of the Systems Manager app to Android 14, and challenges encountered during the migration and testing.

The Crux of Android 14 Application Migration and Its Impact

Font Scaling


In earlier versions of Android i.e., 13 Non-linear font scaling was supported up to 130% but in Android 14, it is supported up to 200% which can impact the UI of the application. In the application if font dimensions are declared using sp (scaled pixel) units there are chances of minimal impact on the application because Android framework would apply these scaling factors. Because of nonlinear scaling of font density scaling will not be accurate.
Key points

◉ TypedValue.applyDimension() to convert from sp units to pixels.
◉ TypedValue.deriveDimension() to convert pixels to sp
◉ LineHeight units should be specified in sp to manage proportion along with text size.

Background Process Limitation


Android OS is self sufficient to manage the resources efficiently by improvising performance as well. One of the pointers to achieve the same is by caching applications in the background and only when the system needs memory these applications will be removed from memory. All applications should comply with Google Play policy and hence killing of processes of other applications are strictly restricted in Android 14. Hence killBackgroundProcessess() can kill only the background processes of your own application.

Foreground Service Types


In Android 10, a new attribute was introduced to specify service type for foreground services. When using location information in the foreground service it was required to specify the type as “location”. Whereas in Android 11, mentioning service type for usage of camera or microphone in foreground service was mandated. But in Android 14 or above, all foreground services must be declared with their service types.

Some of the new service types were also introduced in Android 14 – health, remoteMessaging, shortService, specialUse and systemExempted. If service isn’t associated with any of the types specified, then it is recommended to change logic to use Workmanager or user-initiated data transfer jobs. MissingForegroundServiceTypeException will be thrown by the system in case service type is not specified.

Service type permissions need to be declared along with specifying the type in service.

      <uses-permission 
android:name="android.permission.FOREGROUND_SERVICE_SYSTEM_EXEMPTED" />

      <service
            android:name=".kiosk.v2.service.KioskBreakoutService"
            android:name=".kiosk.v2.service.KioskBreakoutService"
            android:foregroundServiceType="systemExempted"
            android:exported="false" />

Limitations on Implicit Intent and Pending Intent


Implicit intents are only delivered to exported components. This restriction ensures the application’s implicit intents aren’t used by any other malicious apps. Also, all mutable pending intent must specify a component or package information to the intent, if not the system throws an exception.

Implicit intent should be export similar to this:

<activity
   android:name=".AppActivity"
   android:exported="true"> <!-- This must be TRUE otherwise this will throw 
exception when starting the activity-->
   <intent-filter>
      <action android:name="com.example.action.APP_ACTION" />
      <category android:name="android.intent.category.DEFAULT" />
   </intent-filter>
</activity>

If pending intent should be mutable, then component info must be specified.

val flags = if (MerakiUtils.isApi31OrHigher()) {
   PendingIntent.FLAG_MUTABLE
} else {
   PendingIntent.FLAG_UPDATE_CURRENT
}

val pendingIntent = PendingIntent.getActivity(
   this,
   0,
   Intent(context, KioskActivity::class.java).apply {
      putExtra(ACTION, KioskActivity.BREAK_OUT_SINGLE_APP)
   },
   flags
)

Export behavior to be specified for Runtime-registered broadcasts


Prior to Android 13, there were no restrictions on sending broadcasts to a dynamically registered receiver when it is guarded by signature permission. Whereas in Android 13, aiming at making runtime receivers safe, an optional flag was introduced to specify whether the receiver is exported and visible to other applications. To protect apps from security vulnerabilities, in Android 14 or above context-registered receivers are required to specify a flag RECEIVER_EXPORTED or RECEIVER_NOT_EXPORTED to indicate whether receiver should be exported or not to all other apps on the device. This is exempted for system broadcasts.

ContextCompat.registerReceiver(
   requireContext(), receiver,intentFilter(),
   ContextCompat.RECEIVER_NOT_EXPORTED

Non-Dismissable foreground notifications


In Android 14 or higher, foreground notification can be dismissed by the user. But exceptions have been provided for Device policy Controller (DPC) and supporting packages for enterprise.

JobScheduler reinforces callback and network behavior


Prior to Android 14, for any job running for too long, it would stop and fail silently. When App targets Android 14 and if the job exceeds the guaranteed time on the main thread, the app triggers an ANR with an error message “No response to onStartJob” or “No response to onStopJob”. It is suggested to use WorkManager for any asynchronous processing.

Changes specific to Android Enterprise


Android Enterprise is a Google-led initiative to enable the use of Android devices and apps in the workplace. It is also termed as Android for Work. It helps to manage and distribute private apps alongside public apps, providing a unified enterprise app store experience for end users.

GET_PROVISIONING_MODE intent behavior


For signing in with a Google account, GET_PROVISIONING_MODE was introduced in Android 12 or higher. In Android 14 or higher, DPC apps receive this intent which can carry the information to support either Fully managed mode or work profile mode.

wipeDevice – for resetting device


Scope of wipeData is now restricted to profile owners only. For apps targeting Android 14 or higher, this method would throw system error when called in device owner mode. New method wipeDevice to be used for resetting the device along with USES_POLICY_WIPE_DATA permission.

Newly added fields and methods


ContactsContract.Contacts#ENTERPRISE_CONTENT_URI
ContactsContract.CommonDataKinds.Phone#ENTERPRISE_CONTENT_URI

When cross-profile contacts policy is allowed in DevicePolicyManager, these fields can be used for listing all work profile contacts and phone numbers from personal apps along with READ_CONTACTS permission.

To support setting contact access policy and callerID, below methods are newly added;

setManagedProfileContactsAccessPolicy
getManagedProfileContactsAccessPolicy
setManagedProfileCallerIdAccessPolicy
getManagedProfileCallerIdAccessPolicy

Deprecated methods


Below methods are deprecated and as an alternative methods specified in the previous section should be used.

DevicePolicyManger#setCrossProfileContactsSearchDisabled
DevicePolicyManger#getCrossProfileContactsSearchDisabled
DevicePolicyManger#setCrossProfileCallerIdDisabled
DevicePolicyManger#getCrossProfileCallerIdDisabled

Challenges during Meraki Systems Manager App Migration


  • To ensure there was no UI breakage, we had to recheck all the code base of xml files related to all fragments, alert dialog and text size dimensions.
  • Few APIs like wipeDevice(), were not mentioned in the Android migration 14. During the testing phase it was found that wipeData() is deprecated in Android 14 and wipeDevice() was supposed to be used for factory resetting the device successfully.
  • Profile information which can be fetched along with intent GET_PROVISIONING_MODE was also missed in the migration guide. This was found during the regression testing phase.
  • requestSingleUpdate() of location manager always requires mutable pending for location updation. But nowhere in the documentation, it is prescribed about it. Due to this there were few application crashes. Had to figure this out during application testing.

Source: cisco.com

Tuesday, 12 March 2024

Dashify: Solving Data Wrangling for Dashboards

This post is about Dashify, the Cisco Observability Platform’s dashboarding framework. We are going to describe how AppDynamics, and partners, use Dashify to build custom product screens, and then we are going to dive into details of the framework itself. We will describe its specific features that make it the most powerful and flexible dashboard framework in the industry.

What are dashboards?


Dashboards are data-driven user interfaces that are designed to be viewed, edited, and even created by product users. Product screens themselves are also built with dashboards. For this reason, a complete dashboard framework provides leverage for both the end users looking to share dashboards with their teams, and the product-engineers of COP solutions like Cisco Cloud Observability.

In the observability space most dashboards are focused on charts and tables for rendering time series data, for example “average response time” or “errors per minute”. The image below shows the COP EBS Volumes Overview Dashboard, which is used to understand the performance of Elastic Block Storage (EBS) on Amazon Web Services. The dashboard features interactive controls (dropdowns) that are used to further-refine the scenario from all EBS volumes to, for example unhealthy EBS volumes in US-WEST-1.

Dashify: Solving Data Wrangling for Dashboards

Several other dashboards are provided by our Cisco Cloud Observability app for monitoring other AWS systems. Here are just a few examples of the rapidly expanding use of Dashify dashboards across the Cisco Observability Platform.

  • EFS Volumes
  • Elastic Load Balancers
  • S3 Buckets
  • EC2 Instances

Why Dashboards


No observability product can “pre-imagine” every way that customers want to observe their systems. Dashboards allow end-users to create custom experiences, building on existing in-product dashboards, or creating them from scratch. I have seen large organizations with more than 10,000 dashboards across dozens of teams.

Dashboards are a cornerstone of observability, forming a bridge between a remote data source, and local display of data in the user’s browser. Dashboards are used to capture “scenarios” or “lenses” on a particular problem. They can serve a relatively fixed use case, or they can be ad-hoc creations for a troubleshooting “war room.” A dashboard performs many steps and queries to derive the data needed to address the observability scenario, and to render the data into visualizations. Dashboards can be authored once, and used by many different users, leveraging the know-how of the author to enlighten the audience. Dashboards play a critical role in low-level troubleshooting and in rolling up high-level business KPIs to executives.

Dashify: Solving Data Wrangling for Dashboards

The goal of dashboard frameworks has always been to provide a way for users, as opposed to ‘developers’, to build useful visualizations. Inherent to this “democratization” of visualizations is the notion that building a dashboard must somehow be easier than a pure JavaScript app development approach. Afterall, dashboards cater to users, not hardcore developers.

The problem with dashboard frameworks


The diagram below illustrates how a traditional dashboard framework allows the author to configure and arrange components but does not allow the author to create new components or data sources. The dashboard author is stuck with whatever components, layouts, and data sources are made available. This is because the areas shown in red are developed in JavaScript and are provided by the framework. JavaScript is neither a secure, nor easy technology to learn, therefore it is rarely exposed directly to authors. Instead, dashboards expose a JSON or YAML based DSL. This typically leaves field teams, SEs, and power users in the position of waiting for the engineering team to release new components, and there is almost always a deep feature backlog.

Dashify: Solving Data Wrangling for Dashboards

I have personally seen this scenario play out many times. To take a real example, a team building dashboards for IT services wanted rows in a table to be colored according to a “heat map”. This required a feature request to be logged with engineering, and the core JavaScript-based Table component had to be changed to support heat maps. It became typical for the core JS components to become a mishmash of domain-driven spaghetti code. Eventually the code for Table itself was hard to find amidst the dozens of props and hidden behaviors like “heat maps”. Nobody was happy with the situation, but it was typical, and core component teams mostly spent their sprint cycles building domain behaviors and trying to understand the spaghetti. What if dashboard authors themselves on the power-user end of the spectrum could be empowered to create components themselves?

Enter Dashify


Dashify’s mission is to remove the barrier of “you can’t do that” and “we don’t have a component for that”. To accomplish this, Dashify rethinks some of the foundations of traditional dashboard frameworks. The diagram below shows that Dashify shifts the boundaries around what is “built in” and what is made completely accessible to the Author. This radical shift allows the core framework team to focus on “pure” visualizations, and empowers domain teams, who author dashboards, to build domain specific behaviors like “IT heat maps” without being blocked by the framework team.

Dashify: Solving Data Wrangling for Dashboards

To accomplish this breakthrough, Dashify had to solve the key challenge of how to simplify and expose reactive behavior and composition without cracking open the proverbial can of JavaScript worms. To do this, Dashify leveraged a new JSON/YAML meta-language, created at Cisco in the open source, for the purpose of declarative, reactive state management. This new meta-language is called “Stated,” and it is being used to drive dashboards, as well as many other JSON/YAML configurations within the Cisco Observability Platform. Let’s take a simple example to show how Stated enables a dashboard author to insert logic directly into a dashboard JSON/YAML.

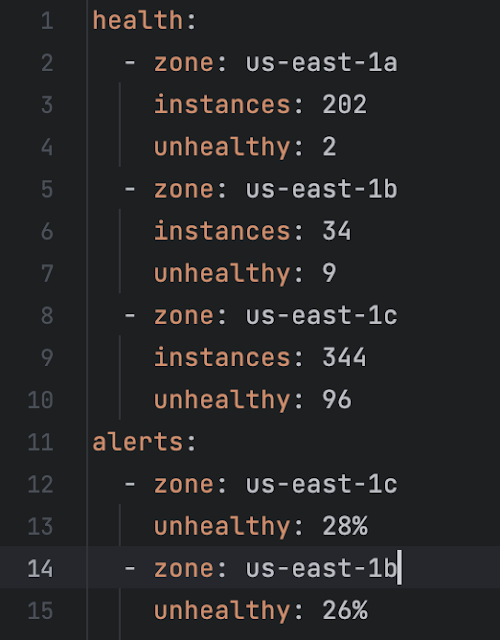
Suppose we receive data from a data source that provides “health” about AWS availability zones. Assume the health data is updated asynchronously. Now suppose we wish to bind the changing health data to a table of “alerts” according to some business rules:

1. only show alerts if the percentage of unhealthy instances is greater than 10%
2. show alerts in descending order based on percentage of unhealthy instances
3. update the alerts every time the health data is updated (in other words declare a reactive dependency between alerts and health).

This snippet illustrates a desired state, that adheres to the rules.

Dashify: Solving Data Wrangling for Dashboards

But how can we build a dashboard that continuously adheres to the three rules? If the health data changes, how can we be sure the alerts will be updated? These questions get to the heart of what it means for a system to be Reactive. This Reactive scenario is at best difficult to accomplish in today’s popular dashboard frameworks.

Notice we have framed this problem in terms of the data and relationships between different data items (health and alerts), without mentioning the user interface yet. In the diagram above, note the “data manipulation” layer. This layer allows us to create exactly these kinds of reactive (change driven) relationships between data, decoupling the data from the visual components.

Let’s look at how easy it is in Dashify to create a reactive data rule that captures our three requirements. Dashify allows us to replace *any* piece of a dashboard with a reactive rule, so we simply write a reactive rule that generates the alerts from the health. The Stated rule, beginning on line 12 is a JSONata expression. Feel free to try it yourself here.

Dashify: Solving Data Wrangling for Dashboards

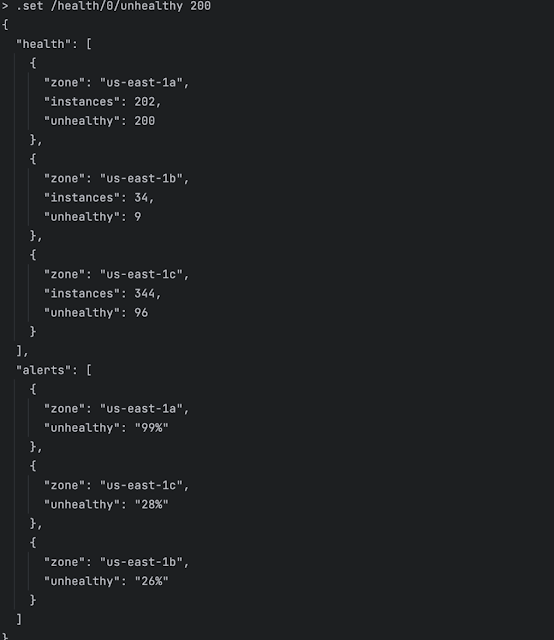
One of the most interesting things is that it appears you don’t have to “tell” Dashify what data your rule depends on. You just write your rule. This simplicity is enabled by Stated’s compiler, which analyzes all the rules in the template and produces a Reactive change graph. If you change anything that the ‘alerts’ rule is looking at, the ‘alerts’ rule will fire, and recompute the alerts. Let’s quickly prove this out using the stated REPL which lets us run and interact with Stated templates like Dashify dashboards. Let’s see what happens if we use Stated to change the first zone’s unhealthy count to 200. The screenshot below shows execution of the command “.set /health/0/unhealthy 200” in the Stated JSON/YAML REPL. Dissecting this command, it says “set the value at json pointer /health/0/unhealthy to value 200”. We see that the alerts are immediately recomputed, and that us-east-1a is now present in the alerts with 99% unhealthy.

Dashify: Solving Data Wrangling for Dashboards

By recasting much of dashboarding as a reactive data problem, and by providing a robust in-dashboard expression language, Dashify allows authors to do both traditional dashboard creation, advanced data bindings, and reusable component creation. Although quite trivial, this example clearly shows how Dashify differentiates its core technology from other frameworks that lack reactive, declarative, data bindings. In fact, Dashify is the first, and only framework to feature declarative, reactive, data bindings.

Let’s take another example, this time fetching data from a remote API. Let’s say we want to fetch data from the Star Wars REST api. Business requirements:

  • Developer can set how many pages of planets to return
  • Planet details are fetched from star wars api (https://swapi.dev)
  • List of planet names is extracted from returned planet details
  • User should be able to select a planet from the list of planets
  •  ‘residents’ URLs are extracted from planet info (that we got in step 2), and resident details are fetched for each URL
  • Full names of inhabitants are extracted from resident details and presented as list

Again, we see that before we even consider the user interface, we can cast this problem as a data fetching and reactive binding problem. The dashboard snippet below shows how a value like “residents” is reactively bound to selectedPlanet and how map/reduce style set operators are applied to entire results of a REST query. Again, all the expressions are written in the grammar of JSONata.

Dashify: Solving Data Wrangling for Dashboards

To demonstrate how you can interact with and test such a snippet, checkout This github gist shows a REPL session where we:

1. load the JSON file and observe the default output for Tatooine
2. Display the reactive change-plan for planetName
3. Set the planet name to “Coruscant”
4. Call the onSelect() function with “Naboo” (this demonstrates that we can create functions accessible from JavaScript, for use as click handlers, but produces the same result as directly setting planetName)

From this concise example, we can see that dashboard authors can easily handle fetching data from remote APIs, and perform extractions and transformations, as well as establish click handlers. All these artifacts can be tested from the Stated REPL before we load them into a dashboard. This remarkable economy of code and ease of development cannot be achieved with any other dashboard framework.

If you are curious, these are the inhabitants of Naboo:

Dashify: Solving Data Wrangling for Dashboards

What’s next?


We have shown a lot of “data code” in this post. This is not meant to imply that building Dashify dashboards requires “coding”. Rather, it is to show that the foundational layer, which supports our Dashboard building GUIs is built on very solid foundation. Dashify recently made its debut in the CCO product with the introduction of AWS monitoring dashboards, and Data Security Posture Management screens. Dashify dashboards are now a core component of the Cisco Observability Platform and have been proven out over many complex use cases. In calendar Q2 2024, COP will introduce the dashboard editing experience which provides authors with built in visual drag-n-drop style editing of dashboards. Also in calendar Q2, COP introduces the ability to bundle dashify dashboards into COP solutions allowing third party developers to unleash their dashboarding skills. So, weather you skew to the “give me a gui” end of the spectrum or the “let me code” lifestyle, Dashify is designed to meet your needs.

Summing it up


Dashboards are a key, perhaps THE key technology in an observability platform. Existing dashboarding frameworks present unwelcome limits on what authors can do. Dashify is a new dashboarding framework born from many collective years of experience building both dashboard frameworks and their visual components. Dashify brings declarative, reactive state management into the hands of dashboard authors by incorporating the Stated meta-language into the JSON and YAML of dashboards. By rethinking the fundamentals of data management in the user interface, Dashify allows authors unprecedented freedom. Using Dashify, domain teams can ship complex components and behaviors without getting bogged down in the underlying JavaScript frameworks. Stay tuned for more posts where we dig into the exciting capabilities of Dashify: Custom Dashboard Editor, Widget Playground, and Scalable Vector Graphics.

Source: cisco.com

Thursday, 7 March 2024

Using the Power of Artificial Intelligence to Augment Network Automation

Talking to your Network


Embarking on my journey as a network engineer nearly two decades ago, I was among the early adopters who recognized the transformative potential of network automation. In 2015, after attending Cisco Live in San Diego, I gained a new appreciation of the realm of the possible. Leveraging tools like Ansible and Cisco pyATS, I began to streamline processes and enhance efficiencies within network operations, setting a foundation for what would become a career-long pursuit of innovation. This initial foray into automation was not just about simplifying repetitive tasks; it was about envisioning a future where networks could be more resilient, adaptable, and intelligent. As I navigated through the complexities of network systems, these technologies became indispensable allies, helping me to not only manage but also to anticipate the needs of increasingly sophisticated networks.

Using the Power of Artificial Intelligence to Augment Network Automation

In recent years, my exploration has taken a pivotal turn with the advent of generative AI, marking a new chapter in the story of network automation. The integration of artificial intelligence into network operations has opened up unprecedented possibilities, allowing for even greater levels of efficiency, predictive analysis, and decision-making capabilities. This blog, accompanying the CiscoU Tutorial, delves into the cutting-edge intersection of AI and network automation, highlighting my experiences with Docker, LangChain, Streamlit, and, of course, Cisco pyATS. It’s a reflection on how the landscape of network engineering is being reshaped by AI, transforming not just how we manage networks, but how we envision their growth and potential in the digital age. Through this narrative, I aim to share insights and practical knowledge on harnessing the power of AI to augment the capabilities of network automation, offering a glimpse into the future of network operations.

In the spirit of modern software deployment practices, the solution I architected is encapsulated within Docker, a platform that packages an application and all its dependencies in a virtual container that can run on any Linux server. This encapsulation ensures that it works seamlessly in different computing environments. The heart of this dockerized solution lies within three key files: the Dockerfile, the startup script, and the docker-compose.yml.

The Dockerfile serves as the blueprint for building the application’s Docker image. It starts with a base image, ubuntu:latest, ensuring that all the operations have a solid foundation. From there, it outlines a series of commands that prepare the environment:

FROM ubuntu:latest

# Set the noninteractive frontend (useful for automated builds)
ARG DEBIAN_FRONTEND=noninteractive

# A series of RUN commands to install necessary packages
RUN apt-get update && apt-get install -y wget sudo ...

# Python, pip, and essential tools are installed
RUN apt-get install python3 -y && apt-get install python3-pip -y ...

# Specific Python packages are installed, including pyATS[full]
RUN pip install pyats[full]

# Other utilities like dos2unix for script compatibility adjustments
RUN sudo apt-get install dos2unix -y

# Installation of LangChain and related packages
RUN pip install -U langchain-openai langchain-community ...

# Install Streamlit, the web framework
RUN pip install streamlit

Each command is preceded by an echo statement that prints out the action being taken, which is incredibly helpful for debugging and understanding the build process as it happens.

The startup.sh script is a simple yet crucial component that dictates what happens when the Docker container starts:

cd streamlit_langchain_pyats
streamlit run chat_with_routing_table.py

It navigates into the directory containing the Streamlit app and starts the app using streamlit run. This is the command that actually gets our app up and running within the container.

Lastly, the docker-compose.yml file orchestrates the deployment of our Dockerized application. It defines the services, volumes, and networks to run our containerized application:

version: '3'
services:
 streamlit_langchain_pyats:
  image: [Docker Hub image]
  container_name: streamlit_langchain_pyats
  restart: always
  build:
   context: ./
   dockerfile: ./Dockerfile
  ports:
   - "8501:8501"

This docker-compose.yml file makes it incredibly easy to manage the application lifecycle, from starting and stopping to rebuilding the application. It binds the host’s port 8501 to the container’s port 8501, which is the default port for Streamlit applications.

Together, these files create a robust framework that ensures the Streamlit application — enhanced with the AI capabilities of LangChain and the powerful testing features of Cisco pyATS — is containerized, making deployment and scaling consistent and efficient.

The journey into the realm of automated testing begins with the creation of the testbed.yaml file. This YAML file is not just a configuration file; it’s the cornerstone of our automated testing strategy. It contains all the essential information about the devices in our network: hostnames, IP addresses, device types, and credentials. But why is it so crucial? The testbed.yaml file serves as the single source of truth for the pyATS framework to understand the network it will be interacting with. It’s the map that guides the automation tools to the right devices, ensuring that our scripts don’t get lost in the vast sea of the network topology.

Sample testbed.yaml


---
devices:
  cat8000v:
    alias: "Sandbox Router"
    type: "router"
    os: "iosxe"
    platform: Cat8000v
    credentials:
      default:
        username: developer
        password: C1sco12345
    connections:
      cli:
        protocol: ssh
        ip: 10.10.20.48
        port: 22
        arguments:
        connection_timeout: 360

With our testbed defined, we then turn our attention to the _job file. This is the conductor of our automation orchestra, the control file that orchestrates the entire testing process. It loads the testbed and the Python test script into the pyATS framework, setting the stage for the execution of our automated tests. It tells pyATS not only what devices to test but also how to test them, and in what order. This level of control is indispensable for running complex test sequences across a range of network devices.

Sample _job.py pyATS Job


import os
from genie.testbed import load

def main(runtime):

    # ----------------
    # Load the testbed
    # ----------------
    if not runtime.testbed:
        # If no testbed is provided, load the default one.
        # Load default location of Testbed
        testbedfile = os.path.join('testbed.yaml')
        testbed = load(testbedfile)
    else:
        # Use the one provided
        testbed = runtime.testbed

    # Find the location of the script in relation to the job file
    testscript = os.path.join(os.path.dirname(__file__), 'show_ip_route_langchain.py')

    # run script
    runtime.tasks.run(testscript=testscript, testbed=testbed)

Then comes the pièce de résistance, the Python test script — let’s call it capture_routing_table.py. This script embodies the intelligence of our automated testing process. It’s where we’ve distilled our network expertise into a series of commands and parsers that interact with the Cisco IOS XE devices to retrieve the routing table information. But it doesn’t stop there; this script is designed to capture the output and elegantly transform it into a JSON structure. Why JSON, you ask? Because JSON is the lingua franca for data interchange, making the output from our devices readily available for any number of downstream applications or interfaces that might need to consume it. In doing so, we’re not just automating a task; we’re future-proofing it.

Excerpt from the pyATS script


    @aetest.test
    def get_raw_config(self):
        raw_json = self.device.parse("show ip route")

        self.parsed_json = {"info": raw_json}

    @aetest.test
    def create_file(self):
        with open('Show_IP_Route.json', 'w') as f:
            f.write(json.dumps(self.parsed_json, indent=4, sort_keys=True))

By focusing solely on pyATS in this phase, we lay a strong foundation for network automation. The testbed.yaml file ensures that our script knows where to go, the _job file gives it the instructions on what to do, and the capture_routing_table.py script does the heavy lifting, turning raw data into structured knowledge. This approach streamlines our processes, making it possible to conduct comprehensive, repeatable, and reliable network testing at scale.
Using the Power of Artificial Intelligence to Augment Network Automation

Enhancing AI Conversational Models with RAG and Network JSON: A Guide


In the ever-evolving field of AI, conversational models have come a long way. From simple rule-based systems to advanced neural networks, these models can now mimic human-like conversations with a remarkable degree of fluency. However, despite the leaps in generative capabilities, AI can sometimes stumble, providing answers that are nonsensical or “hallucinated” — a term used when AI produces information that isn’t grounded in reality. One way to mitigate this is by integrating Retrieval-Augmented Generation (RAG) into the AI pipeline, especially in conjunction with structured data sources like network JSON.

What is Retrieval-Augmented Generation (RAG)?


Retrieval-Augmented Generation is a cutting-edge technique in AI language processing that combines the best of two worlds: the generative power of models like GPT (Generative Pre-trained Transformer) and the precision of retrieval-based systems. Essentially, RAG enhances a language model’s responses by first consulting a database of information. The model retrieves relevant documents or data and then uses this context to inform its generated output.

The RAG Process


The process typically involves several key steps:

  • Retrieval: When the model receives a query, it searches through a database to find relevant information.
  • Augmentation: The retrieved information is then fed into the generative model as additional context.
  • Generation: Armed with this context, the model generates a response that’s not only fluent but also factually grounded in the retrieved data.

The Role of Network JSON in RAG


Network JSON refers to structured data in the JSON (JavaScript Object Notation) format, often used in network communications. Integrating network JSON with RAG serves as a bridge between the generative model and the vast amounts of structured data available on networks. This integration can be critical for several reasons:
  • Data-Driven Responses: By pulling in network JSON data, the AI can ground its responses in real, up-to-date information, reducing the risk of “hallucinations.”
  • Enhanced Accuracy: Access to a wide array of structured data means the AI’s answers can be more accurate and informative.
  • Contextual Relevance: RAG can use network JSON to understand the context better, leading to more relevant and precise answers.

Why Use RAG with Network JSON?


Let’s explore why one might choose to use RAG in tandem with network JSON through a simplified example using Python code:

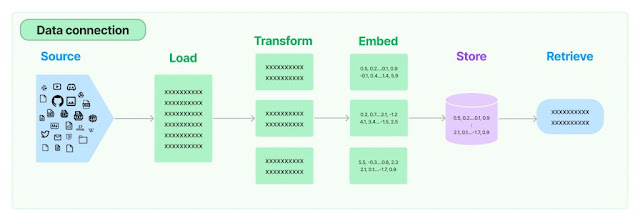
  • Source and Load: The AI model begins by sourcing data, which could be network JSON files containing information from various databases or the internet.
  • Transform: The data might undergo a transformation to make it suitable for the AI to process — for example, splitting a large document into manageable chunks.
  • Embed: Next, the system converts the transformed data into embeddings, which are numerical representations that encapsulate the semantic meaning of the text.
  • Store: These embeddings are then stored in a retrievable format.
  • Retrieve: When a new query arrives, the AI uses RAG to retrieve the most relevant embeddings to inform its response, thus ensuring that the answer is grounded in factual data.

By following these steps, the AI model can drastically improve the quality of the output, providing responses that are not only coherent but also factually correct and highly relevant to the user’s query.

class ChatWithRoutingTable:
    def __init__(self):
        self.conversation_history = []
        self.load_text()
        self.split_into_chunks()
        self.store_in_chroma()
        self.setup_conversation_memory()
        self.setup_conversation_retrieval_chain()

    def load_text(self):
        self.loader = JSONLoader(
            file_path='Show_IP_Route.json',
            jq_schema=".info[]",
            text_content=False
        )
        self.pages = self.loader.load_and_split()

    def split_into_chunks(self):
        # Create a text splitter
        self.text_splitter = RecursiveCharacterTextSplitter(
            chunk_size=1000,
            chunk_overlap=100,
            length_function=len,
        )
        self.docs = self.text_splitter.split_documents(self.pages)

    def store_in_chroma(self):
        embeddings = OpenAIEmbeddings()
        self.vectordb = Chroma.from_documents(self.docs, embedding=embeddings)
        self.vectordb.persist()

    def setup_conversation_memory(self):
        self.memory = ConversationBufferMemory(memory_key="chat_history", return_messages=True)

    def setup_conversation_retrieval_chain(self):
        self.qa = ConversationalRetrievalChain.from_llm(llm, self.vectordb.as_retriever(search_kwargs={"k": 10}), memory=self.memory)

    def chat(self, question):
        # Format the user's prompt and add it to the conversation history
        user_prompt = f"User: {question}"
        self.conversation_history.append({"text": user_prompt, "sender": "user"})

        # Format the entire conversation history for context, excluding the current prompt
        conversation_context = self.format_conversation_history(include_current=False)

        # Concatenate the current question with conversation context
        combined_input = f"Context: {conversation_context}\nQuestion: {question}"

        # Generate a response using the ConversationalRetrievalChain
response = self.qa.invoke(combined_input)

        # Extract the answer from the response
answer = response.get('answer', 'No answer found.')

        # Format the AI's response
        ai_response = f"Cisco IOS XE: {answer}"
        self.conversation_history.append({"text": ai_response, "sender": "bot"})

        # Update the Streamlit session state by appending new history with both user prompt and AI response
        st.session_state['conversation_history'] += f"\n{user_prompt}\n{ai_response}"

        # Return the formatted AI response for immediate display
        return ai_response

Conclusion

The integration of RAG with network JSON is a powerful way to supercharge conversational AI. It leads to more accurate, reliable, and contextually aware interactions that users can trust. By leveraging the vast amounts of available structured data, AI models can step beyond the limitations of pure generation and towards a more informed and intelligent conversational experience.

Source: cisco.com

Tuesday, 16 January 2024

Using the Knowledge Store on Cisco Observability Platform

Build custom observability solutions


Cisco Observability Platform (COP) enables developers to build custom observability solutions to gain valuable insights across their technology and business stack. While storage and query of Metric, Event, Log, and Trace (MELT) data is a key platform capability, the Knowledge Store (KS) enables solutions to define and manage domain-specific business data. This is a key enabler of differentiated solutions. For example, a solution may use Health Rules and FMM entity modeling to detect network intrusions. Using the Knowledge Store, the solution could bring a concept such as “Investigation” to the platform, allowing its users to create and manage the complete lifecycle of a network intrusion investigation from creation to remediation.

In this blog post we will teach the nuts and bolts of adding a knowledge model to a Cisco Observability Platform (COP) solution, using the example of a network security investigation. This blog post will make frequent use of the FSOC command to provide hands-on examples. If you are not familiar with FSOC, you can review its readme.

First, let’s quickly review the COP architecture to understand where the Knowledge Store fits in. The Knowledge Store is the distributed “brain” of the platform. The knowledge store is an advanced JSON document store that supports solution-defined Types and cross-object references. In the diagram below, the Knowledge Store is shown “connected” by arrows to other components of the platform. This is because all components of the platform store their configurations in the knowledge store. The Knowledge Store has no ‘built-in’ Types for these components. Instead, each component of the platform uses a system solution to define knowledge types defining their own configurations. In this sense, even internal components of the platform are solutions that depend on the Knowledge Store. For this reason, the Knowledge Store is the most essential component of the platform that absolutely nothing else can function without.

Using the Knowledge Store on Cisco Observability Platform

To add a more detailed understanding of the Knowledge Store we can understand it as a database that has layers. The SOLUTION layer is replicated globally across Cells. This makes the SOLUTION layer suitable for relatively small pieces of information that need to be shared globally. Any objects placed inside a solution package must be made available to subscribers in all cells, therefore they are placed in the replicated SOLUTION layer.

Using the Knowledge Store on Cisco Observability Platform
Solution Level Schema

Get a step-by-step guide


From this point we will switch to a hands-on mode and invite you to ‘git clone git@github.com:geoffhendrey/cop-examples.git’. After cloning the repo, take a look at https://github.com/geoffhendrey/cop-examples/blob/main/example/knowledge-store-investigation/README.md which offers a detailed step-by-step guide on how to define a network intrusion Type in the JSON store and how to populate it with a set of default values for an investigation. Shown below is an example of a malware investigation that can be stored in the knowledge store.

Using the Knowledge Store on Cisco Observability Platform
Malware Investigation

The critical thing to understand is that prior to the creation of the ‘investigation’ type, which is taught in the git repo above, the platform had no concept of an investigation. Therefore, knowledge modeling is a foundational capability, allowing solutions to extend the platform. As you can see from the example investigation below, a solution may bring the capability to report, investigate, remediate, and close a malware incident.

If you cloned the git repo and followed along with the README, then you already know the key points taught by the ‘investigation’ example:

  1. The knowledge store is a JSON document store
  2. A solution package can define a Type, which is akin to adding a table to a database
  3. A Type must specify a JSON schema for its allowed content
  4. A Type must also specify which document fields uniquely identify documents/objects in the store
  5. A solution may include objects, which may be of a Type defined in the solution, or which were defined by some different solution
  6. Objects included in a Solution are replicated globally across all cells in the Cisco Observability Platform.
  7. A solution including Types and Objects can be published with the fsoc command line utility

Provide value and context on top of MELT data


Cisco Observability Platform enables solution developers to bring powerful, domain specific knowledge models to the platform. Knowledge models allow solutions to provide value and context on top of MELT data. This capability is unique to COP. Look for future blogs where we will explore how to access objects at runtime, using fsoc, and the underlying REST APIs. We will also explore advanced topics such as how to generate knowledge objects based on workflows that can be triggered by platform health rules, or triggers inside the data ingestion pipeline.

Source: cisco.com

Thursday, 28 December 2023

Managing API Contracts and OpenAPI Documents at Scale

Managing API Contracts and OpenAPI Documents at Scale

Cisco DevNet presents at API Days Paris 2023


Year after year, this global event for API practitioners gets bigger. This year the event was held in the newly renovated CNIT Forest – a central and easy to join location in the Paris La Defense business area. Many of us were amazed by the number of talks and exhibitors showing their latest advances in API Design, API Management, and Event Driven Management gateways and the many discussions around OpenAPI, JSON-Schema, and GraphQL.

As a sponsor of API Days Paris, Cisco DevNet – Cisco’s developer program – offered a booth where we engage 100+ conversations with attendees and discussed how to build and publish robust APIs, sharing our experience driving API Quality and Security initiatives. (We also had the opportunity to meet and, for some of us, play chess with Laurent Fressinet, the two-time French Chess Champion, and ‘second assistant’ with opening preparation during Magnus CarlsenWorld Chess Championship matches. But that’s a different story.)

The importance of API Contracts


DevNet offered 2 talks explaining the importance of API Contracts, how we are evaluating and scoring our APIs internally, and also the challenges that come with the lifecycle and management of OpenAPI documents (see resources below for recordings and slides).

Managing API Contracts and OpenAPI Documents at Scale

We were able to show why and how a successful API-first strategy not only encourages consistent practices when designing, versioning, and documenting APIs, but also lets you look into testing and observing live traffic to ensure APIs behave as per their contract.

Managing API Contracts and OpenAPI Documents at Scale

Schedule a live Panoptica demo


In this regard, we offered demonstrations of the latest version of Panoptica – Cisco Cloud Application Security solution – with a particular focus on API Security. If you are interested in this topic, we encourage you to schedule a live demo of Panoptica.

Managing API Contracts and OpenAPI Documents at Scale

Source: cisco.com

Saturday, 2 December 2023

Effortless API Management: Exploring Meraki’s New Dashboard Page for Developers

A Dashboard Designed for Developers


APIs serve as the bridges that enable different software systems to communicate, facilitating the flow of data and functionality. For developers, APIs are the foundation upon which they build, innovate, and extend the capabilities of their applications. It’s only fitting that the tools they use to manage these APIs should be just as robust and user-friendly.

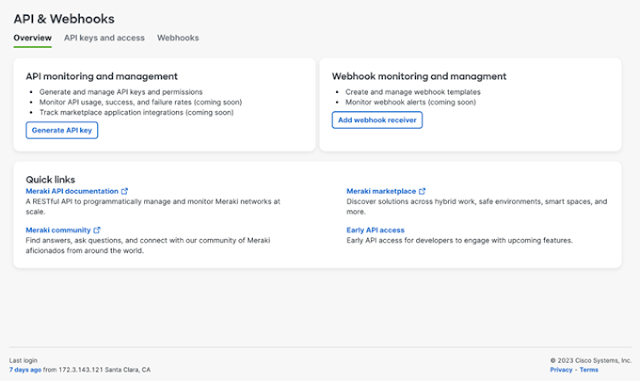
That’s where Meraki’s API & Webhook Management Page steps in. This dedicated interface is a testament to Meraki’s commitment to creating a seamless developer experience. It’s not just another feature; it’s a reflection of the understanding that developers need practical solutions to handle the complexities of APIs effectively.

Effortless API Management: Exploring Meraki’s New Dashboard Page for Developers

Simplifying API Key Management


One of the key aspects that API developers will appreciate is the simplified API key management. With just a few clicks, developers can create and revoke the API keys they need effortlessly. With this new page, you can easily manage the keys associated with the current Dashboard user account.

Effortless API Management: Exploring Meraki’s New Dashboard Page for Developers

Streamlining Webhook Setup


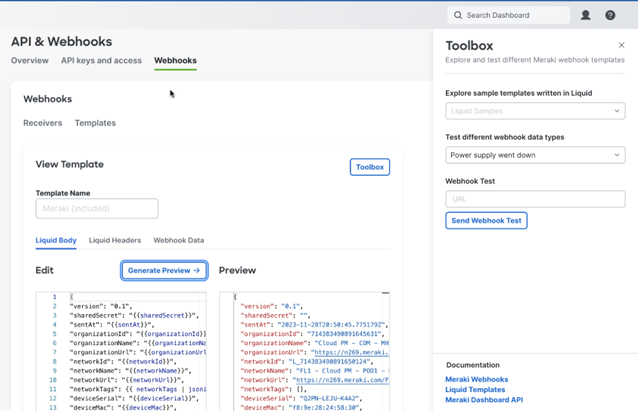
Webhooks have become an integral part of modern application development, allowing systems to react to events in real-time. The new UI offers a separate section to manage your webhook receivers, allowing you to:

  • Create webhook receivers across your various networks
  • Assign payload templates to integrate with your webhook receiver
  • Create a custom template in the payload template editor and test your configured webhooks.

Effortless API Management: Exploring Meraki’s New Dashboard Page for Developers

Many external services typically demand specific headers or body properties to accept a webhook. Templates serve as a means to incorporate and modify these webhook properties to suit the particular service’s requirements. Utilize our integrated template editor for crafting and evaluating your personalized webhook integrations. Develop custom webhook templates to:

  • Establish custom headers to enable adaptable security options.
  • Experiment with different data types, like scenarios involving an access point going offline or a camera detecting motion, for testing purposes.

Effortless API Management: Exploring Meraki’s New Dashboard Page for Developers

Connecting applications and services via webhooks has never been easier, and developers can do it with confidence, knowing that the shared Secret for webhook receivers is handled securely.

Access to Essential Documentation and Community Resources


Every developer understands the value of having comprehensive documentation and access to a supportive community. Meraki’s API & Webhook Management Dashboard Page goes a step further by providing quick links to essential documentation and community resources. This means that developers can quickly find the information they need to troubleshoot issues, explore new features, and collaborate with a like-minded community.

What’s on the Horizon?


I hope this blog post has given you a glimpse of the incredible features that Meraki’s API & Webhook Management Page brings to the table. But the innovation doesn’t stop here. Meraki’s commitment to an “API-first” approach means that new API endpoints for generating and revoking API keys will be available very soon, providing developers with even more control over their API integration.

Additionally, Meraki places a strong emphasis on security, aligning with API key security best practices. The sharedSecret for webhook receivers will no longer be visible after setting, enhancing the overall security of your API connections.

But we’re not stopping there. The roadmap ahead is filled with exciting updates and enhancements, promising to make the Meraki Dashboard an even more powerful tool for developers.

Source: cisco.com