Sunday 21 November 2021

Driving down IT OPEX with a Webex bot

Every IT organization strives for excellence by continuously driving down their operating expenses (OPEX) while providing the best-in-class experience to their user base. Several factors affect OPEX, such as increasing IT cases that require more resources to address recurring requests. Having a focused approach to reduce cases can significantly optimize on cost and improve the efficiency of IT Operations teams. One way that Cisco IT is driving down OPEX is by harnessing the power of automation.

By the end of September 2020, the number of service request cases to Management & Finance IT’s (M&F IT) Order Management (OM) Automation team in Cisco had been cut by half and operational costs reduced by one-third. The solution:  a self-help Webex bot called ‘OM-BOT’ that the OM Automation team created to assist with service request cases.

OM-BOT helps users answer queries without requiring any IT teams’ intervention. Below are some benefits of implementing OM-BOT:

◉ Avoided 140 IT cases per month

◉ Improved Mean Time to Resolution (MTTR): cases get created in the correct queue, reducing the time it takes to resolve cases

◉ Improved case routing: OM-BOT links user to the correct team to solve their cases

◉ Enhanced user experience: we meet with users weekly to discuss feedback, most of it positive

From January 2020 to September 2020, we, the OM IT Support Team, were receiving an average of 285 cases per month (see Figure 1). However, in the last six months, we’ve seen an average of 145 cases per month — a reduction of about 48.5 percent, most of which can be attributed to the usage of OM-BOT.

Cisco Prep, Cisco Tutorial and Materials, Cisco Learning, Cisco Guides, Cisco Certification, Cisco Career
Figure 1. The steady decline in service request cases under Order Management track in the last 2 years

Why did we build OM-BOT?


In early 2020, the OM Automation team realized that our incident case count per quarter was very high. When we investigated, we found that a lot of cases didn’t require IT fixes.  Users were seeking IT’s help to fetch data and information from the backend as it was not available in any of the tools or applications they used. We realized that we were spending a significant amount of time and resources in addressing non-technical related requests and we needed to get a little creative to solve this problem. We started exploring ideas on how to tackle it.

How did we build OM-BOT?


Around the same time, Cisco’s BotLite team were showcasing their new DIY No-code Low-code framework and toolkit with a rich GUI to create a bot with minimum technical expertise. BotLite leverages Cisco’s MindMeld and Webex and allows users to have human-like interaction with the bots they create through Natural Language Processing (NLP).

We saw this as a great opportunity to build our own bot to help answer user queries reported in service request cases. Our bot could easily connect to databases, pull the required information, and display it for the users in Webex. We formed a small, agile automation team of 3 members and identified the scenarios that caused the most confusion for users (See Figure 2). We set up a few sessions with the BotLite support team for their initial guidance on building a bot. It was pleasantly surprising to learn how simple and quick it was to create bot scenarios. After 4 sprint cycles, our first OM-Self Assist-BOT (now known as OM-BOT) was ready for our end users.

Cisco Prep, Cisco Tutorial and Materials, Cisco Learning, Cisco Guides, Cisco Certification, Cisco Career
Figure 2. A few of the common scenarios configured in the BOT
 

Did we face any challenges?


Once our bot was ready, our major challenge was end user adoption. Initially, not many users were aware of the bot or how it could help them. We continued to see a spike in request case numbers, and we were still spending a lot of manual effort addressing these requests.

We set up a weekly connect call with the team that was raising about 90 percent of request cases. We started showcasing the bot to them, gave demos on how to interact with the bot, and shared the bot user manual. We discussed the 13 scenarios that we identified and how the bot could solve these scenarios.  The team realized the potential of OM-BOT and spread the word within their extended team. The bot was helping them to get the required details quickly and they did not have to spend time creating IT cases. It was a win-win for our teams! We started seeing results from October 2020 onward and service request cases declined.

Another challenge was more technical in nature. We had to connect to two databases (Oracle and MongoDB) to fetch the data, but the BotLite framework only allowed a connection to the Oracle database. Without data from both databases, the information we wanted to provide to users was incomplete.

To fetch the data from both databases, we leveraged the BotLite API feature. Our team built an API to connect to MongoDB. It’s able to fetch data, combine it with the result from the Oracle database, and then display the information in Webex in a human-readable format. If the requested data is large, we can provide the result in a downloadable spreadsheet.
 

What is the roadmap ahead for the bot?


We regularly collect and implement feedback from our end-users. We receive their enhancement requests, and they also notify us when they encounter issues with the bot.

Some bot usage metrics from 2021 include:

◉ Over 600 unique users from across the world interacted with OM-BOT
◉ More than 20,000 messages were sent
◉ OM-BOT is accurately answering users’ queries, with a 97 percent Hit Rate

In the future, we want to continue driving down opex by providing users with “self-healing” options. By this, we mean, if the bot identifies an issue, it can also guide the user on how to fix the issue with some simple clicks in Webex itself rather than creating IT cases. We want to give this option to users as it will help us in case avoidance and improve the time to resolve such issues for them — which is critical for teams when we are working during time-crunch situations, especially, during our Month-End and Quarter-End periods.

Key Takeaways

In the past, chatbots were a nice gimmick without any concrete benefit, but today they are an indispensable tool in the corporate world and really help drive down OPEX. Of course, developing and running a chatbot is a lot of work and requires a financial investment, but there are many good reasons to build and implement a bot. Our efforts in creating OM-BOT have not only achieved case and cost reductions, but has also ensured that as the OM IT Support Team, we are now able to provide a best-in-class experience to our users. The bot enables our IT support agents to focus more on addressing critical IT issues while the bot takes care of service requests. I think conversational AI is the way forward, now more than ever, for every IT organization.

Source: cisco.com

Saturday 20 November 2021

What’s New in Cisco DNA Software: SD-WAN and Routing

Cisco DNA Software, SD-WAN and Routing, Cisco Certification, Cisco Learning, Cisco Preparation, Cisco Guides, Cisco Career, Cisco Materials, Cisco

Introduction

The enterprise networking business seems to always be in a state of flux. Entrants, features, solutions ebb and flow into and out of the market like tides at a beach in Florida. We know that you have come to trust Cisco as your enterprise networking partner and rely on us to ensure that the networking and security tools at your disposal are the sharpest and most fit for purpose in the market. In the spirit of continual improvement, and our goal of delighting our customers, we are happy to announce the following improvements to Cisco DNA Software for SD-WAN and Routing.

All good things come in three …

Cisco has made substantial changes to Cisco DNA Software for SD-WAN and Routing subscriptions all effective and implemented by the end of December 2021. The changes fall into three distinct areas: Cisco DNA for SD-WAN and Routing tier improvements, expanded bandwidth tiering, and right-pricing the Cisco DNA for SD-WAN and Routing Solution. We’ll discuss each of them in turn.

This section covers changes made to Cisco DNA Essentials for SD-WAN and Routing. Cisco is moving several features previously available in Cisco DNA Advantage down into Cisco DNA Essentials. Specifically, we have moved several Cloud Networking and Security features to Cisco DNA Essentials to enhance our SD-WAN and Routing entry-level offering for small and medium businesses, and to meet the needs of price-sensitive customers. Additionally, we have increased the VPN limitation in Cisco DNA Essentials to 4+1 (User/Management VPNs). The list and chart below speak to the feature additions in Cloud Networking and in Security to Cisco DNA Essentials for SD-WAN and Routing.

Cloud Networking functionality moving to Cisco DNA Essentials

◉ Essential Cloud OnRamp for IaaS, SaaS, and Colo

◉ Multicloud: GCP, AWS, Azure

Security functionality moving to Cisco DNA Essentials

◉ Cisco AMP with SSL proxy

◉ Basic URL filtering

Cisco DNA Software, SD-WAN and Routing, Cisco Certification, Cisco Learning, Cisco Preparation, Cisco Guides, Cisco Career, Cisco Materials, Cisco

As you can see, no changes were made to the feature functionality of, or license quantities included with, Cisco DNA Premier for SD-WAN and Routing.

Bandwidth Expansion


We have two changes in this section. First off, we have expanded Bandwidth Tier availability to all Cisco’s SD-WAN capable device families. Customers purchasing Cisco ISR and Cisco ASR devices now have the ability to select bandwidth tiers instead of individual bandwidth levels. Secondly, Cisco has increased the nominal and aggregate bandwidth capacities of Tier 0 and Tier 1 bandwidth purchases. Please consult the below chart detailing those changes.

Cisco DNA Software, SD-WAN and Routing, Cisco Certification, Cisco Learning, Cisco Preparation, Cisco Guides, Cisco Career, Cisco Materials, Cisco

We intend to slowly phase out the Discrete Bandwidth Level pricing construct in favor of the Tiered Bandwidth approach. You can assume that by the end of March, 2022, Tiered Bandwidth will be the only selection available.

Right-Pricing


Following the time-honored tradition of saving the best for last, pricing for Cisco DNA Essentials and Advantage for SD-WAN and Routing was given a once over and deemed lacking. Our analysis showed that price-sensitive customers were having difficulty aligning the cost of the subscription to the benefits of the subscription. The analysis also covered the competitive market and found there was room for improvement there as well. As a result, Cisco has revamped the subscription pricing for Cisco DNA software for SD-WAN and Routing, aligning the cost to the benefit and making Cisco much more competitive in the marketplace. The pricing adjustments will only be made to the Tiered Pricing option (Tiers 0/1/2/3), and not to the Discrete Bandwidth Level pricing. Pricing for Cisco DNA Premier for SD-WAN and Routing remains unchanged.

We won’t go into the grisly details here in this blog, but as a new subscriber, you will enjoy across the board list price reductions between 10% and 20% for Cisco DNA Essentials and Advantage subscriptions purchased in an Enterprise Agreement. If you’re looking at a la carte purchases, the list price reduction could be as high as 25%!

Source: cisco.com

Thursday 18 November 2021

The Business Why’s of migration to Cisco DNA Center

Cisco Prep, Cisco Tutorial and Materials, Cisco Certification, Cisco Guides, Cisco Skills, Cisco Jobs

You have not seen or heard of Cisco DNA Center. While they have done an impressive job with Cisco DNA Center- the talk is often about the technical merits, intents and functions. As we talk of cross domain, I want to cross the domain from what Cisco DNA Center does to why you should move to the solution in terms of business outcomes and user experience.

Recently there has been a lot of talk about Prime Infrastructure to Cisco DNA Center migration. It is important to call-out that while Prime Infrastructure is a network management/monitoring tool, Cisco DNA Center is a platform that does so much more — helping companies accelerate their digital transformation by providing insights, automation, and security across their networks in new and innovative ways.

So why should we move our IT organization to Cisco DNA Center? Part of my answer is that if you want to continue to run IT as we did 10 to 15 years ago – Prime Infrastructure will suit you just fine. However, if you are in a business that is growing, actively working on its digital transformation, grappling with hybrid work, wanting to leverage artificial intelligence and machine learning, or overall want to be more efficient, then you should read on. 

Just as we see electric cars redefining transportation, Cisco DNA Center is redefining enterprise infrastructure software and network management. It is transforming infrastructure organizations across so many different use cases and personas including AIOPS, NETOPS, SECOPS, and DEVOPS which is no small endeavor.

In talking to various CIO’s and IT leaders, a common question comes up; “How do I turn IT into a competitive advantage for my organization?”. I interpret the question to be, “How do I use my IT infrastructure to drive business outcomes?” It is my belief that there are countless opportunities to differentiate depending on your industry sector.

My top 5 reasons why your organization would benefit from Cisco DNA Center:

Your Reputation 

Reputation is critical. An IT organization’s reputation comes from delivery of services and uptime. As network infrastructure has reached the status of utility – everyone expects to have the infrastructure up and running 24/7, anything less than that can hurt the organizational reputation. The fact that Cisco DNA Center can help prevent outages and drastically shorten Mean Time to Resolution (MTTR) directly contributes to reputation. At the University, we are proud of the reputation our IT department has established and it is in large part due to the success we have had with Cisco DNA Center.

Visibility

Visibility; It is impossible to manage that which you can not see. As today’s infrastructure is everywhere, especially with the proliferation of wireless and IoT, visibility into the network with streaming telemetry enhances IT’s ability to monitor and manage the infrastructure. With AI/ML it enables visibility not possible before. As an innovative University IT, with Cisco DNA Center, we have gained tremendous new insights into the health of our entire network estate infrastructure previously not possible with Prime Infrastructure.

Automation

Automation and orchestration is something a lot of IT organizations talk about, but largely speaking, it is more commonly seen managing cloud applications, not network infrastructure. Cisco DNA Center helps with automation workflows which saves time, effort, and creates consistency across the infrastructure and can help eliminate operator errors, the leading cause of outages. The IT staff is so much happier not having to worry about making errors when doing high volume or highly repetitive tasks.

User Experience

User Experience is king – if your IT team does not have a way to measure and track the user experience, it is hard to deliver what you can’t measure. That being said, there are a plethora of different ways to track and measure wired and wireless user experience with Cisco DNA Center. Measuring user experience with Cisco DNA Center is a topic unto itself and warrants its own blog, so stay tuned for that. But so far, our student, faculty, and guest user experience has been dramatically improved since using Cisco DNA Center.

Proactive Management/Actions

Proactive Actions – The fact is that “IT” is a service organization and as we strive to perform service improvement – we make every effort to become more and more proactive. Cisco DNA Center has been able to redefine proactive AI/ML and the ability to identify early stages of failures and allow notification and intervention before it becomes a user-impacting event.

The Machine Reasoning Engine (MRE) is another capability that leverages artificial intelligence (AI) to automate complex network operation workflows. It is like having a 30-year Cisco veteran standing behind your shoulder when you are trying to solve a difficult problem by automatically troubleshooting the issues, identifying the most probable root cause, and providing the recommended corrective action. The MRE is powered by a cloud-hosted knowledge base, built by Cisco, and will progressively give you more and more options to not only automatically troubleshoot issues, but to automatically resolve and remediate them as well. 

Security

Information/Cyber security is one of the holy grails of IT.  I am guessing many struggle with what is more important, user experience or information security. The good news is that they are complementary with Cisco DNA Center.  Cisco DNA Center can help keep the network in compliance with software, best practices, and security advisories. It can also provide visibility to the InfoSec department about the security posture of the infrastructure. To top the icing on the cake, Cisco DNA Center is also able to install hot patches on equipment with IOX-SE without system reloads. This is huge from the aspect that we can react quickly to security remediation when we can do it without having to take downtime.

I know I said top five – but it worked itself into a Top 6 list. The reality is that I can go on and on as with each new release of Cisco DNA Center, there are tons of new features, workflows and innovations added to the platform. Deploying Cisco DNA Center into an organization and realizing its full potential can take some time and effort – but it is super easy to get started and start seeing value right away. There is also an abundance of resources to help your organization achieve its goals and progressively add capabilities at the pace that makes sense to your organization. But rest assured, it will improve how your organization operates and functions and can really add significant business value across your business.

To that end, I wanted to conclude with some tangible business value and benefits that organizations can yield from Cisco DNA Center. As always your mileage may vary (YMMV) depending on your organization.

Ticket Resolution Time (MTTR metric)

◉ Wireless Issue investigation time reduced to minutes; estimated time reduction is 75% from using Prime for the same task.

◉ Ability to use Cisco DNA Center to restore configuration to/from switching hardware failures, reduced hardware recovery time by 50%.

◉ MRE (Machine Reasoning Engine) empowers more Junior-level staff to troubleshoot issues further reducing support costs by 30%.

Reduction in Tickets 

Within 90 days of activity using Cisco DNA Center assurance to optimize the network, we have seen:   

◉ 50% reduction in wireless trouble tickets

◉ Failure detection (power supplies, SFPs) enabling more proactive repair and eliminating troubleshooting through proactive management. 100% reduction for preventable failures from component failures.

Cost Savings/Operational Efficiency improvements

◉ Switch Software upgrades (SWIM) processes resulting in 75% reduction in engineering time, which also translates to 75% savings in labor hours.

◉ Overall team efficiency – with the Cisco DNA Center tools and automation, more Junior-level staff are now able to perform tasks (MRE, visibility), yielding 20% reduction in operations support costs through annual salary savings.

Business Confidence

◉ Sensor data from the 1800s provides a comprehensive view of measured user experience not previously possible.

◉ Security Assessment due to software version not previously automated. This not only reduces the effort but more importantly helps ensure security related compliance previously not attainable with existing staffing levels.

Source: cisco.com

Tuesday 16 November 2021

Cisco Secure Cloud Insights is your Eye in the Sky

Cisco Secure Cloud Insights, Cisco Preparation, Cisco Learning, Cisco Certification, Cisco Prep, Cisco Career, Cisco Skills, Cisco Job

In the world of cybersecurity where information holds the keys to the kingdom, there is no shortage of data generated by numerous security tools. However, there arguably remains a lack of information. Security professionals often refer to information as ‘Actionable Intelligence’ or ‘Context’. Those engaged in the trenches of cyber warfare would appreciate a more nuanced view which states that Context is the catalyst that converts Data into Intelligence. Context helps answer important questions such as How, What, Where, When and Who, but even more advanced questions such as So What and What Next, to get to the root cause and aid remediation. While context may be an easy concept to grasp, execution remains challenging.

With that context (pun intended) I am pleased to announce the launch of Cisco Secure Cloud Insights in partnership with JupiterOne. Secure Cloud Insights brings fresh and powerful capabilities to the SecureX portfolio, including comprehensive public cloud inventory and insights, relationship mapping to navigate cloud-based entities and access rights, and security compliance reporting. This new offering extends beyond traditional cloud security posture management and will enable Cisco’s security customers to effectively manage risk and reduce the attack surface of their cloud-native processes and applications.

Cisco has witnessed organizations on their digital transformation journeys grappling with IT sprawl and struggling to gain visibility into their cyber universe. Cloud Insights addresses this very pain-point by tracking and normalizing data across multi-cloud and hybrid environments. Cloud Insights provides a knowledge graph of consolidated metadata pertaining to configurations, access policies, settings, tags, rules, and more that govern interaction between entities. Entities encompass users, roles, groups, policies, databases, datastores, devices, code repositories, storage buckets (eg. AWS S3), cloud compute instances (eg. AWS EC2), containers, functions, etc. APIs ingest this data from approximately fifty pre-defined integrations covering public cloud environments, vulnerability scanners, endpoint protection and network security tools, development and code repositories, identity providers, and more. Custom integrations are also supported using SDKs and webhooks.

Cisco Secure Cloud Insights, Cisco Preparation, Cisco Learning, Cisco Certification, Cisco Prep, Cisco Career, Cisco Skills, Cisco Job
Figure 1: Visualization of the graph database

While the graph database of mapped interactions is one of the key pillars of Cloud Insights, the other pillar is the ease with which this rich data can be queried. A simple plain language search maps to over 550 pre-built queries, with the option to create custom queries. Queries, singly or in combination, form the basis of all outcomes, be they alerts, summary dashboards, or compliance reports. By querying against this comprehensive relationship graph, tremendous opportunities and use cases become available. Cloud Insights uses this rich context to determine an organization’s security posture, including Cloud Security Posture Management, and reduces exposure by reporting compliance gaps, thereby promoting effective cyber governance and attack surface management.

With this introduction to Secure Cloud Insights, let us examine how the service fits in an organization’s security apparatus. We are experiencing a coming together of security outcomes that serve various stakeholders, be it Security Operations, Development Operations, Application Security, Cloud Architects, or Identity and Data protection processes.

Cisco Secure Cloud Insights, Cisco Preparation, Cisco Learning, Cisco Certification, Cisco Prep, Cisco Career, Cisco Skills, Cisco Job
Figure 2: Interaction between various cloud-native security functions

While SecOps starts on the left with security posture and attack surface management as its entry point, DevOps start at the far right with continuous integration and continuous delivery (CI/CD) pipeline and application/API security as their main care about. As SecOps moves right and begins to influence the other stakeholders within a mature organization, DevOps shifts left to include pre-deploy checks by using runtime security inputs. Due to this evolution in operations, tooling is needed to provide end-to-end coverage, no matter who the buying center or user is in an organization. Cloud Insights is thus positioned to provide contextual visibility that encompasses and enhances observability across the entire organization.

It is for this reason that we have integrated Cloud Insights with Cisco’s security platform SecureX and intend to have it play a bigger role as a context wrapper for numerous other Cisco security services. Early research suggests force multiplier effects through interactions with SecureX’s Device Insights, and a symbiotic relationship with Cisco Secure Cloud Analytics (formerly Stealthwatch Cloud). While Secure Cloud Insights connects the dots, Secure Cloud Analytics baselines behavior by analyzing traffic flowing between those dots. Integrated together, they can surface relationship-based and anomaly-based threat vectors. Early interest has also been evinced by the market of this powerful duo’s interaction with other Cisco Secure properties such as Portshift and Kenna. With this partnership, Cisco has strengthened its position to serve our customers’ cloud native and hybrid IT security needs. It has also strengthened the Cloud component in Cisco’s SecureX Platform, as seen in the figure below.

Cisco Secure Cloud Insights, Cisco Preparation, Cisco Learning, Cisco Certification, Cisco Prep, Cisco Career, Cisco Skills, Cisco Job
Figure 3: Inclusion of Cloud Insights to Cisco SecureX

Source: cisco.com

Tuesday 9 November 2021

Introducing 400G in Access Network

Cisco Prep, Cisco, Cisco Exam Prep, Cisco Preparation, Cisco Tutorial and Material, Cisco Guides, Cisco Career

There have been a plethora of articles written on how this pandemic has transformed the way people go about their daily lives. And if there is one thing which everyone agrees is that the role of the Service Provider’s telecommunications network has never been more critical than it has been since the turn of the decade. The need for connecting more devices to the network, the insatiable demand for bandwidth, and the criticality of network reliability have created more expectations and also newer revenue opportunities for Service Providers. This requires Service Provider to re-look at their current network and transform them to provide a reliable and consistent user experience. The access and aggregation network of the service providers are at the cusp of this transformation and are challenged by increased capacity, low latency, ultra-reliability requirements driven by the transition from 1G to 10/25/100G. At Cisco, we have been relentlessly working on transforming the economics of moving the bits to build and run the infrastructure, in a secure and simplified way.

NCS 540 portfolio helps the customer in their transformation journey, with a myriad range of products meeting different capacity and interface requirements all the way ranging from 1G to 100G. As of writing this content in 2021, Cisco has sold over 100,000 devices in a short period of time. To recap the benefits of the NCS540 product family which has seen product launches in each of the years 2018/2019/2020/2021 :

◉ Hardened and ruggedized with transformed economics to move the bits

◉ Large number of interface port options from 100Mbps to 100G

◉ Stringent Timing and latency capabilities

◉ Secure, Reliable, and Carrier-Grade Operating System (IOS-XR)

◉ Application-aware network with Segment Routing

◉ Simplified Automation capability with Telemetry/Netconf Yang.

We are now accelerating the success of NCS 540, by introducing 400G to the access network with NCS 540 Large Density Router

Currently, there is a paradigm shift happening, with the convergence of IP and optical layer, which helps reducing complexity, allows operators to maximize the current fiber capacity, and offer more CAPEX and OPEX savings. The new architecture allows us to put the onus back on the router which helps in simplifying the management of the network. The density and form factor of optics have greatly reduced over time and with the evolution of digital coherent solution, a 400G optics can now directly reside in a router with zero density trade-off. So why does 400G be an option only for Core Networks even though we are seeing the router capacity increasing multifold at the access layer? Why not extend the benefit of the technology innovation all the way to access networks? Our new NCS 540 Large Density router has been designed keeping these innovations in mind.

Cisco has recently published a detailed whitepaper on the Economic Benefits of using Converged 400G IP Transport. With the launch of the NCS 540 Large Density router, we are extending the capability to scale to 400G.

Cisco Prep, Cisco, Cisco Exam Prep, Cisco Preparation, Cisco Tutorial and Material, Cisco Guides, Cisco Career

So, what is so unique about our Large Density Router? Built on merchant silicon ASIC, the large density router is now able to extend the 400G coherent technology all the way to the access network. The NCS 540 large density aligns with Cisco Routed Optical Networking Architecture, which relies on a single control plane based on IP/MPLS in a converged hop-to-hop IP and optical network. It is not just about 400G, the large density router also supports SFP56, which offers backward compatibility with SFP28/SFP+/SFP, using the same PAM4 technology used in 400G. All these technological innovations are offered in a 1RU temperature hardened form factor, and 299mm in depth, making it suitable for deployment as a cell-site router, pre-aggregation, or an aggregation router. The platform also offers tighter time and phase synchronization and high-accuracy clocking along with GNSS (Global Navigation Satellite System) capabilities needed for 5G networks.

Powered with Cisco IOS XR software, the NCS 540 Large Density router offers customers an end-to-end SDN-based solution that will enable a programmable network coupled with Cisco’s automation platform that utilizes real-time network telemetry for advanced traffic engineering and control. As operators are looking to upgrade their network for 5G and Broadband deployments, why not future proof it so that you can scale well beyond today’s capacity, performance requirement and offer lower TCO. NCS 540 Large Density router will help in this transition offering better simplification and operational efficiencies.

Source: cisco.com

Sunday 7 November 2021

Catalyst 9000 Simplifies Network-Based Threat Detection Using Inline Security Telemetry

The term Catalyst is synonymous with accelerating change, stimulating actions, and facilitating transformations. The Cisco Catalyst 9000 family of switches and access points support these qualities for enterprise networks around the world, making it the fastest ramping product in Cisco’s history. Based on a powerful and flexible Programmable ASIC with Unified Access Data Plane (UADP) that unites wired and wireless data planes, the enterprise networking platform has delivered continuous innovations since its introduction, including:

◉ Purpose-built Zero-Trust Fabric for campus to branch with Cisco SD-Access

◉ Docker-based application hosting enabling use cases such as running ThousandEyes Agents on the switch

◉ Network-Based Application Recognition Engine (NBAR) for identification and control of 2000+ applications

As enterprise networks expand from centralized data centers and campuses to support a distributed workforce and thousands of edge IoT devices, IT faces unique security challenges. While the workforce can take advantage of zero-trust multi-factor authentication to ensure proper access security, IoT devices cannot. Now Cisco is leveraging the programmability of the UADP ASIC to deliver zero-trust security for the world of IoT devices.

Zero Trust for IoT Using Network Telemetry Analytics

IoT devices should be continuously assessed to check for unusual behavior such as pretending to be trusted endpoints using MAC Spoofing, Probe Spoofing, or Man-in-the-Middle techniques. IoT devices—typically smart building technologies such as lighting, HVAC, and security cameras—need to be segmented from Information Technology assets to prevent threats from moving laterally in the network. The key to segmenting IoT devices is to accurately profile and classify them according to type, communication protocols, and traffic patterns. To implement Zero Trust with least privilege access, both historical and real-time traffic telemetry needs to be available to Trust Analytics to detect sudden changes in device behaviors.

To attempt to accomplish this in the past, overlay solutions required spanning of live traffic from switches to collectors that run analytics on samples of telemetry. These additional components, as depicted in Figure 1, introduce deployment, configuration, and maintenance complexity, thereby increasing the TCO as well as IT overhead.

Cisco Prep, Cisco Preparation, Cisco Exam Prep, Cisco Tutorial and Materials, Cisco Certification, Cisco Learning, Cisco
Figure 1. Typical Overlay Model for Telemetry Generation

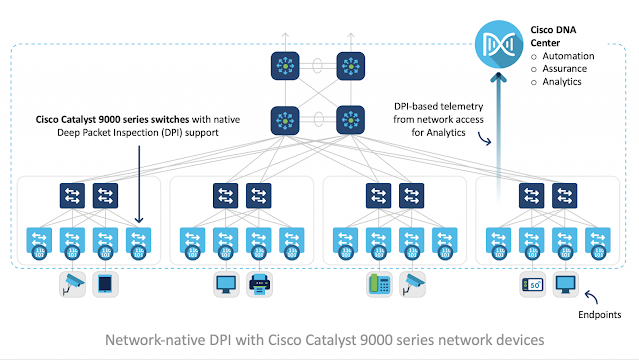
The unique way Catalyst 9000 switches and access points solve this problem—in conjunction with Cisco SD-Access—is by generating inline telemetry directly on the switches. This capability, based on the power of the UADP ASIC, eliminates the need to make copies of traffic from every switch to send to multiple services—exporters, brokers, collectors, and analyzers for each kind of traffic—to generate the necessary security telemetry. The capability to stream full telemetry information directly from Catalyst switches provides operational status of the network as well as Deep Packet Inspection of traffic flows so that Cisco DNA Center can detect the true purposes of device-to-device communications. Since DPI telemetry is generated directly by Catalyst switches, the need for expensive extraneous appliances is eliminated, as shown in Figure 2.

Another advantage is that since all Catalyst 9000 switches are generating telemetry simultaneously, there is no single point of failure—such as when a data broker is offline—increasing the reliability of catching abnormal traffic patterns being generated by an attempted infiltration by a threat actor.

Cisco Prep, Cisco Preparation, Cisco Exam Prep, Cisco Tutorial and Materials, Cisco Certification, Cisco Learning, Cisco
Figure 2. Deep Packet Inspection and Telemetry Generation with Catalyst 9000 Switches

Maintaining Zero-Trust Across Campuses


Wired and wireless traffic telemetry in one platform provides an expansive view across the campus for pinpointing security anomalies and threats from devices of all types. Cisco SD-Access plus Catalyst 9000 switches and access points uniquely provide traffic telemetry to Cisco DNA Center to identify device types, categorize devices by security group tags, and monitor every device for behavior anomalies.

For example, with all traffic telemetry streaming from Catalyst 9000 switches and access points, Cisco DNA Center can analyze the traffic being generated by each individual device and identify the type—security cameras, motion sensors, lights—tagging them with access policies for segmentation. Should a camera start talking in laptop language from a man-in-the-middle attack, the trust level of the camera will automatically be downgraded and isolated to prevent the lateral spread of an infection.

Cisco Prep, Cisco Preparation, Cisco Exam Prep, Cisco Tutorial and Materials, Cisco Certification, Cisco Learning, Cisco
The Cisco SD-Access Zero-Trust Journey

Connect, Secure, and Automate with Catalyst 9000 Infrastructure


The software-defined network fabric consisting of Cisco Catalyst switches and access points becomes a vast matrix of sensors supplying data for security analytics that monitor, detect, isolate, and report on threats as they occur. The Catalyst 9000 family of switches provides real-time security telemetry from millions of devices across multiple campus sites, from inner to outer edge of the network for endpoint analytics, policy analytics, and trust analytics to connect, secure, and automate the enterprise.

Source: cisco.com
Saturday 6 November 2021

End-to-End Flow State Validation with Nexus Dashboard Insights Connectivity Analysis

Most IT operations folks are familiar with vaguely worded statements like “My application performance is bad,” “The network is slow,” and “Sometimes it works but sometimes it doesn’t.” Often, there’s very little concrete information to work with when attempting to diagnose network performance problems. Any number of possible culprits across a variety of different devices could be wholly or partially contributing to an issue. That leads to the question: “How do you quickly and definitively identify the issue?”

After ruling out the obvious, and some not-so-obvious, signs of a network issue–things like drop counters massively incrementing on an interface, incorrectly applied QoS or security policies, or insidious microbursts–the IT operator is often left with nothing else to do than delve deep into the guts of the network fabric to ensure that all devices and paths between a source and a destination have proper network state, in both the control plane and the data plane.

The Old Way

How does an IT operator approach this problem? The “Old Way” involves a tedious, error-prone, multi-step workflow to validate that the network is behaving as intended.

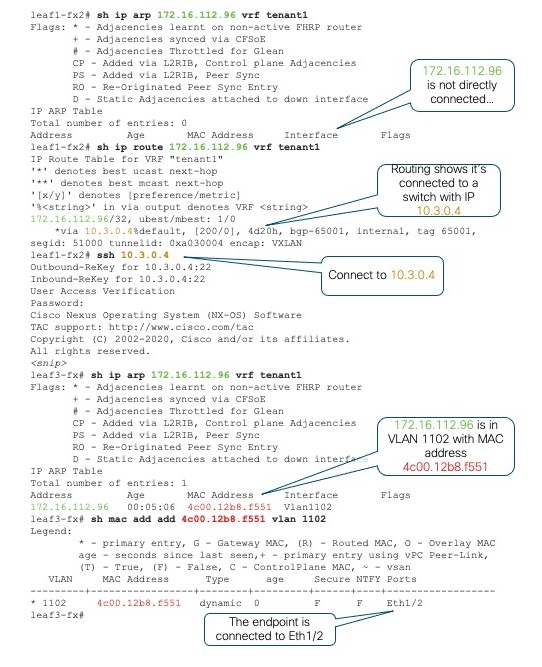
First, the leaf switches that have the problematic source and destination device attached must be identified. In this era of multi-tenancy, virtual machine mobility, and dynamic workload placement, identifying the edge devices is not as straightforward as it might seem. The approach typically involves logging into a random leaf switch and checking the local Address Resolution Protocol (ARP) table to see if the target IP happens to be directly attached in one of the virtual routing and forwarding (VRF) instances active on the switch.

Failing that, we can check the routing table in the appropriate VRF, hopefully identifying which remote switch has the IP attached. Next, login to that switch, check the local ARP table, identify the virtual LAN (VLAN) of the endpoint, and then check the media access control (MAC) table to find the physical interface. Repeat the process for the destination IP address. It’s tedious work, but necessary for ultimately identifying the leaf switches involved.

Figure 1 illustrates the typical workflow for identifying where a given endpoint attaches to the network fabric. In this case, we’re looking for host 172.16.112.96 in VRF “tenant1”.

Cisco Nexus Dashboard Insights Connectivity Analysis, Cisco, Cisco Exam Prep, Cisco Tutorial and Materials, Cisco Preparation, Cisco Guides, Cisco Career, Cisco Skills, Cisco Jobs
Figure 1. Identifying an Endpoint Location

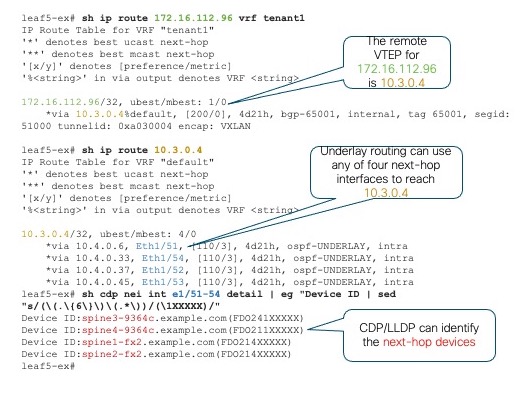
Once we’ve identified the edge switches with the target endpoints attached, the next task is to identify all the possible paths through the fabric that can be used by those endpoints to communicate and which devices sit in each of those paths. We’ll take a simple spine-leaf topology where each leaf switch connects to four spine switches that provide the leaf-to-leaf interconnection.

If one of our endpoints is on switch “leaf5-ex”, we first identify the destination Virtual Tunnel Endpoint (VTEP) of the other endpoint via “show ip route”, then identify the underlay routing paths available to reach that VTEP. For a simple topology it may be obvious which devices are part of the end-to-end path. In other cases, we can use Cisco Discovery Protocol (CDP) or Link Layer Discovery Protocol (LLDP) neighbor details to identify the device IDs and host names of the transit devices.

Cisco Nexus Dashboard Insights Connectivity Analysis, Cisco, Cisco Exam Prep, Cisco Tutorial and Materials, Cisco Preparation, Cisco Guides, Cisco Career, Cisco Skills, Cisco Jobs
Figure 2. Identifying Paths and Devices

Depending on the topology, we may need to repeat this process multiple times to identify all relevant devices and paths. The goal is to identify to which leaf switches the endpoints are attached, the switches that interconnect them, and the interfaces that make up the available paths.

Next, we must validate that the control plane routing and forwarding state on every device along each of the paths is correct and consistent with the data plane state. We must connect to each device and check a variety of components, which may include routing protocol state, routing information base (RIB) state, spanning-tree state, interface status and health, and so on. We may also need to run one or more consistency checkers, which is logic built into NX-OS to ensure that the forwarding state known to the control plane is consistent with the contents of the Forwarding Information Base (FIB) and other hardware tables programmed into the ASIC hardware. This validation can be time-consuming and error prone. Wouldn’t it be nice if there was an easier way?

The Easy Way


It turns out, there is an easier way! Nexus Dashboard Insights, with its powerful Connectivity Analysis tool, takes the elements of tedium and human error out of the process of validating the end-to-end path between two endpoints in the network fabric. With minimal operator interaction, the Connectivity Analysis tool ensures that all fabric devices have up-to-date diagnostic capabilities, identifies which leaf switches the targeted endpoints are connected to, identifies all possible paths between those endpoints, and then ensures that both control plane and data plane states are valid and consistent to enable end-to-end network connectivity through all relevant devices.

NOTE: As of Nexus Dashboard Insights version 6.0, the Connectivity Analysis tool is available for NX-OS-based fabrics. A planned future release will introduce similar functions for Application Centric Infrastructure (ACI) fabrics as well.

Not only does the Connectivity Analysis tool validate the end-to-end network state, it also generates an intuitive path view showing all network devices in the path and highlighting any issues encountered that could affect successful communication between the target endpoints.

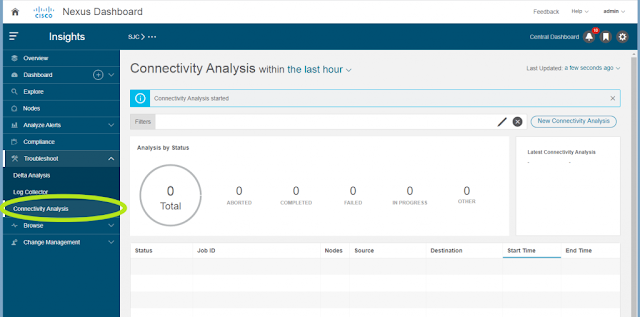
Figure 3 shows the main Connectivity Analysis screen when you open Nexus Dashboard Insights, presenting a summary of all prior analysis jobs with their current state (Completed, Failed, In Progress, etc.) as well as a button for creating a New Connectivity Analysis job. Of course, a Representational State Transfer (RESTful) API is also available for automating creation of new analysis jobs and querying their status.

Cisco Nexus Dashboard Insights Connectivity Analysis, Cisco, Cisco Exam Prep, Cisco Tutorial and Materials, Cisco Preparation, Cisco Guides, Cisco Career, Cisco Skills, Cisco Jobs
Figure 3. Connectivity Analysis Tool in Nexus Dashboard Insights

Taking the earlier example, if we’re debugging an issue between a known source and destination endpoint, we can create a new Connectivity Analysis job and simply plug in the source IP, destination IP, and VRF information. The tool can analyze both Virtual Extensible LAN/Ethernet VPN (VXLAN/EVPN) flows as well as “Classic” Layer 2 or Layer 3 flows and provides an option to run the analysis in Quick mode or Full mode. Figure 4 shows the Analyze Connectivity screen where you enter the required information and control the various job options.

Cisco Nexus Dashboard Insights Connectivity Analysis, Cisco, Cisco Exam Prep, Cisco Tutorial and Materials, Cisco Preparation, Cisco Guides, Cisco Career, Cisco Skills, Cisco Jobs
Figure 4. Connectivity Analysis User Input

In Quick mode, the Connectivity Analysis tool simply validates the basic control plane, forwarding health on relevant devices, including all overlay and underlay routes and interfaces, while also generating a visualization of the path topology between source and destination. In Full mode, multiple additional checks are performed, including a complete analysis of consistency between software and hardware forwarding state in all relevant forwarding tables.

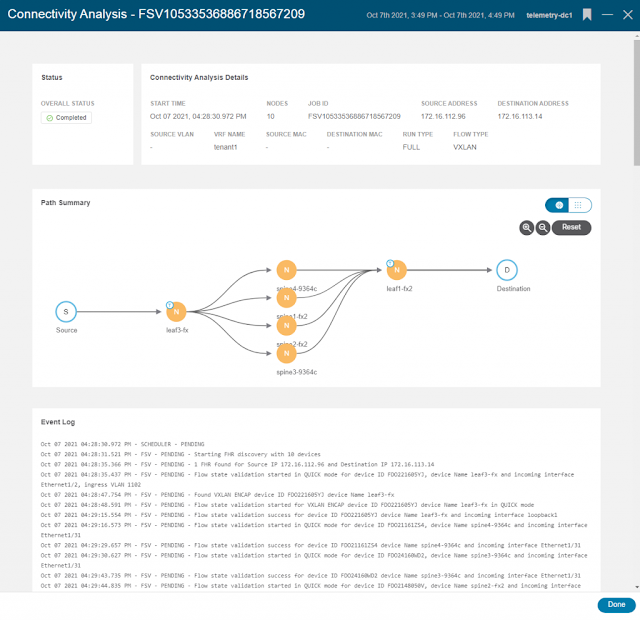
Figure 5 shows the completed job summary, the topological view of all the network devices and paths between the source and destination, and a full Event Log with details of the job.

Cisco Nexus Dashboard Insights Connectivity Analysis, Cisco, Cisco Exam Prep, Cisco Tutorial and Materials, Cisco Preparation, Cisco Guides, Cisco Career, Cisco Skills, Cisco Jobs
Figure 5. Completed Connectivity Analysis Job Summary

Double-clicking any network node opens details for that device. Figure 6 shows the detail view (in this case for the device “spine2-fx2”), including summary data, path information, and detailed interface information for the relevant interfaces, with a description and status of each validation check performed as part of the analysis.

Cisco Nexus Dashboard Insights Connectivity Analysis, Cisco, Cisco Exam Prep, Cisco Tutorial and Materials, Cisco Preparation, Cisco Guides, Cisco Career, Cisco Skills, Cisco Jobs
Figure 6. Job Details for an Individual Switch

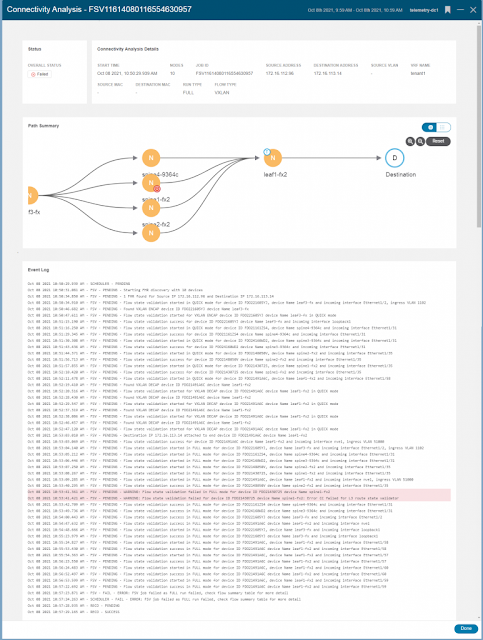
While the examples above uncovered no problems, if a job encounters an issue on one or more nodes, the tool shows all the details of the failure and impacted devices. For example, Figure 7 shows a failed job where an inconsistency was discovered between the software state and the hardware programming on a spine node.

Cisco Nexus Dashboard Insights Connectivity Analysis, Cisco, Cisco Exam Prep, Cisco Tutorial and Materials, Cisco Preparation, Cisco Guides, Cisco Career, Cisco Skills, Cisco Jobs
Figure 7. Connectivity Analysis Discovering an Issue

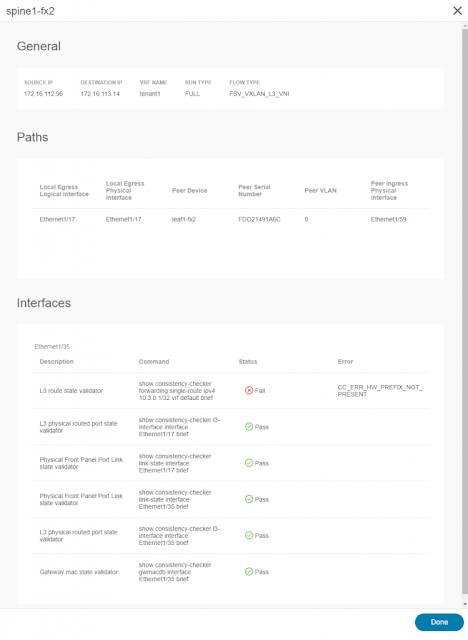
Double-clicking on the failed node (spine1-fx2) reveals the cause of the failure (as shown in Figure 8). A control-plane route was not programmed into the hardware correctly, resulting in an inconsistency. Since the failure is on a spine node, such a programming failure can result in sporadic issues. For flows that hash to other spine nodes, performance is not impacted, but any flows hashing to the mis-programmed spine could be black-holed.

Cisco Nexus Dashboard Insights Connectivity Analysis, Cisco, Cisco Exam Prep, Cisco Tutorial and Materials, Cisco Preparation, Cisco Guides, Cisco Career, Cisco Skills, Cisco Jobs
Figure 8. Failed Node Details

Uncovering such situations can vastly reduce the time required to conduct root cause analysis for forwarding issues in a large fabric. With the option in Nexus Dashboard Insights to collect detailed technical support data from the fabric and upload it to Cisco with just a few clicks, triaging issues locally or with Cisco TAC and driving them to resolution becomes considerably less time-consuming and work intensive.

Key Takeaways


The Connectivity Analysis tool provided by Nexus Dashboard Insights delivers a new level of simplicity and efficiency to the traditionally error-prone and time-consuming task of validating the end-to-end path between endpoints experiencing performance issues or packet loss. With just a few key pieces of information, the Connectivity Analysis tool does all the heavy lifting for you: identifying the leaf switches to which those endpoints attach, discovering all the possible paths between those endpoints through the fabric, and validating the health and consistency of each device and path involved.

Armed with the resulting data, IT operators can either rapidly prove that the network is “innocent” and that the problem likely lies with the host or application or, if a problem does exist in the network, identify the exact nature of the problem and the devices involved. With the additional capability in Nexus Dashboard Insights to easily collect logs and other technical support data and upload it to Cisco via the Cisco Intersight Cloud, tracking down problems in the network and driving them to rapid resolution is easier than ever before!

Source: cisco.com