Identifying and Resolving Issues
IT teams require end-to-end visibility to ensure business critical applications are accessible and running effectively. But they often struggle with siloed processes and juggling multiple tool-sets to manage and monitor the network. They also need to ensure the network configuration is compliant with the established business intent. Cisco just released Nexus Dashboard 2.1.2 and Nexus Dashboard Insights 6.0.2 that addresses these issues and enables IT to identify and quickly resolve issues that ultimately enhance workforce productivity and efficiency.
It is often difficult to understand where issues lie in the network. Is it the physical devices, the endpoints, the applications, or the configurations—or possibly something else? Having this lack of knowledge increases the troubleshooting complexity as well as the time it takes to locate pain points.
Nexus Dashboard Insights 6.0 brings innovative One-Click Remediation, with which IT can identify issues in a single dashboard and resolve them with—literally—the click of a button. For example, as shown in the following screenshot, there is an anomaly with an access-entity profile that’s not associated to any of the domains. This issue will have a major impact into the network and applications for the workforce.
To fix this type of problem, NetOps needs to login to the Cisco Application Policy Infrastructure Controller (APIC) and check the application profiles, domains, and cross-check numerous places to make sure it won’t impact any other connections. However, the new One-Click Remediation feature provides NetOps with a diagnostic report and a “fix button” that will immediately resolve the issue. This dramatically reduces the amount of time and steps to identify and resolve an issue.

IT also needs to support business-critical applications by ensuring they are compliant with business intent and security policies. The new Compliance and Pre-Change Analysis features in Cisco Nexus Dashboard Insights provides a proactive approach to ensure configurations are properly setup to ensure applications are meeting the company’s business intent.
For example, a company may have a standard policy to prevent traffic from an internal server to the Internet. IT can create an applicable compliance requirement (shown in screen below) to be notified if the server begins communicating with the internet.

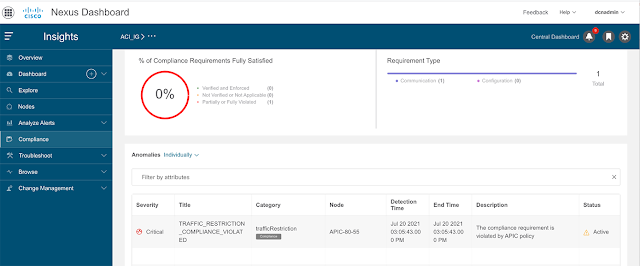
If there is a traffic between the internal server and the internet, then IT will receive a CRITICAL traffic restriction violation based on the compliance policy. IT can then analyze the anomaly to see what configuration is incorrectly allowing the traffic flow. In this example there is a contract allowing the traffic between the internal server and the internet. The new compliance feature enables IT to be proactive and identify issues before they start becoming a threat.
As part of Nexus Dashboard Insights new features, the Pre-Change Analysis enables IT to fix this specific traffic violation issue (by deleting the contract) and to ensure this won’t cause any other issues. Using the Pre-Change Analysis, IT can test the proposed configuration change and evaluate its impact on the network prior to committing any network changes. The following screen shows an example of deleting an existing contract between the internal server and the internet.
IT can also identify if there are any potential issues with a particular configuration change by looking at a snapshot of the current configuration and comparing it with the proposed configuration. IT can also look at all the resources that will be affected by this proposed change.
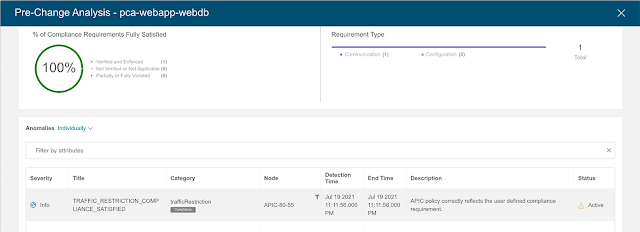
As shown in the following figure, the compliance requirement is met with the proposed change. IT can confidently make the change and know that there will be no negative impact on the network. With these Cisco Nexus Dashboard Insights features, IT can quickly and easily fix an issue to meet a compliance requirement for their business-critical applications, as well as validate the outcomes of the fix through Pre-Change Analysis before implementing the configuration.
Insights for Network Resiliency
At any point of time, IT strives to maintain network resiliency to securely meet the goals of business operations. Cisco Nexus Dashboard and Nexus Dashboard Insights provides the visibility, trust, and tools that IT needs to be successful. Learn more details about Nexus dashboard Insights from our Resource links below.
Source: cisco.com


0 comments:
Post a Comment