Wednesday, 24 April 2019

Connected Car – What is Your Vehicle Reporting?

Cisco Tutorial and Material, Cisco Certifications, Cisco Learning, Cisco Study Materials, Cisco All Certifications

We looked at In-Vehicle Infotainment, focusing on streamed media and navigation services. In this blog, we’ll look at Connected vehicle services and telemetry. What is this and what data volume does it represent?

Vehicle services


Some vehicle manufacturers such as Jaguar, provide additional information services to the vehicle owner/user. For example, the InControl service includes the ability to report completed journeys. This function provides the customer with information about their journeys including the journey distance, real-time location, the duration of the journey, the average speed and data about the efficiency of the journey.

The information required to offer this function is derived from existing vehicle telemetry that is collected by the vehicle manufacturer. Such information forms a small part of the overall vehicle telemetry that is sent over a cellular connection to the vehicle manufacturer.

A growing number of manufacturers offer ‘remote-control functions’ using a cellular connection, enabling users to perform such functions as enable the heating/air-conditioning, lock or unlock the vehicle, sound the horn, flash the headlamps, check the fuel level or battery charge and effective range, check current location etc. More advanced functions include ‘summoning’ the vehicle, however, these services require a relatively small data exchange between the vehicle and the vehicle manufacturer’s data-center.

Some vehicle manufacturers such as Tesla are using software and firmware update over-the-air. In some cases, these updates are delivered via a cellular connection. In others, WiFi can be used as an alternative delivery method. Anecdotal reports from various driver forums suggest that for Tesla vehicles, the full version updates take place roughly every 6 months, with the version 9.0 update required a download of approximately 1GB. Periodic firmware updates also occur but these are unannounced and are much smaller in size (100-150MB). Over-the-air updates are of significant value to vehicle manufacturers in addressing potential defects or in delivering new capabilities to a vehicle, post-sale. Discussions with a small sample of vehicle manufacturers have identified that some are currently reluctant to use over-the-air updates for anything other than updates to non-safety related software such as infotainment services due to concerns about managing the associated risk.

What is your vehicle reporting?


Vehicle manufacturers are increasingly building their vehicles to be ‘connected’. While some manufacturers gather such information for a limited period of time (typically covering the warranty period) others gather information throughout the lifetime of the vehicle.

BMW collects information including vehicle status information (e.g. mileage, battery voltage, door and hatch status, etc.), position and movement data (e.g. time, position, speed, etc.), vehicle service data (e.g. due date of next service visit, oil level, brake wear, etc.), dynamic traffic information (e.g. traffic jams, obstacles, signs, parking spaces, etc.), environmental information (e.g. temperature, rain, etc.), user profile (personal profile picture/ avatar, settings as navigation, media, communication, driver’s position, climate/light, driver assistance, etc.) and sensor information (e.g. radar, ultrasonic devices, gestures, voice, etc.).

In cases such as a detected fault condition, the information including Diagnostic Trouble Codes (DTC) will be recorded to local storage within the vehicle. This can subsequently be used by service engineers to determine the fault condition that was encountered. Some vehicles will send a summary fault report to the vehicle manufacturer, as well. As more sensors are added to vehicles, not only will vehicle manufacturers gather information about the performance and operation of the vehicle itself but may also gather data generated from the sensors themselves­2. This does not mean that such data is gathered continuously. Vehicle systems may transmit a form of the sensor data in cases of ‘interest’ such as an accident or an unexpected set of telemetry data being recorded. Such information is of interest to not only the vehicle makers but potentially to organisations such as insurance companies.

As one can see from the information collection details, the manufacturers are collecting far more information than just fault conditions. The position and movement information can include details such as braking and acceleration styles. Traction-control indications can help determine road conditions at a location. Some vehicle makers and mapping service providers are starting to use such information to identify roadway hazards such as potholes.

Such services are designed of course, on the premise of having cellular connectivity coverage. However, very few countries are able to provide ubiquitous coverages. A 2017 report noted that the United Kingdom had 91% coverage of national highways but a much lower 58% coverage of non-highway classed roadways. A 2017 report indicates that most major urban areas in the United States have good cellular coverage but with the large geography covered by the US highway system, there are still many locations where cellular services are patchy at best.

From a vehicle manufacturer’s perspective, one cannot rely on universal cellular coverage. As a result, applications need to be designed to operate on the premise that connectivity may or may not be available and therefore vehicle systems need to include the ability to store critical data locally, transmitting valuable information when connectivity is restored.

Data volume today

How much information is the vehicle transmitting to the vehicle manufacturer and when is it taking place? The data volume varies from manufacturer to manufacturer and will also depend on the type and model of the vehicle.

A study performed by ADAC in 2016 identified that the BMW i3 electric vehicle transmits the ‘Last State Call’ automatically every time the driver switches off the car and locks the doors (vehicle is not in motion). This call includes the content of the error memory, battery details including cell temperatures and charge level, the driving mode (eco, eco plus, sport), operational data of the range extender, the mileage at various driving operations, quality of the charging point including malfunctions and the position of the last 16 charging points used.

Key to note that in the BMW case is that some information is obtained while the vehicle is in motion, with other information being collected at the end of the journey. Information provided by OEM A (a Japanese auto-maker) indicates that their personal light vehicles generate a report of ~10-15MB per duty-cycle. This is collected on a monthly basis in an upload over a cellular LTE connection. Information from OEM B (a Japanese auto-maker) indicates a volume of 15-20MB per duty-cycle collected while the vehicle is in operation where the average ‘driven-day’ in Japan is ~90 minutes, equating to a US duty-cycle volume of ~12MB.

Cisco Tutorial and Material, Cisco Certifications, Cisco Learning, Cisco Study Materials, Cisco All Certifications

How does this compare to the typical smartphone users? According to a 2018 report, monthly mobile data traffic per smartphone in North America reached 8.6GB (286MB per day) by the end of 2018.

Cisco Tutorial and Material, Cisco Certifications, Cisco Learning, Cisco Study Materials, Cisco All Certifications

Tuesday, 23 April 2019

Security that works together: Signal Sciences and Cisco Threat Response

Bring real time web application attack data into Threat Response


Signal Sciences is a leading web application security company, with a next-gen web application firewall (WAF) and runtime application self-protection (RASP) solution. Signal Sciences protects over 10,000 applications, with over a trillion production requests per month. Signal Sciences’ patented dual module-agent architecture provides organizations working in a modern development environment with comprehensive, scalable threat protection and security visibility.

In late February 2019, the Signal Sciences team was connected by Cisco Security Business Development with the Cisco Threat Response(CTR) ecosystem group. After an initial conference call about technology and APIs, it was clear the engineers should get together to build something. Using the Swagger documentation and a little guidance on which API endpoints to use, the Signal Sciences crew were able to design, build, test, document and show a functional integration within 10 days. It was demonstrated at Cisco Live Melbourne and RSA Conference, simultaneously in the Signal Sciences and Cisco booths.

Cisco Tutorial and Material, Cisco Guides, Cisco Learning, Cisco Study Materials

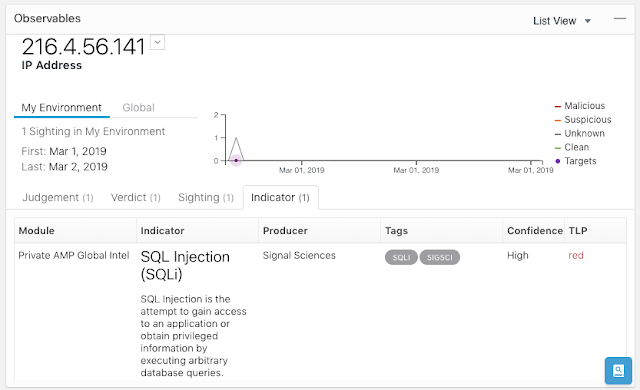
As attacks are detected and blocked, Signal Sciences next-gen (WAF sends relevant attack data to Cisco Threat Response; including IP address, indicators and additional metadata. Within Threat Response a sighting of the offending IP address is created and linked to the indicator, which can then be aggregated with all other sightings across Threat Response.

Cisco Tutorial and Material, Cisco Guides, Cisco Learning, Cisco Study Materials

An incident responder can then open a casebook on the observable and initiate a cross-functional investigation. At the same time, a workflow can be initiated within Threat Response to take any corrective actions needed. If more details are needed, the investigator can jump straight to the event in Signal Sciences from Threat Response at the click of a button.

Cisco Tutorial and Material, Cisco Guides, Cisco Learning, Cisco Study Materials

Through the integration, your Security Operations team will have immediate visibility into attacks across all web application workloads.

With the integration, you can take immediate action, including:

◈ Analyze and correlate event data using context from integrated Cisco Security products and industry leading threat intelligence from Cisco Talos

◈ Open a case to collect and store key investigative information, orchestrate resources for incident response, and manage and document your progress and findings

◈ Take corrective actions in other Cisco products to remediate and address the threats across your security stack by monitoring, filtering, and blocking known attackers

Cisco Tutorial and Material, Cisco Guides, Cisco Learning, Cisco Study Materials

Additionally, when looking at suspicious or blocked requests within Signal Sciences, the incident responder can pivot directly into Threat Response and look up any observables related to the attacker’s source IP address.

Businesses constantly innovate and find new ways to attract, engage, and transact with their customers through web and mobile applications. As a result, a dramatic shift has occurred in how applications are developed and deployed. Now more than ever, security teams need a solution that can protect modern application workloads and provide actionable insights to the professionals responsible for investigating and responding to threats. Cisco Threat Response combined with Signal Sciences next-gen WAF redefines expectations for addressing this challenge.

Monday, 22 April 2019

Trust in IOS XR

Cisco Tutorials and Materials, Cisco Guides, Cisco Certifications

I looked at the hardware Trust Anchor module (TAm) that enhances the security of Cisco Service Provider products and provides visibility into the authenticity and integrity of the platforms. In this blog I will go over the software functionalities in IOS XR that enhance the security posture of the router, defends the router against common attacks, and provides evidence of trust.

Buffer Overflow Protection


A buffer overflow attack involves a common error by developers where the input to an allocated buffer (a memory region) is not validated, and the input overflows the allocated memory. This attack can lead to execution of arbitrary code. A similar attack involves prior knowledge of where critical data is loaded into memory and then targeting that memory location.

IOS XR uses multiple runtime defenses (RTDs) to protect from such errors.

1. W^X (Write XOR Execute): This is a feature in Linux where any page of memory can either be written to or executed but not both. In the scenario where an input overflows the buffer, the overflow data exists in a memory region that can be written to but cannot be used to execute arbitrary malicious code.

2. Address Space Layout Randomization (ASLR): This is a Linux feature wherein the memory locations of running processes are randomized each time. This prevents critical data from always being loaded at the same location in memory, and makes it more difficult for an attacker to launch malicious operations on a specific, well-known memory location.

3. Object Size Checking (OSC): This is a compiler technique used to identify the size of objects, even at compile time for specific types of objects, and then detecting if the data being written will overflow the allocated memory. The compiler will flag such errors at compile time, if the errors can be detected at compile time, or it will add additional instructions to raise exceptions at run time.

4. Safe-C: Many library functions used in C are known to be quite difficult to use safely when it comes to certain memory related operations. Developers working on IOS XR use a safer and secure variant of the library functions, called the Safe-C Library. This provides an alternative to the standard C library calls, where memory accesses, particularly writes to memory locations, are first verified to be within bounds before data in memory is read from or written to. Note that not all modules in IOS XR fully utilize Safe-C libraries due to the maturity of the code base. Critical modules use Safe-C libraries and we migrate to Safe-C libraries in other modules as appropriate.

The above 4 features provide a much safer environment in which to run IOS XR software and mitigate a very common class of security problems.

Integrity Measurement Architecture (IMA)


Cisco hardware-anchored Secure Boot verifies the integrity of the image, including all firmware, to prevent inauthentic or compromised code from booting on a Cisco device. Once a router has booted up, it typically runs for months without a reboot. A malicious actor could get access to the router and tamper a binary at runtime and this would not be detected for a long time. To prevent such tampering of binaries at runtime, we are bringing Linux Integrity Measurement Architecture into IOS XR.

Linux IMA is a kernel security module which checks the integrity of every binary loaded into memory at runtime. Every binary carries a Cisco-issued signature. The Linux kernel validates this signature using Cisco’s Public IMA Certificate that is stored in the hardware-based Trust Anchor module. In the IMA measurement mode, the hashes of all binaries launched are logged into a secure location. In the IMA appraisal mode, if the signature validation fails, the binary will not be allowed to launch. Thus any accidental or malicious modification of a binary at runtime is detected and its execution prevented.  This significantly enhances security and allows the integrity the running software to be verified.

Remote Attestation

We have built a significant number of security controls into our Service Provider product and one of the important aspect of building trust in a product is the ability to verify that the router is in fact doing what it claims to be doing. If an attacker were to tamper the system, the very first action by the attacker will be to remove all evidence of the attack and to present the router as untampered. The only means of verifying the integrity of the router cannot be the router itself.

Remote Attestation will allow the operator to cryptographically verify that the router’s boot keys, boot configuration and all launched software have not been tampered. Cisco’s Trust Anchor supports Remote Attestation functionality where every aspect of the boot up process – starting from the verification of the root of trust and extending throughout the entire secure boot process – as well as the runtime IMA measurements are extended into Platform Configuration Registers (PCRs) in the Trust Anchor. Cisco’s software release process will provide Known Good Value (KGV) hashes for every software, firmware, and key material data shipped with the router.

Once the router is up and running, a verifying party will be able to request an attestation quote from the router. The Trust Anchor hardware can output the audit log and a PCR quote, signs the quote using an Attestation Private Key for that specific router and responds back to the verifying party. The verifying party will be able to use Cisco provided Known Good Value hashes and the Attestation Public Certificate to verify the attested PCR quotes and audit logs. This verification is protected against replay attacks using a nonce, and ensures the attestation is specific to a particular router by using Attestation key pairs that are unique to each router. Thus, one will be able to trust that the router hardware, boot keys, boot configuration and the running software have not been tampered.

Conclusion

Cisco Tutorials and Materials, Cisco Learning, Cisco Certifications

Figure 1 Security Technologies at All Layers

We set a target of fulfilling security requirements at every layer of the Cisco Hardware and IOS XR Network OS. Figure 1 shows the various technologies in use that satisfy these requirements. Cisco’s Trust Anchor provides a foundation of trust for the Next Generation of Security in Service Provider routers that allows service providers to deploy Trusted Platforms, especially when deployed in remote and open locations. The security features in IOS XR software provide a strong defensive environment to run Cisco and Customer applications. Together, the union of Cisco’s Trust Anchor hardware and IOS XR software provide truly Trustworthy Solutions, where the trustworthiness of the system can be measured using Remote Attestation.

As new attacks emerge, Cisco is dedicated to further strengthen security and trustworthy solutions. We are committed to transparency and accountability, acting as a trusted partner to our customers to address evolving security threats.

Saturday, 20 April 2019

Change is the only constant – vPC with Fabric Peering for VXLAN EVPN

Optimize Usage of Available Interfaces, Bandwidth, Connectivity


Dual-homing for endpoints is a common requirement, and many Multi-Chassis Link Aggregation (MC-LAG) solutions were built to address this need. Within the Cisco Nexus portfolio, the virtual Port-Channel (vPC) architecture addressed this need from the very early days of NX-OS. With VXLAN, vPC was enhanced to accommodate the needs for dual-homed endpoints in network overlays.

With EVPN becoming the de-facto standard control-plane for VXLAN, additions to vPC for VXLAN BGP EVPN were required. While the problem space of End-Point Multi-Homing changes, vPC for VXLAN BGP EVPN changes and faces the new requirements and use-cases. The latest innovation in vPC optimizes the usage of the available interfaces, bandwidth and overall connectivity – vPC with Fabric Peering removes the need for dedicating a physical Peer Link and changes how MC-LAG is done. VPC with Fabric Peering is shipping in NX-OS 9.2(3).

Active-Active Forwarding Paths in Layer 2, Default Gateway to Endpoints


At Cisco, we continually innovate on our data center fabric technologies, iterating from traditional Spanning-Tree to virtual Port-Channel (vPC), and from Fabric Path to VXLAN.

Traditional vPC moved infrastructures past the limitations of Spanning-Tree and allow an endpoint to connect to two different physical Cisco Nexus switches using a single logical interface – a virtual Port-Channel interface. Cisco vPC offers an active-active forwarding path not only for Layer 2 but also inherits this paradigm for the first-hop gateway function, providing active-active default gateway to the endpoints. Because of the merged existence of two Cisco Nexus switches, Spanning-Tree does not see any loops, leaving all links active.

Cisco Tutorial and Materials, Cisco Guides, Cisco Learning, Cisco Tutorial and Materials

vPC for VXLAN BGP EVPN


When vPC was expanded to support VXLAN and VXLAN BGP EVPN environments, Anycast VTEP was added. Anycast VTEP is a shared logical entity, represented with a Virtual IP address, across the two vPC member switches. With this minor increment, the vPC behavior itself hasn’t changed. Anycast VTEP integrates the vPC technology into the new technology paradigm of routed networks and overlays. Such an adjustment had been done previously within FabricPath. In that situation, a Virtual Switch ID was used – another approach for a common shared virtual entity represented to the network side.

While vPC to was enhanced to accommodate different network architectures and protocols, the operational workflow for customers remained the same. As a result, vPC was widely adopted within the industry.

With VXLAN BGP EVPN being a combined Layer 2 and Layer 3 network, where both host and prefix routing exists, the need for MAC, IP and prefix state information is required – in short, the exchange of routing information next to MAC and ARP/ND. To relax a hard routing table and the sync between vPC member, a selective condition for routing advertisement was introduced, “advertise-pip”. With the addition of “advertise-pip”, the selective advertisement of BGP EVPN prefix routes was changed and now advertised from the individual vPC member nodes and its Primary IP (PIP) instead of the shared Virtual IP (VIP). This had the result that unnecessary routing traffic was kept off the vPC Peer Link and instead derived directly to the correct vPC member node.

While many enhancements for convergence and traffic optimization went into vPC for VXLAN BGP EVPN, many implicit changes came with additional configuration accommodating the vPC Peer Link; at this point Cisco decided to change this paradigm of using a physical Peer Link.

The vPC Peer Link


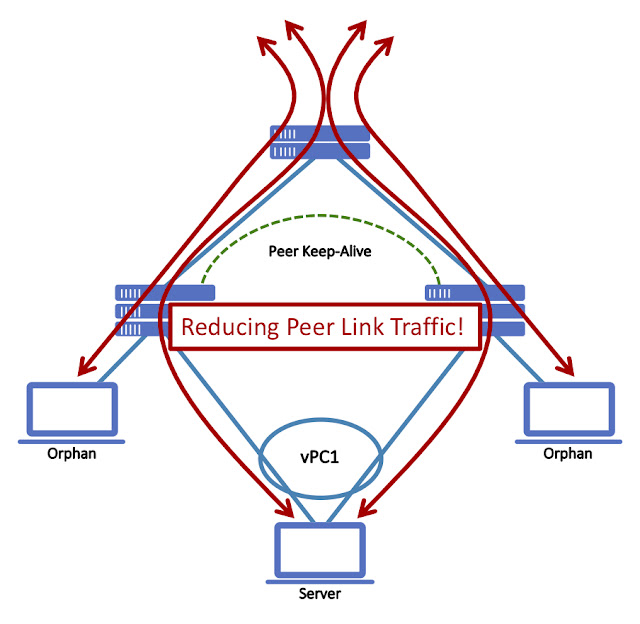
The vPC Peer Link is the binding entity that pairs individual Switches into a vPC domain. This link is used to synchronize the two individual Switches and assists Layer 2 control-plane protocols, like BPDUs or LACP, as it would come from one single Node. In the cases where End-Points are Dual-Homed to both vPC member switches, the Peer Links sole purpose is to synchronize the state information as described before, but in cases of single-connected End-Points, so called Orphans, the vPC Peer Link can still potentially carry traffic.

With VXLAN BGP EVPN, the Peer Link was required to support additional duties and provided additional signalization when Multicast-based Underlays were used. Further, the vPC Peer Link was used as a backup routing instance in the case of an extended uplink failure towards the Spines or for the per-VRF routing information exchange for orphan networks.

With all these various requirements, it was a given requirement for making the vPC Peer Link resilient, with Cisco’s recommendation to have at least two or more physical interfaces dedicated for this role.

The aim to simplify topologies and the unique capability of the Cisco Nexus 9000 CloudScale ASICs led to the removal of the physical vPC Peer Link requirement. This freed at least two physical interfaces, increasing interface capacity by nearly 5%.

Cisco Tutorial and Materials, Cisco Guides, Cisco Learning, Cisco Tutorial and Materials

vPC with Fabric Peering


While changes and adjustment to an existing architecture can always be made, sometimes a more dramatical shift has to be considered. When vPC with Fabric Peering was initially discussed, the removal of the physical vPC Peer Link was the objective but rapidly other improvements came to mind. As such, vPC with Fabric Peering follows a different forwarding paradigm by keeping the operational consistency for vPC intact. The following four sections cover the key architecture principals for vPC with Fabric Peering.

Keep existing vPC Features

As we enhanecd vPC with Fabric Peering, we wanted to ensure that existing features are not being affected. Special focus was added to ensure the availability of Border Leaf functionality with external routing peering, VXLAN OAM and Tenant Routed Multicast (TRM).

Benefits to your Network Design

Every interface has a cost and so every Gigabyte counts. By relaxing the physical vPC Peer Link, we not only achieve architecture fidelity but also return interface and optical cost as well as optimizing the available bandwidth.

Leveraging Leaf/Spine topologies and respective N-way Spines, the available path between any 2 Leafs becomes ECMP and as such, a potential candidate for the vPC Fabric Peering. With all Spines now sharing VXLAN BGP EVPN Leaf to Leaf or East-to-West communication and vPC Fabric Peering, the overall use of provisioned bandwidth becomes more optimized. Given that all links are shared, the increased resiliency for the vPC Peer Link is equal to the resiliency of Leaf to Spine connectivity. This is a significant increase compared to the two physical direct links between two vPC members.

With the infrastructure between the vPC members now shared, the proper classification of vPC Peer Link vs. general fabric payload has to be considered. In foresight of this, the vPC Fabric Peering has the ability to be classified with a high DSCP marking to ensure in-time delivery.

Cisco Tutorial and Materials, Cisco Guides, Cisco Learning, Cisco Tutorial and Materials

Overview: vPC with Fabric Peering

Another important cornerstone of vPC was the Peer Keep Alive functionality. vPC with Fabric Peering keeps the important failsafe functions in place but relaxes the requirement of using a separate physical link. The vPC Peer Keep Alive can now be over the Spine infrastructure in parallel to the virtual Peer Link. As an alternative and to increase the resiliency, the vPC Peer Keep Alive can still be deployed over the out-of-band management network or any other routed network of choice between the vPC member nodes.

In addition to the vPC Peer Keep Alive, the tracking of the uplinks towards the Spines has been introduced to more deterministically understand the topology. As such the uplink tracking will create a dependency on the vPC primary function and respectively switch the operational primary role depending on the vPC members availability in the fabric.

Focus on individual VTEP behavior

The primary use-case for vPC has always been for dual-homed End-Points. However, with this approach, single attached End-Points (orphans) were treated like 2nd class citizen where the vPC Peer Link allowed reachability.

When vPC with Fabric Peering was designed, unnecessary traffic over the “virtual” Peer Link should be avoided by any means and also the need for per-VRF peering over the same.

With this decision, orphan End-Points become a 1st class citizen similar as dual-homed End-Points are and the exchange of routing information should be done through BGP EVPN instead of per-VRF peering.

Cisco Tutorial and Materials, Cisco Guides, Cisco Learning, Cisco Tutorial and Materials

Traffic Flow Optimization for vPC and Orphan Host

When using vPC with Fabric Peering, orphan End-Points and networks connected to individual vPC member are advertised from the VTEPs Primary IP address aka PIP; in vPC with physical Peer Link it would always use the Virtual IP (VIP). With the PIP approach, the forwarding decision from and to this orphan End-Point/network will be resolved as part of the BGP EVPN control-plane and forwarded with VXLAN data-plane. The forwarding paradigm of these orphan End/Point/network is the same as it would be with an individual VTEP; the dependency on the vPC Peer Link has been removed. As an additional benefit, consistent forwarding is archived for orphan End-Point/Network connected to an individual VTEP or a vPC domain with Fabric Peering. You could consider that vPC member node existing in vPC with Fabric Peering behaves primarily as an individual VTEP or “always-PIP” for orphan MAC/IP or IP Prefixes.

vPC where vPC is needed

With the paradigm shift to primarily operate an individual vPC member node as a standalone VTEP, the dual-homing functionality has to only be given to specific attachment circuits. As such, the functionality of vPC only comes into play when the vPC keyword has been used on the attachment circuit. In the case for vPC attachment, the End-Point advertisement would be originated with the Virtual IP Address (VIP) of the Anycast VTEP. Leveraging this shared VIP, routed redundancy from the fabric side is achieved with extremely fast ECMP failover times.

In the case of traditional vPC, the vPC Peer Link was also used during failure cases of an End-Points dual attachment. As the advertisement of a previous dual-attached End-Point doesn’t change from VIP to PIP during failures, the need for a Peer Link equivalent function is required. In the case traffic follows the VIP and get hashed towards the wrong vPC member node, the one with the failed link, the respective vPC member node will bounce the traffic the other vPC member.

Cisco Tutorial and Materials, Cisco Guides, Cisco Learning, Cisco Tutorial and Materials

Traffic redirected in vPC failure cases

vPC with Fabric Peering is shipping as per NX-OS 9.2(3)

Benefits


These enhancements have been delivered without impacting existing vPC features and functionality in lock-step with the same scale and sub-second convergence as existing vPC deployments achieved.

While the addition of new features and functions is simple, having an easy migration path is fundamental to deployment. Knowing this, the impact considerations for upgrades, side grades or migration remains paramount – and changing from vPC Peer Link to vPC Fabric Peering can be easily performed.

vPC with Fabric Peering was primarily designed for VXLAN BGP EVPN networks and is shipping in NX-OS 9.2(3). Even so, this architecture can be equally applied to most vPC environment, as long as routed Leaf/Spine topology exists.

Cisco Tutorial and Materials, Cisco Guides, Cisco Learning, Cisco Tutorial and Materials

Friday, 19 April 2019

Using Tetration for Application Security and Policy Enforcement

Protecting assets requires a Defense in Depth approach


Protecting assets within the enterprise requires the network manager to adopt automated methods of implementing policy on endpoints. A defense in depth approach, applying a consistent policy to the traditional firewall as well as policy enforcement on the host, takes a systemic view of the network.

Value added resellers are increasingly helping customers deploy solutions comprised of vendor hardware and software, support for open source software, and developing code which integrates these components. A great example of this, and the subject of this blog, is World Wide Technology making its integration with Ansible Tower and Cisco Tetration available as open source through Cisco DevNet Code Exchange.

I started my career in programming and analysis and systems administration, transitioned to network engineering, and now the projects I find most interesting require a combination of all those skills. Network engineers must view the network in a much broader scope, a software system that generates telemetry, analyzes it, and uses automation to implement policy to secure applications and endpoints.

The theme for Networkers/CiscoLive 1995 was ‘Any to Any.’ However, we don’t live in that world today. Then, the focus was to enable communication between nodes. Today, the focus is to enable network segmentation, restricting communication between nodes for legitimate business purposes. Today we ask, “What’s on my network?” “What is it doing?” and “Should it be?”

A Zero Trust security model, in the data center and on the endpoint, is a common topic for discussion for our customers. The traditional perimeter security model is less effective as cyber security attacks simply bypass firewalls and attack internal assets with phishing exploits. The Tetration Network Policy Publisher is one means to automate policy creation.

Tetration Network Policy Publisher


Introduced in April 2018, the Tetration Network Policy Publisher is an advanced feature enabling third parties to subscribe to the same policy applied to servers by the Tetration enforcement agent.

The Tetration cluster runs a Kafka instance and publishes the enforcement policies to a message bus. Unlike other message bus technologies, Kafka clients explicitly ‘ask’ for messages, by subscribing to a Kafka topic. Access to the policy is provided by downloading the Kafka client certificates from the Tetration user interface.

The enforcement policy messages are encoded as Google Protocol Buffers (protobuf), an efficient and extensible format for exchanging structured data between hosts. While more complex for the programmer, protobufs are both efficient on the wire and CPU compared to JSON or XML.
This feature enables ‘defense in depth’. The enforcement policy can be converted to the appropriate network appliance configuration and implemented on firewalls, router access lists, and security enabled load balancers. Ansible is one means to automate pushing policy to network assets.

Ansible Tower by Red Hat


Ansible Tower is a web-based solution which makes Ansible Engine easier to use across teams within an IT enterprise. Tower includes a REST API and CLI for ease of integration with existing tools and processes. Ansible Engine is built on the open source Ansible project. Red Hat licenses and provides support services for Ansible Tower and Engine.

Ansible has evolved into the defacto automation solution for configuration management across a wide range of compute, storage, network, firewall and load balancer resources in the cloud and on-premise.

Ansible interface to Cisco Tetration Network Policy Publisher


This project provides an abstraction layer between the Tetration Network Policy Publisher and Ansible, allowing the network administrator to push enforcement policy to ‘all the things’, without directly accessing the Tetration Kafka message bus. The code is open source and is publicly available through Cisco DevNet Code Exchange, a curated set of repos that make it easy to discover and use code related to Cisco technologies. The project repository, ansible-tetration, includes an Ansible module that retrieves enforcement policy from Tetration and exposes it as variables to an Ansible playbook. Subsequent tasks within the playbook can apply the policy to the configuration of network devices.

This functionality provides value to network operations as policy is published periodically, in an easily consumed format. NetDevOps engineers can focus on implementing policy without the need to understand the complexity of creating the policy.

Figure 1 illustrates the components of this solution.

Cisco Tutorial and Material, Cisco Guides, Cisco Learning, Cisco Study Materials

Figure 1- Ansible interface to Cisco Tetration Network Policy Publisher

Links to additional resources of this project are available on Code Exchange.

Simplify the Complex


Within IT operations, forming NetDevOps teams to integrate disparate systems is the model for high-performance organizations. While encouraging each team member to have general level of understanding of the organization’s goals, it is also important to include specialists in a technology, to leverage their deep experience in one area to increase the velocity of the team.
The project goal is to expose policy generated by Tetration in a simple format a network operator can use to enable defense in depth within their datacenter.

Figure 2 illustrates how the Python module tetration_network_policy, can be included in an Ansible playbook, retrieve a security policy and register the results as a variable.

Cisco Tutorial and Material, Cisco Guides, Cisco Learning, Cisco Study Materials

Figure 2- Tetration Network Policy task

In this example, the variable tnp contains the Tetration Network Policy (inventory_filters, intents, tenant name and catch_all policy) for the requested Kafka topic. Subsequent tasks can reference these values and apply the security policy to network devices.

Figure 3 illustrates the contents of variable tnp, which will be used to generate access control lists on an ASA firewall.

Cisco Tutorial and Material, Cisco Guides, Cisco Learning, Cisco Study Materials

Figure 3- Sample JSON formatted network policy

By exposing the policy to an Ansible playbook, the data can be easily reformatted to a traditional CLI configuration and applied to a firewall, load balancer or Cisco ACI fabric.

Use Case: Apply Policy to ASA Firewalls


Now that the network policy has been retrieved and loaded to a variable within the playbook, it can used to configure a network device. In this example, the target device is a Cisco ASA firewall.
By invoking the Ansible module asa_config, the network policy is used to create the appropriate CLI commands and apply them to one or more firewalls defined in the inventory.

Figure 4 illustrates the playbook syntax.

Cisco Tutorial and Material, Cisco Guides, Cisco Learning, Cisco Study Materials

Figure 4 – Ansible module asa_config

Following the execution of the playbook, the sample JSON formatted network policy is present in the firewall configuration, as shown in Figure 5.

Cisco Tutorial and Material, Cisco Guides, Cisco Learning, Cisco Study Materials

Figure 5 – ASA configuration

Note: Because SNMP is a well know port, the ASA CLI has substituted SNMP to reference port 161.

Thursday, 18 April 2019

Serverless in the Datacenter: FaaS on K8s at DevNet Create

If you’ve ever wanted to learn the fundamentals of serverless and get your hands dirty building a LAMP-like application, DevNet Create has a session for you. On both April 24 and April 25 from 11:45a to 12:30p, I’ll be running an exercise entitled “FONK: FaaS on K8s working examples.” During our 45 minutes together, we’ll build a serverless version of the Guestbook application, which is the “Hello World” of the Kubernetes (K8s) community. Only instead of using containers directly the way that the original Guestbook does, we’ll use a Function-as-a-Service (FaaS) runtime, an Object Storage service, and a NoSQL server all running on top of K8s.

What is FaaS on K8s?


Developers need some platform providing them with compute resources in digestible bites when designing applications. Simply put, a Function-as-a-Service (FaaS) runtime (such as AWS Lambda or Azure Functions) is to serverless application architecture as a container runtime is to a microservices architecture. A container runtime takes care of things like autoscaling, rolling updates, and name resolution of different services running within it. A FaaS runtime obscures details of the underlying container runtime that most use under the hood and provide developers with a cleaner experience that enables them to focus on their own business logic.

During the session, we’ll discuss the six most popular FaaS runtimes that run on top of K8s so that you can run serverless applications in your own datacenter instead of in the public cloud. The featured labs will let you get your hands on two of them: OpenFaaS and OpenWhisk.

The Environment We’ll Be Using


I’ll be spending my evening on April 23 using a DevNet Sandbox to set up the following environment for you:

Cisco Tutorial and Material, Cisco Certifications, Cisco Learning, Cisco Guides

Each student will get a K8s cluster pre-configured with not only OpenWhisk and OpenFaaS runtimes but also an Object Storage service via Minio and a NoSQL server via MongoDB. An additional VM will be provided and preloaded with all the command line tools we’ll need to build an application as well. What does a web application look like when using this FONK design pattern?

Our End Goal: The FONK Guestbook


Instead of the traditional K8s Guestbook that uses three services and six persistent containers:

Cisco Tutorial and Material, Cisco Certifications, Cisco Learning, Cisco Guides

we’ll instead use the FONK design pattern to build its serverless equivalent:

Cisco Tutorial and Material, Cisco Certifications, Cisco Learning, Cisco Guides

Minio will host our static HTML and Javascript files. Upon being loaded into a browser, the Javascript will make REST API calls to the API gateway provided by our FaaS runtime to launch functions on demand. When loaded into memory as needed, those functions will perform read and write operations from and to our MongoDB. The Javascript will then alter our HTML in the browser to reflect the changes to our user.

Wednesday, 17 April 2019

Cryptographic Visibility: Quality Encryption at Your Fingertips

Cisco Tutorial and Material, Cisco Guides, Cisco Learning, Cisco Certifications

There is only one thing more important than the right answer, and that is asking the right question. I have spent my entire career doing security analytics and all of the useful analytics I have ever delivered to the market have been grounded in asking the right questions. With that in mind, I’d like to start this blog by asking you this:

How much of your digital business is transmitted in the clear versus encrypted and how would you assess the quality of that encryption?


I’ve spoken on Encrypted Traffic Analytics where most of the storyline is about detecting malicious traffic without having to perform decryption. However, that same telemetry used for malware detection can also be leveraged to answer those questions I posed to you above. With the release of Stealthwatch 7.0 and the new Cryptographic Audit App, I’m excited to take this opportunity to talk about features that can provide you near real-time visibility on the state of your network encryption.

Twenty years ago, you needed to be a network expert to bring up a cryptographic tunnel between endpoints or between networks. Today, most people don’t even know they are safely transmitting over strong cryptographic tunnels. Every time you type in https:// or the browser defaults to this, you make use of the Transport Layer Security (TLS) protocol, which makes your conversation safe and secure over even the most hostile networks. The ability to do something that once required deep knowledge and a thorough understanding of network architectures is now something most of us do on a daily basis without giving it so much as a second thought. It is truly amazing to me how far we have come since the birth of the Internet.

When network telemetry was first invented, the analytical outcomes were focused on questions like “Can host-A reach server-B?” Availability and network performance were the key objectives of the time, so telemetry like Netflow and IPFIX were the appropriate metadata needed to achieve these goals. Fast forward to today, where the digital business would also like to know “Is the connection between host-A and server-B secure?” In order to achieve this, Cisco had to innovate and developed an extension to NetFlow known as Encrypted Traffic Analytics telemetry, which Stealthwatch can analyze for you to give you the cryptographic visibility you need to govern your network security policies.


Cisco Tutorial and Material, Cisco Guides, Cisco Learning, Cisco Certifications

While it might not be obvious at first glance, the Cisco routers and switches are delivering telemetry, shown in the Sample Cryptographic Audit above, reporting critical metadata like the version of Transport Layer Security (TLS) being used, the Cipher Suites, and Key Lengths, all of which show what is happening across your digital business. For those of you who fall under PCI Compliance, you now have a way to provide evidence that for your PCI assets, you are running TLS version 1.1 or higher, as running TLS 1.0 would be a violation as of June 2018. Better still, after you clean things up, you can also setup alerts anytime something within PCI scope violates this policy – how awesome is that!

Let’s face it, TLS is the new TCP (Transmission Control Protocol). Having been at this for more than 25 years, I celebrate the fact that more than 90% of all network traffic these days is safely secured by cryptography. New versions of TLS get better, faster, and stronger which is awesome. While we throw a party for this achievement, lets also make sure we have systems in place to help us be vigilant and verify that what we intend to have happen is actually happening.

So, when it comes to the question of “How much of your digital business is transmitted in the clear versus encrypted and how would you assess the quality of that encryption,” Stealthwatch can provide you with an answer. With Stealthwatch 7.0, when your network tells you all this useful metadata, you can have a minute-by-minute status on your network visibility along with telemetry reports on critical metadata which now includes cryptographic details!