Saturday, 13 July 2019

Discover Hidden Risks in Your Network Before It’s Too Late

Consider for a second how you think about your vehicle’s maintenance. If you’re like the majority, you might drive your car every day and feel confident that you can get from place to place without scheduling a routine checkup every 5000 miles, as automotive experts suggest. You might wait for a signal to prompt that something is wrong, whether it’s a check engine light, tire pressure warning, etc. to take your car in to get serviced. And then it’s back to getting from point A to point B every time you step in your vehicle. The problem is, all the buttons and warning signs inside your vehicle can signal that everything is ok, but they don’t necessary provide information on the health of all the underlying parts.

Driving as if everything is ok without performing routine checkups is a lot like monitoring your network without rigorously evaluating it on a consistent basis. Just as parts of your car can deteriorate or break without your knowledge, network support and capacity thresholds are often broken from incremental requirement burdens that the network has to shoulder. This results in teams consistently performing corrective network maintenance, costing more and creating longer downtimes in the long run. In fact, results show that “preventative maintenance represents roughly 10-30 percent of total maintenance costs as compared to corrective maintenance.”

So, what can you do?


One idea is to set some time aside – either once or twice a year – and perform a thorough network audit. It may seem mundane and unappealing at first but think about the potential value it could bring your team (and the organization) if you found a major problem or gap ahead of time. For example, what if you were upgrading to high-resolution video but found that the network was experiencing consistent packet drops? Or what if you were deploying a new unified communications solution but found your network’s Quality of Service (QoS) was never revisited for real-time voice and video applications 7-8 years after it was first deployed?

Cisco Study Materials, Cisco Learning, Cisco Online Exam, Cisco Tutorials and Material

How would packet drops affect your network before a new deployment?

Would you catch them in time?

IT organizations that routinely do this before a new deployment or cloud migration often find the most value and are able to get buy-in from other critical stakeholders, such as those in finance and upper management, for future change initiatives. They are able to articulate the severity of repercussions if something goes wrong, which can often include an “all-hands-on-deck” situation for IT and extra costs incurred for the whole company.

Another benefit is that audits help bridge a gap between executives and IT. An audit creates a foundational platform in which both parties can understand what’s most important through an objective report. This has often served as a catalyst for IT departments to get projects approved as they are able to finally provide credibility and evidence for specific recommendations that had initially been declined for not being “a priority” or for being “too complex” of a solution.

If you’re interested in trying this yourself, take three of your sites and at least one data center and simulate what the network traffic would be with your new collaboration solution. Monitor the key parameters (e.g. jitter, delay, packet loss, etc.), the bandwidth difference, and how the network’s load-balancing changes throughout the session. Then perform a risk analysis with your findings, which can include:

◈ A list of gaps, problems, and likely future issues
◈ An as-is scenario that highlights the likelihood and magnitude of associated risks
◈ A list of necessary and recommended upgrades
◈ Predicted cost, timing, and impact of upgrades
◈ Expected deployment date after upgrades are made

The goal is to spot areas that have been overlooked and to identify key drivers that could negatively impact future upgrades and solutions.

If you’re open to having an external party help you do this, Cisco has a couple audit options that might benefit you, including a:

Cloud Collaboration Readiness Assessment
Media Network Readiness Assessment (for video and Webex deployments)
Network Readiness Assessment (for UC and Contact Center deployments)

Cisco Study Materials, Cisco Learning, Cisco Online Exam, Cisco Tutorials and Material

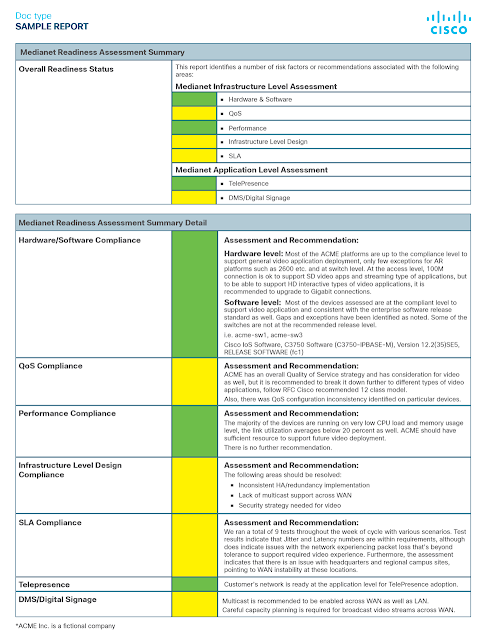
Each Readiness Assessment consists of a detailed analysis of your foundational network (critical Layers 1-3), including security and compliance, so you can easily upgrade your collaboration technology without hassle or fear. Each assessment also addresses reliability requirements and validates your network’s capacity to deliver desired business outcomes, helping you understand the implications and repercussions of different options before you deploy or migrate. To help provide some context, let’s look at a quick example.

Last year, a global leader in consumer and business credit reporting wanted to upgrade its Contact Center solution and agreed to have a Network Readiness Assessment beforehand so it could properly address any concerns. The IT department initially resisted the idea but later agreed, noting:

◈ All bandwidth requirements had been met

◈ The network was highly redundant and had no known issues

◈ IP routing was in good shape

After identifying eight sites and two data centers to perform the assessment on, the Cisco Customer Experience team installed its proprietary software and simultaneously set up a network probe at each of the eight sites to simulate real time RTP traffic. It found:

◈ The IP routing between the eight key sites was not configured properly and the convergence time was too high, causing network packet drops
◈ The bandwidth was not configured properly to handle the amount of traffic to be deployed
◈ The QoS and network policies were outdated and needed to be updated before the upgrade

Ultimately, without the assessment the customer’s network would have likely crashed with the new deployment, costing millions and requiring all IT personnel to immediately fix the problem.

Turning your department from a reactive standpoint to a proactive one can help you better anticipate outcomes and problems before they occur. If you’re thinking about conducting a network audit on your own for your next collaboration upgrade, consider what resources you need to create a good report and the questions you’ll need to ask yourself along the way. What would have to be true in my audit in order to convince management to think differently? How do I ensure that my results are accurate and that I have the right data to back up my findings? How do I get others involved to create buy-in and to not upset those who would be impacted?

Cisco Study Materials, Cisco Learning, Cisco Online Exam, Cisco Tutorials and Material

A good practice is to assume there’s already something wrong

in your network. Doing so will help give you the drive to ensure that

each possible risk is rigorously evaluated.

Learning what could prevent future success is arguably just as important as understanding what facilitates it in the first place.

Thursday, 11 July 2019

Orchestration and Automation Solutions for the 5G Era

We looked at how Cisco can help service providers (SPs) deliver high-quality 5G solutions to their enterprise customers.

Cisco Study Materials, Cisco Learning, Cisco Tutorials and Materials

We now continue the story by focusing on two important 5G-network enablers: automation and orchestration.

In the light of today’s changing market trends, this blog briefly reviews some key Cisco orchestration solutions, illustrating their benefits via case studies.

Preparing for an accelerating world

If the 4G network was all about smartphones and consumer data, 5G is more about addressing the strict demands of vertical markets with the expectation of improved quality of experience (QoE) and application performance resulting in rapidly changing business models and customer behaviour.

Product cycles and new, more agile companies are disrupting markets. Savvy customers expect services to be available on demand, from anywhere, at the touch of a button. And technologies such as cloud services, virtualisation/containerisation and intent based networking (IBN) are enabling new commercial opportunities.

All of these developments demand more powerful and flexible network orchestration and automation solutions. But what are the business benefits for SPs?

To give just some examples, Cisco orchestration can reduce configuration and support costs, enable SPs to offer more innovative services quicker with shorter TTM (Time-to-Market), and help them build new revenue streams.

Managing tomorrow’s 5G network traffic

Let’s take a look at two Cisco automation solutions that SPs can use to manage next-generation networks.

Cisco Network Services Orchestrator (NSO) seamlessly configures, automates and provisions end-to-end services across traditional and virtualised networks with Cisco and 3rd Party products. It can add, change and delete services without disrupting the overall service, and help ensure that services are delivered in real time.

NSO 5 is the latest release. It’s a key part of Cisco’s Evolved Services Platform (ESP), which benefits from being:

• Open – multi-vendor and based on open standards and API.
• Extensible – its modules span the full SP architecture (cloud, video, mobile and fixed).
• Elastic – it seamlessly scales services and resources, whenever and wherever needed.

This industry-leading software offers a significant five-year ROI of 383 per cent.1

Cisco Crosswork is the newer suite of automation and orchestration solutions that can enable SPs to proactively manage end-to-end networks. This includes:

• Cisco Crosswork SON Suite – an automation solution concerning the self organising of the radio access network (RAN) that enables companies to reduce operating costs while improving the end-user experience.

• Cisco Crosswork Network Insights – a cloud service that analyses routing and network data to reduce the time taken to fix issues.

• Cisco WAN Automation Engine (WAE) – a solution that offers precise network modelling and optimisation of network traffic across the Wide Area Network (WAN).

Cisco Crosswork is a truly scalable orchestration solution for the new era of 5G networks.

Cisco orchestration and automation in action

Many companies are partnering with Cisco on 5G projects to reap the benefits of automation and orchestration solutions. Here are three examples.

VodafoneZiggo runs with RAN automation


Netherlands operator, VodafoneZiggo, wanted to automate its radio access network (RAN) for the 5G era, so it deployed a Cisco Crosswork SONFlex solution. The solution works in a multi-vendor environment, enabling the company to reduce the cost-per-bit while improving its overall customer experience with superior voice quality.

Cisco Study Materials, Cisco Learning, Cisco Tutorials and Materials

This move marks a new milestone for VodafoneZiggo. The company’s automation strategy has now shifted from traditional network-focused optimisation to customer-centric, self-organising network (SON)-based automation solutions.

As Matthias Sauder, VodafoneZiggo’s Director, Mobile Networks commented: ‘With Cisco SONFlex, we are now in a position to manage increasing network complexity with 5G on the horizon, improve operational efficiency, and gain greater autonomy to develop a unique automation strategy.’

Rakuten Mobile Network launches the first fully virtualised network


Another mobile network operator, Rakuten Mobile Network (RMN), plan to launch its services in Japan, late 2019, with a 5G architecture that will disrupt the telecom industry globally.

This will be the world’s first cloud-based network that’s fully virtualised the RAN and Core components, with end-to-end automation for both the network and services. RMN will deliver services from consumer mobile, narrowband IoT and rich media, to low-latency services that include augmented and virtual reality (AR/VR).

Cisco NSO enables full end-to-end automation along with the element management system (EMS) and operations support systems (OSS). It helps reduce OpEx and, compared to traditional operators, greatly reduces the need for people to deploy and operate the network. It also minimises human error.

As Tareq Amin, CTO of Rakuten Mobile Network Inc., commented: ‘Our services will benefit from a unique computing infrastructure that enables the best possible user experience.’

Orange invests in Cisco automation


Innovative service provider, Orange, is also planning to deploy the Cisco NSO software platform to its network. The company wants to be able to programme its infrastructure while automating its method-of-procedure operations and customer-facing services.

This will enable Orange to cut service activation times from days to hours, automate its service lifecycles and remove the risk of human error.

Christian Gacon, VP of Wireline Networks and Infrastructure at Orange, said: ‘Cisco’s model-driven approach to network automation and service orchestration is enabling Orange to drastically speed up delivery of services across our entire lifecycles.’

The solution will also enable Orange to continue delivering superior customer services without disruption.

Cisco trusted solutions are ready to orchestrate today’s increasingly complex networks, simplifying management, cutting costs and, above all, offering outstanding services to end-users.

Wednesday, 10 July 2019

Enterprise Streaming Telemetry and You: Getting Started with Model Driven Telemetry

Why Streaming Telemetry?


Cisco IOS XE is the Network Operating System for the Enterprise. It runs on switches like the Catalyst 9000, routers like the ASR 1000, CSR1000v, and ISR 1000 and 4000’s, Catalyst 9800 Wireless LAN controllers, as well as a few other devices in IoT and Cable product lines. Since the IOS XE 16.6 release there has been support for model driven telemetry, which provides network operators with additional options for getting information from their network.

Traditionally SNMP has been highly successful for monitoring enterprise networks, but it has limitations: unreliable transport, inconsistent encoding between versions, limited filtering and data retrieval options, as well as the impact to the CPU and memory of the running device when multiple Network Monitoring Solutions poll the device simultaneously. Model-Driven Telemetry addresses many of the shortfalls of legacy monitoring capabilities and provides an additional interface in which telemetry is now available to be published from.

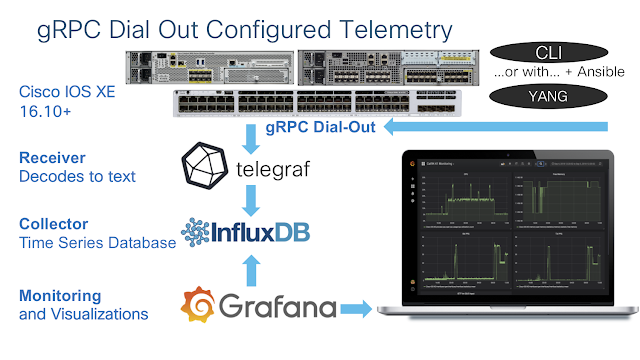
Yes, this is a push based feature. No longer do we need to poll the device and ask for operational state. Now we just decide what data we need, how often we need it, and where to send it. Once the configuration is in place the device happily publishes the telemetry data out to the 3rd party collectors, your monitoring tools, big data search and visualization engines like Splunk and Elastic, or even to a simple text file – it’s totally configurable what you do with the data. In the example below we use Telegraf + InfluxDB + Grafana to receive, store, and visualize the data.

Cisco Study Materials, Cisco Tutorials and Materials, Dell EMC Materials, Cisco Guides, Cisco Learning

Once common use case is to monitor the CPU utilization of a device. Let’s understand where and how we can get this data from our Cisco Catalyst 9300 running IOS XE 16.10

YANG Models


YANG Models are at the heart of Model-Driven Telemetry: Yet Another Next Generation! These human-readable text-based models define the data that is available not just telemetry publication but also for programmatic configuration as well. These data models reside within the IOS XE device and can easily be downloaded when using tooling like YANG-Explorer. All of the models are also published on the YangModels Github page which makes them easy to access and analyze.

The YANG-explorer tooling is available on the CiscoDevNet Github page which can download the YANG models directly from the IOS XE device over the NETCONF or RESTCONF interfaces and quickly show which data is available and from which model.

Cisco Study Materials, Cisco Tutorials and Materials, Dell EMC Materials, Cisco Guides, Cisco Learning

This example from the YANG Explorer shows that we have already downloaded and loaded the Cisco-IOS-XE-process-cpu-oper.yang model and began to explore it. It shows that the one-minute, five-minute, and 5-second “Busy CPU-Utilization” is available as a percent, as well as the Interrupt 5-second (five-second-intr) metric. It also shows some metadata about the model that includes the XPath, Prefix, Namespace, and a description with some other details.

Cisco IOS XE MDT Configuration


Now that we know which YANG data model contains the needed information let’s enable sending this telemetry from the device.

It is possible to configure and verify telemetry subscriptions from the traditional CLI as well as through the NETCONF, RESTCONF, and gNMI programmatic interfaces using YANG. When using CLI the show commands are available with the ‘show telemetry ietf’ set of commands, and is configured similarly with ‘telemetry ietf’ commands when in configure mode. When using YANG, the “Cisco-IOS-XE-mdt-cfg.yang” and “Cisco-IOS-XE-mdt-oper.yang” YANG models are available for both configuration and operational datasets.

Lets look at a configuration example from a Catalyst 9300 switch running Cisco IOS XE 16.10 This configuration enables telemetry subscription ID 501 and encoding is set to “kvgbp” which is a self describing JSON key-value pare Google Protocol Buffers format. The data that we want sent is defined by the filter xpath and we used YANG Explorer and the YANG models earlier to find it. The xpath filter prefix for the Cisco-IOS-XE-process-cpu-oper.yang model is “process-cpu-ios-xe-oper.yang”, and the specific datapoint or KPI we want is the 5-second CPU Utilization. The source address and source VRF are set so that the device knows which port or interface to send telemetry from. The update policy is set in centiseconds so every 5 seconds (500 centiseconds) the device will publish an update. Finally, the IP and port that the receiver is listening on is set, as well as the to use gRPC over TCP as the protocol.

Cat9300# show run | sec tel
telemetry ietf subscription 501
 encoding encode-kvgpb
 filter xpath /process-cpu-ios-xe-oper:cpu-usage/cpu-utilization/five-seconds
 source-address 10.60.0.19
 source-vrf Mgmt-vrf
 stream yang-push
 update-policy periodic 500
 receiver ip address 10.12.252.224 57000 protocol grpc-tcp

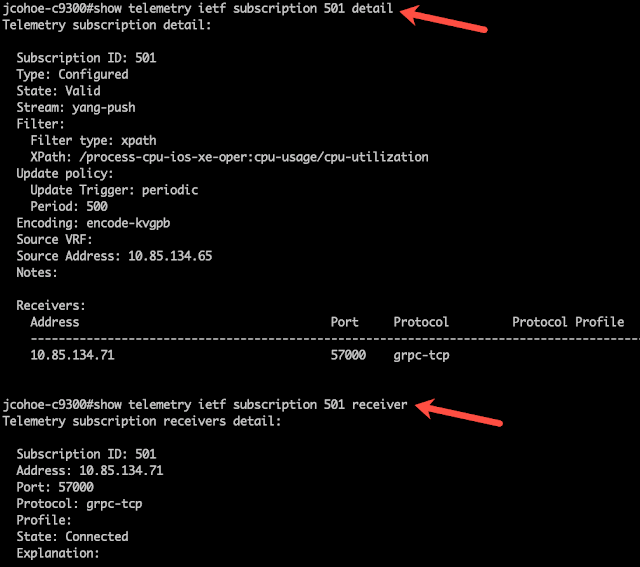
Let’s see what this looks like with some of the show commands: ‘show telemetry ietf subscription 501 detail’ and ‘show telemetry ietf subscription 501 receiver’:

Cisco Study Materials, Cisco Tutorials and Materials, Dell EMC Materials, Cisco Guides, Cisco Learning

The output shows that the CPU Utilization XPath has been set and that the telemetry receiver has connected successfully.

Telemetry Receiver


The open source software stack that allows easy reception, decoding, and processing of the “kvgbp” telemetry is referred to as the TIG stack. TIG represents three separate software components: Telegraf which receives the telemetry data, InfluxDB which stores it, and Grafana which is responsible for visualizations and alerting.

Telegraf has the “cisco_telemetry_mdt” input plugin that receives and decodes the gRPC payloads that the IOS XE device sends. It also has an output plugin that sends this data into the InfluxDB where it is stored. The configuration for Telegraf is simple and static because once it’s setup it rarely needs to be reconfigured or modified. Simply define a few global parameters, the input, the output, and then start the telegraf binary or daemon process.

In this example we configure the gRPC input listener on port 57000 – this is the port that IOS XE will publish telemetry to. We have also configured where to send the data out to: InfluxDB running on the localhost, port 8086, as well as the database, username, and password to use for the data base storage.

# telegraf.conf
# Global Agent Configuration
[agent]
hostname = "telemetry-container"
flush_interval = "15s"
interval = "15s"

# gRPC Dial-Out Telemetry Listener
[[inputs.cisco_telemetry_mdt]]
transport = "grpc-dialout"
service_address = ":57000"

# Output Plugin InfluxDB
[[outputs.influxdb]]
database = "telegraf"
urls = [ "http://127.0.0.1:8086" ]
username = "telegraf"
password = "your-influxdb-password-here"

InfluxDB and Grafana can run inside Docker containers or natively on Linux, and there is excellent getting started documentation on the official InfluxDB and Grafana websites. I recommend following the official guides in order to setup InfluxDB and Grafana in your environment as needed.

Visualization with Grafana


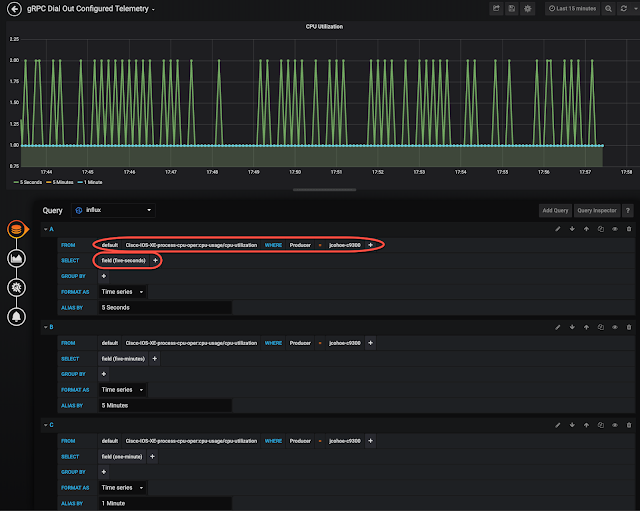
Grafana is the visualization engine that is used to display the telemetry data. It calls into InfluxDB to access the data that is stored there, which is the same data that Telegraf received from IOS XE. In this example there are three unique queries for each of the CPU metrics: five-seconds, five-minutes, and one-minute, and those are shown in the chart. We can see that the 5-second CPU average in green is between 1% and 2%, while the 1 minute CPU average in blue remains at 1%.

Cisco Study Materials, Cisco Tutorials and Materials, Dell EMC Materials, Cisco Guides, Cisco Learning

Tuesday, 9 July 2019

Affirming Trustworthiness of Critical Infrastructure

In this blog, I will focus on how you can cryptographically gather evidence to affirm trustworthiness of your trusted network.

Earlier this year, at Mobile World Congress (MWC) in Barcelona, Cisco announced Crosswork Trust Insights as a cloud-based SaaS offer that reports on the integrity of devices and provides advanced forensics for assured inventory. The visibility helps to maintain confidence in your trusted network infrastructure, and track potential concerns such as:

◈ Is my hardware authentic?

◈ Am I running the expected software?

◈ Are the firmware and OS verified to be genuine?

◈ Was there an unexpected software or hardware change?

Cisco is committed to continually enhance the security and resilience of its networking solutions. Delivering highly trusted and secure platforms involves relentless effort across technology innovations, rigorous certifications, best-in-class manufacturing and software development processes.

Cisco Certifications, Cisco Guides, Cisco Learning, Cisco Tutorials and Materials
Figure 1: System Integrity is the Foundation of Trust

Building and maintaining trust demands reliable and verifiable reporting on device state. There is no feature on the device that can tell you whether it is trustworthy. Instead, you must gather evidence: a broad set of integrity measurements related to hardware, firmware and software (Figure 1). It begins in the hardware as the evidence needs to be cryptographically anchored to hardware-level root of trust. Such evidence need to be collected and verifiable, not just at the boot time, but also at runtime and retrospectively for ongoing affirmation of trust. The crucial component of such a solution is the visualization and reporting of evidence that can enable today’s service providers to track the trust posture of their network infrastructure components. Such a solution must have the following attributes:

◈ Cryptographically secured collection, evaluation and storage of evidence

◈ Automated feed of up-to-date fingerprints derived from manufacturing and software build processes to affirm hardware and software integrity

◈ Authoritative history of changes to the device state to establish traceability for forensic analysis. The key is reinforcing the truth based on verifiable evidence collected today, yesterday or in the past

◈ Hosted independently to safe-guard against insider threats

In releasing Cisco Crosswork Trust Insights, we introduced a secured mechanism backed by cryptographic proof for collecting data from your devices. This mechanism can be leveraged to gather verifiable evidence for a variety of use cases such as inventory and operational reporting, compliance verification or trust attestation. Accurate tracking of inventory changes and ability to prove retrospectively, what happened, when and how it happened, who did it, are critical to preserve assured inventory. The assessment can be augmented with trust data enabling integrity verification and detecting unanticipated changes. For example, when a router is upgraded, it is essential to gather evidence to verify what OS version it is running or if the version changed unexpectedly indicating a suspicious activity.

Cisco Certifications, Cisco Guides, Cisco Learning, Cisco Tutorials and Materials
Figure 2: Cisco Crosswork Trust Insights

Crosswork Trust Insights reports on inventory changes and system integrity information with comprehensive coverage across hardware and software. It uses Cisco Crosswork Data Gateway as a proxy deployed in your network to collect data from network devices using a cryptographically secured channel. It validates the signatures and evaluates the collected evidence against the fingerprints provided by Cisco. Crosswork Trust Insights also provides secure off-site storage of evidence which can help ease compliance and forensics while safe-guarding against internal threats. All the information can be visualized and analyzed with intuitive dashboards and workflows.

For service providers, Web/OTT, and enterprises alike, a network is a mission-critical asset. Especially for service providers, the network enables delivery of business-critical services, new revenue streams, and business models. Trust is a key infrastructure pillar that can help you reinforce trustworthiness as a significant differentiator.

As we know, the security landscape will continue to expand, therefore Cisco is committed to transparency and accountability, acting as a trusted partner to our customers to address evolving security threats.

Sunday, 7 July 2019

Finding From Our Research Show Cognitive Collaboration is Needed and Wanted Now

Cisco Collaboration, Cisco Study Materials, Cisco Guides, Cisco Tutorials and Materials
For many business professionals, meeting collaboration tools have become critical to accomplishing their core goals and tasks every week. But are they effective enough?

Cognitive Collaboration Tools


Cisco recently partnered with Dimensional Research and surveyed 1501 business professionals globally from companies of all sizes on their use of and experiences with meeting collaboration solutions.

Given the critical connectivity online meetings provide, it’s concerning that 85% of respondents experience online meeting problems and 42% reached a level of frustration in just the last week. These are not rare occurrences as the research finds that nearly a quarter spend 50% of their time each day in meetings, while over 60% of all participants spend 2 or more hours in online meetings every day. The impact of an inadequate meeting solution is that in addition to frustrating users, it can waste significant amounts of time and lead to less productive meetings, a loss for both the individuals and the business.

But it’s not all doom and gloom. 89% of respondents said they want a cognitive collaboration solution to solve these issue with 50% willing to argue with their boss to get it.

Cognitive collaboration provides context and intelligence that’s woven throughout all collaboration experiences and involves AI-driven capabilities like virtual assistants and meeting attendee intelligence.

Virtual Assistants and Attendee Intelligence


Today most benefit from using Siri, Alexa, or Google’s virtual assistant to accomplish tasks such as calling or texting a friend, setting a reminder, or adding an item to a ‘to do’ list. Most have these virtual assistants on their phone, computer and in their home and know the value they bring. Not surprisingly, 87% of business professionals see direct value from including a meeting virtual assistance into their meeting collaboration tools. Even more professionals (89%), want their meeting tool to be smart, proactively providing information to meeting participants based the context of the meeting subject and attendees.

Cisco Collaboration, Cisco Study Materials, Cisco Guides, Cisco Tutorials and Materials
Attendees? Sure. When meeting with someone new, many professionals attempt to research more about them to become more knowledgeable and to make the meeting more effective. In fact, 81% stated that meeting effectiveness increases with attendee background information. For most business professionals this is often a quick check on LinkedIn. However, 66% shared that information on LinkedIn is insufficient for their needs. This leads to more time searching for information or just being less prepared for the meeting. Proactively providing thorough attendee and company information within a cognitive collaboration solution would be a boon to meeting hosts and attendees.

Intelligent Action Taking


Most meetings involve reviewing or referencing documents, discussing past action items and establishing new ones. 93% of participants believe that having current action items easily visible for all meeting participants, as well as instant access to relevant documents, would increase meeting effectiveness. This is something a cognitive solution could provide, along with tracking and displaying current action items and their progress.

The solution could also manage access to all relevant documents from within the solution, making it simple to share or find key documents as necessary. The research finds that 90% of business professionals indicated action item completion would increase with automated tracking and status reminders, and an intelligent meeting assistant could be asked to create and assign new action items, find a document, or start a quick collaboration session.

The Move to Cognitive Collaboration


Many workers find comfort in the tools they use every day: they know how a tool works and how to get things done. The time to learn and adopt to a new tool can be disruptive but 88% of participants are willing to switch tools to adopt a new solution with capabilities that a cognitive collaboration meeting solution could provide. The reality is their current tool is not meeting their expectations and frustrating them. In fact, nearly 9 out of 10 respondents stated they want to use cognitive collaboration solutions as soon as possible. With the potential benefits of a cognitive solution with an intelligent meeting assistant, it’s time for a change.

Saturday, 6 July 2019

New Tunable DWDM 10Gb Transceiver For Extended Reach On All SFP+ Ports

It is estimated that approximately 22 million*, 10Gb/s Ethernet transceivers were shipped industry-wide in 2018.  Transceivers have numerous applications from mobile backhaul to connecting switches and servers in data centers.  With the multiple applications come varied requirements for reach on the transceivers.  Some pass traffic for only a few meters but ultra-extended reach transceivers must transmit over 80km.  At a distance of 80km the optical signal will accumulate a significant amount of distortion due to chromatic dispersion and will require electronic dispersion compensation (EDC) in order to create a usable electronic signal.

Not all Cisco platforms have ports that incorporate EDC.  This means that ultra-extended reach linear transceivers such as Cisco’s DWDM-SFP10G-C cannot be used on certain Cisco hosts. To fill that gap, Cisco has released a limiting electrical interface ultra-extended reach transceiver (DWDM-SFP10G-C-S ).

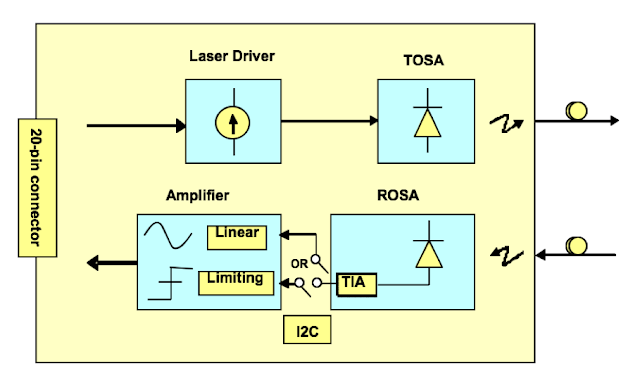
The heart of most 10G optical transceivers are the transmitter and receiver optical sub-assemblies (TOSA and ROSA). The ROSA is composed of a photodiode that converts the optical signal to photocurrent and the transimpedance amplifier (TIA) that converts the photocurrent to voltage, creating the useable electronic signal.  There are two possible flavors of the receiver. Depending on the SFP+ architecture, either a limiting or linear electrical interface will be implemented in the module.

The output of a linear receiver remains proportional to the power of the received optical signal. In a limiting receiver there is an additional limiting amplifier stage and a comparator to boost the variable amplitude of the preceding amplification stage to a constant limited amplitude.  The limiting receiver output is either high or low and “limited” by the voltage output of the comparator.

Cisco Study Materials, Cisco Guides, Cisco Learning, Cisco Certifications
Figure 1. The block diagram shows two different SFP+ module implementations one linear and one limiting.

Cisco Study Materials, Cisco Guides, Cisco Learning, Cisco Certifications
Figure 2. Voltage Output of Limiting and Linear Receivers

The linear receiver utilizes equalization and filtering to compensate for distortion.  In the SFP+ form factor the equalization and filtering are performed by a separate EDC (electronic dispersion compensation) PHY which must be present on the host port.  The EDC processes the received electronic signal and compensates for distortion to achieve better signal integrity over longer distances.  Therefore, in general, linear receivers can support greater reach than their limiting receiver counterparts.

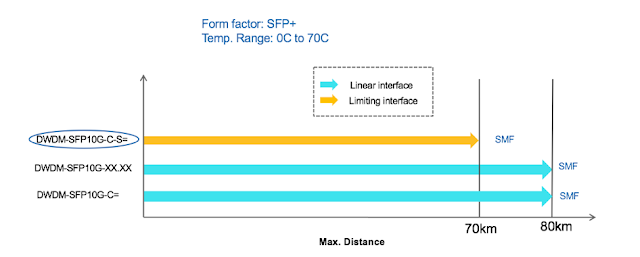
Recently, advances have been made that allow limiting transceivers to support a reach that is comparable to that of linear transceivers.  The existing tunable DWDM transceiver that Cisco offers is a linear interface electrical transceiver (DWDM-SFP10G-C). Cisco has recently released a new limiting electrical interface transceiver (DWDM-SFP10G-C-S). The limiting DWDM-SFP10G-C-S is specified for a reach of 70km, whereas the linear transceiver DWDM-SFP10G-C has a reach of 80km.

It may appear that the new  limiting interface transceiver has a shorter reach than the linear interface transceiver. However, keep in mind that the 70km specification is based on a worst case fiber chromatic dispersion assumption of 20 ps/nm-km. The ITU G.652 standard specifies a typical fiber chromatic dispersion of 17 ps/nm-km, which corresponds to a reach of 82km.

Cisco Study Materials, Cisco Guides, Cisco Learning, Cisco Certifications
Figure 3. Reach Differences

As previously mentioned the linear receiver requires EDC on the host port.  Not all Cisco platforms have ports that incorporate EDC.  For instance, neither Catalyst nor Nexus ports have EDC.  Furthermore, since EDC consumes additional power, routers limit the number of ports on a platform that support EDC.  For example, the NCS5501-SE has 24 ports that incorporate EDC and 16 that do not. DWDM-SFP10G-C-S closes this gap as it can be plugged into any SFP+ port regardless of whether that port incorporates EDC.

Thursday, 4 July 2019

Cisco DNA Center’s Network Assurance and Analytics Leaves the Competition Behind

Cisco DNA, Cisco Study Materials, Cisco Learning, Cisco Certifications

Today’s networks need Network Assurance


Network health is an important aspect of any network operation, and historically, network admins use network monitoring to keep a check on the overall health of the network. However, monitoring every part of the network often requires multiple tools which only provides a fragmented view into the network.

As the network scales and expands, the complexity in monitoring the events and data associated with a growing pool of users, things, applications and network devices rises exponentially. And replicating an issue as it occurs poses a considerable challenge. As a result, typically network admins spend more time collecting the data from different sources and tools than they do analyzing and troubleshooting the issues. Which impacts both IT and business productivity.

Network assurance and analytics solutions are designed to address these challenges by taking raw data from various sources and presenting it as actionable insights on a dashboard. So now, instead of scrambling through the data or trying to replicate the issue, a network admin knows the type of the problem, the severity of it, number of clients affected, and the location where the issue exists.

How does Cisco DNA Assurance Stack Up?


The Assurance and Analytics market is crowded with both established and emerging vendors that claim to offer full-service assurance solutions. Most vendors offer assurance capabilities in a silo: there is no holistic view of the network. Cisco DNA Assurance provides end-to-end, contextual network analytics and insights through real-time data and telemetry it collects network-wide. It also offers distinct capabilities under a single-pane-of-glass dashboard, such as Intelligent Capture, Sensor-driven Tests and Apple Wi-Fi Analytics.

And now we’ve recently added Cisco AI Network Analytics to the Cisco DNA Center arsenal, which brings the power of machine learning to better pinpoint problems and provide more accurate remediation guidance.

Cisco DNA, Cisco Study Materials, Cisco Learning, Cisco Certifications

How do the others stack up to Cisco DNA Assurance?


Aruba Assurance has three separate wireless assurance solutions:

◈ Aruba NetInsight, a cloud-based assurance platform
◈ Aruba User Experience Insight (previously known as Cape Networks), a sensor-based assurance platform
◈ Connectivity Health, a part of Aruba Airwave platform.

Huawei has two solutions:

◈ CampusInsight, their network assurance platform
◈ eSight, their network management system which offers monitoring and basic diagnostics

Miercom Puts Cisco DNA Assurance to the Test


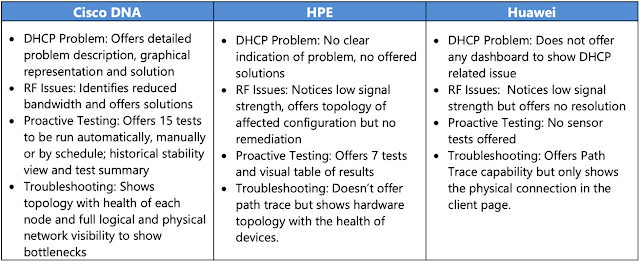
Miercom, a 3rd party vendor, produced an independent report that compares the publicly available versions of Cisco DNA Center, Huawei eSight and Aruba Connectivity Health. Miercom tested four issues that are common in any network and gauged how each platform helps a network admin to troubleshoot and resolve them.

What was tested?

◈ DHCP Problem: DHCP pool exhaustion, which can leave clients stranded without an IP address after they connect to an access point.

◈ RF Issues: How the systems dealt with a wireless client that was forced to join a crowded 2.4GHz band as the client couldn’t properly connect to the weak signal of the 5GHz radio of the access point

◈ Proactive Testing: The ability to proactively monitor the network via sensors and sensor-driven tests so that a potential issue or an anomaly can be detected and resolved before it turns into a major alert.

◈ Troubleshooting: The diagnostic efficiency of the Assurance platform to isolate a device or interface where a problem exists by examining the network topology through tools such as path trace

What were the results of the tests?


Cisco DNA Assurance:

Miercom concluded that Cisco DNA Center performed the best of all the tested platforms. It excelled in each test case by offering a detailed root cause analysis and step by step remediations for each issue.

Cisco DNA, Cisco Study Materials, Cisco Learning, Cisco Certifications
Source: Miercom

The Cisco active sensor supports more than twice the test cases than Aruba Connectivity Health Sensors. Only Cisco offers a view of the physical connection of the devices with health as well as a logical connection through path trace tool that gives a full view of the end-to-end connection of a client.

Cisco DNA, Cisco Study Materials, Cisco Learning, Cisco Certifications

The Competition:

Aruba Connectivity Health partially satisfies some of the use cases, but it doesn’t go beyond basic pre-connection statistics and lacks in providing detailed analysis of a network problem. Huawei eSight attempts to display some RF related issues but, like any network monitoring tool, it forces a network admin to search for an issue rather than displaying it on the dashboard for faster analysis and resolution.