Friday, 24 July 2020

How Trustworthy Networking Thwarts Security Attacks

Nestled in the picturesque Sierra Nevada mountain range, famous for its ski resorts, spas, and casinos, is Reno’s Renown Health. Renown is northern Nevada’s largest and most comprehensive healthcare provider and the only locally owned, not-for-profit system in the region. Renown boasts 6500+ employees across more than 70 facilities serving over 74,000 Nevadans every month.  During ski season, it’s not unusual to see one or more helicopters hanging out on the roof of the hospital. Because of its location, the need for alternative modes of transport and communication are imperative to serving its remote community and ski slopes.

As with most hospitals, Renown is highly connected with medical devices, communications devices, mobile crash carts, as well as surgical robots, MRI machines, you name it—and it’s all connected to a centralized network that provides access to mission-critical data, applications, and services.  This not only includes the production healthcare network but the guest network where patients and their friends and family communicate. And from what I hear, the guest network is also popular with the staff, which means that it must be as reliable and secure as the hospital’s production network.

Getting Wi-Fi with a little help from my friends (at Cisco)


A couple weeks ago, I (virtually) sat down with Dustin Metteer, network engineer at Renown Health, to learn a little bit more about how Cisco and Renown work together. Dustin started out by sharing that their wireless network wasn’t always as wonderful as it is today. He explained that Renown had been using another company’s access points (APs) for a few years. Long story short, they didn’t live up to expectations on both the hardware and software side. After a few years of trying to get this solution to work, Dustin and team moved to Cisco and the Aironet platform.  The Cisco Aironet APs delivered the reliability, security, and ease of use that Renown needed. And for five years, the Cisco Aironet 3702 APs served Renown’s 70+ facilities with consistent wireless communications.

Today, Renown is moving to the next generation of Cisco APs with Wi-Fi 6 compatibility, more sophisticated chip sets, and the latest IOS-XE operating system all covered under a single Cisco DNA Advantage license. Dustin shared that healthcare facilities are typically late to adopt technology and the hospital isn’t stocked with Wi-Fi 6 devices. However, Dustin felt the move was necessary to ensure the network is ready when the time comes.

“While updating,” says Dustin “we thought, ‘Why not update to the latest technology and future proof the network?’”

And so that’s what they did.

Cisco Catalyst access points deliver on experience


Renown purchased its first batch of Wi-Fi 6-ready Cisco Catalyst 9120 Access Points along with Cisco Catalyst 9800-80 wireless controllers about a year ago. The healthcare company has updated several hospitals already. But with more than 70 facilities dispersed throughout the state, they’ll be busy for a while. The Catalyst 9120 has 4×4 radios, custom ASICs, and the ability to host applications at the edge. Additionally, it’s compatible with DNA Spaces (included with Cisco DNA Advantage) for location-based analytics which also has the ability to integrate with other healthcare specific applications for wayfinding, asset management, and more—we’ll get into this a little further down. But the real reason for the Catalyst 9120, is it’s a good fit for Renown’s highly demanding, high-density environment.

“We coupled our new 9120 Access Points with the Cisco Catalyst 9800-80 wireless controllers to push configurations and define policies for our WLANs,” says Dustin.  “Provisioning is as easy as defining the policies and tags for each wireless network and assigning to each group of APs.” To add to that, policies based on identity and tags enable the hospital to segment users while ensuring secure access to resources and compliance. And updates can be done live without taking the wireless network offline. Seriously, and they don’t even have to restart or anything.

Of course, all good wireless networks have a great wired network behind them. Renown has also recently upgraded to the Cisco Catalyst 9000 family of switches to drive everything from the edge to the core. And for resiliency, Renown has deployed them in high-availability (HA) pairs. Here’s what Dustin says: “We always want to be prepared for any piece of anything to break and so we have backup all the way down to our core switches.”

And when asked about running everything from the switches to the controllers to the APs on the Cisco IOS-XE operating system, Dustin is excited that he can, “run commands across the stack and not worry about it.” He adds: “The usability is awesome.”

Taking control with Cisco DNA Center


“We can simply log into Cisco DNA Center and it takes us five minutes to do what used to take hours.” That’s the first thing Dustin tells me when I ask about Cisco DNA Center. It set the stage for the next phase in our conversation around wired and wireless assurance in a healthcare system where 100% uptime isn’t just the standard, it’s mission critical.

Prior to Cisco DNA Center, the Renown team would wander around looking for the root cause of a reported issue and of course, it was rarely replicated. It’s like when you take the car to the mechanic for a noise it’s been making for a month, you pull into the shop and the noise is gone. But unlike the mechanic, the Renown team has Cisco DNA Center with Cisco DNA Assurance built in. This gives them X-ray like vision and allows them to trace an issue to its root cause, even something that happened days ago. Once an issue is identified, assurance provides them with remediation tips and best practices for quick resolution. Its advanced analytics and machine learning combine to reduce the noise of non-relevant alerts and highlight serious issues, saving them time troubleshooting. With Cisco DNA Center, the team has the assurance tools they need to increase network performance and spend less time doing it.

Cisco Tutorial and Material, Cisco Learning, Cisco Guides, Cisco Security

Cisco DNA Spaces + STANLEY Healthcare: Helping hospitals help patients


The Cisco Catalyst 9120 APs that Renown purchased also have the ability run Cisco DNA Spaces which provides a cloud-based platform for location-based analytics. Renown chose to use the Cisco DNA Spaces and STANLEY Healthcare integration to remotely track the temperature and location of medications and set alerts to prevent them from spoilage. In the past, thermostats needed be checked manually, one-by-one by nurses which was time consuming and labor intensive. Not only does the integration make temperature tracking more consistent, it also makes the nurses’ lives easier and allows them to focus on what matters most, caring for their patients.

Renown also uses the Cisco DNA Spaces and STANLEY Healthcare integration to track assets. Things like IV pumps, “are small and easily maneuvered and they tend to go walking,” says Dustin. It’s often complicated to track the locations of 30 to 40 assets at once, and many are lost or misplaced. Cisco DNA Spaces not only allows them to track down and locate misplaced devices, they use tags and set perimeters, and once a tagged device “goes walking” it sounds an alarm. This reduces lost equipment and saves on the time spent searching for missing equipment.

And when asked about deployment of the integration, Dustin says, “it was really simple to operate and going into Cisco DNA Spaces was very intuitive. Getting STANLEY Healthcare integrated with Cisco DNA Spaces was relatively painless.”

In the future, Renown is planning to use Cisco DNA Spaces in conjunction with their mobile app to help patients, visitors, and guests with indoor wayfinding. Patients often encounter difficulties pinpointing where in the healthcare facility their appointment is. Dustin says, “Using maps with Cisco DNA Spaces will enable patients to get to their appointments faster and more efficiently without the need to stop and get directions, it’ll give them a better experience.”

Visibility, control, experience, and analytics


Renown’s new networking solution, comprised of the latest Cisco LAN gear, will provide the hospital system with reliable and secure connectivity for many years to come. With Cisco DNA Center, they are able to assure service while proactively troubleshooting potential issues to deliver users the optimal connected experience. And with Cisco DNA Spaces, Renown has simplified device monitoring and location analytics proving valuable insights and simplifying operations. And Renown is only partially through its LAN refresh. I look forward to following up with them to see how things turn out.

In closing, I posed a question to Dustin. With all this new equipment, have any of your users noticed a difference? Dustin explained that, “It’s kinda the best compliment when nobody says anything. The best IT team is the one that you don’t know you have.”

Thursday, 23 July 2020

Hot off the press: Introducing OpenConfig Telemetry on NX-OS with gNMI and Telegraf!

Transmission and Telemetry


The word transmission may spark different thoughts in each of us. We may think about transmission of electromagnetic waves from transmitter to receiver like in a radio or television. Perhaps we think of automobile transmission. In the world of networking, transmission commonly refers to transmitting and receiving packets between source and destination. This brings us to the focus of this article – transmission of telemetry data.

I am excited to share a few new developments we have in the area, especially with streaming telemetry on Nexus switches. Telemetry involves the collection of data from our switches and their transmission to a receiver for monitoring. The ability to collect data in real time is essential for network visibility, which in turn helps in network operations, automation and planning. In this article, we introduce gNMI with OpenConfig that is used to stream telemetry data from Nexus switches. We also introduce the open source time series data collection agent, Telegraf, which is used to consume our telemetry data. The word telegraph, as some may recall, was a system for transmitting messages from a distance along a wire. Let us take a look at our modern take on it, and how far we have come from Morse codes to JSON encoding!

Evolution of gRPC, gNMI and OpenConfig on our switches


There are different network configuration protocols available on Cisco Nexus switches, including NETCONF, RESTCONF and gNMI. All of these protocols use YANG as a data model to manipulate configuration and state information. Each of these protocols can use a different encoding and transport. For the purposes of this article, we will be focusing on gRPC Network Management Interface (gNMI) which leverages the gRPC Remote Procedure Call (gRPC) framework initially developed by Google. gNMI is a unified management protocol for configuration management and streaming telemetry. While NETCONF and RESTCONF are specified by the IETF, the gNMI specification is openly available at the OpenConfig GitHub account.

Cisco Nexus switches introduced telemetry over gRPC using a Cisco proprietary gRPC agent in NX-OS Release 7.x. The agent called “gRPCConfigOper” was used for model-driven telemetry. This was based on a dial-out model, where the switch pushed telemetry data out to telemetry receivers.

With NX-OS Release 9.3(1), we introduced a gNMI agent which also offers a dial-in subscription to telemetry data on the switch. This allowed a telemetry application to pull information from a switch with a Subscribe operation. The initial implementation of gNMI Subscribe was based on the Cisco Data Management Engine (DME) or device YANG which is specific to Cisco Nexus switches.

In order to have a fully open gNMI specification, we added OpenConfig support with gNMI. gNMI defines the following gRPC operations: CapabilityRequest, GetRequest, SetRequest and SubscribeRequest. Cisco NX-OS Release 9.3(5) supports the complete suite of gNMI operations with Capability, Subscribe, Get and Set using OpenConfig. Cisco NX-OS 9.3(5) is based on gNMI version 0.5.0.

While these may seem like incremental enhancements, that is far from the case. This new method of telemetry enables us to stream telemetry to multiple collectors, both in-house as well as within the open source community, as we will see in this article.

Telemetry on Cisco Nexus Switches


The two methods of streaming telemetry described above can be implemented by enabling specific features globally on Cisco Nexus switches.

◉ Dial-out telemetry is enabled with “feature telemetry”.
◉ Dial-in telemetry with gNMI is enabled with “feature grpc”.


Telegraf


Telegraf is an open-source server agent used for collecting and reporting metrics and events. It was developed by the company InfluxData. It uses various input plugins to define the sources of telemetry data that it receives and processes. It uses output plugins which control where it sends the data, such as to a database. With the appropriate input plugins in place, Telegraf is able to subscribe to a switch or switches and collect telemetry data over gNMI or other protocols. It can send this data to a time series database called InfluxDB. The data can then be rendered with an application called Chronograf. The different components are summarized below:

◉ Telegraf: a server agent for collecting and reporting metrics

◉ InfluxDB: a time series database

◉ Chronograf: a GUI (graphical user interface) for the InfluxData platform which works on templates and libraries

◉ Kapacitor: a data-processing engine

In my example below, I’ve leveraged the first three components of the stack for viewing telemetry data. Cisco has released specific plugins for gNMI and MDT (model-driven telemetry) for Telegraf which are packaged along with the product.

How can I get it to work?


Step 1: Set up your environment

In the example below, the setup is entirely virtual and is built with just two devices: A Nexus 9300v switch running 9.3(5) and an Ubuntu server running 18.04 LTS. You could set up the same environment with any Nexus switch with reachability to a host.

Cisco Prep, Cisco Tutorial and Material, Cisco Exam Prep, Cisco Guides, Cisco Certification

Nexus 9000 Telemetry using gNMI with Telegraf

The Nexus 9300v is a new ToR (Top-of-Rack) simulation of the Nexus 9000 series switches that can be used as a virtual appliance with VMware ESXi/Fusion, Vagrant or KVM/QEMU. It requires no licenses and can be used for demo or lab purposes to model a Nexus 9000 environment. In this example, I used an OVA to deploy my switch on a VMware ESXi host. Once the installation is complete and the switch can be accessed over console or SSH, the appropriate RPM packages for OpenConfig need to be installed on the switch, which can be downloaded from the Cisco Artifactory portal, under “open-nxos-agents”.

After the file “mtx-openconfig-all-<version>.lib32_n9000.rpm” is copied onto the switch bootflash, it needs to be installed on the switch as below:

n9300v-telemetry# install add mtx-openconfig-all-1.0.0.182-9.3.5.lib32_n9000.rpm activate 
Adding the patch (/mtx-openconfig-all-1.0.0.182-9.3.5.lib32_n9000.rpm)
[####################] 100%
Install operation 1 completed successfully at Fri Jul  3 02:20:55 2020

Activating the patch (/mtx-openconfig-all-1.0.0.182-9.3.5.lib32_n9000.rpm)
[####################] 100%
Install operation 2 completed successfully at Fri Jul  3 02:21:03 2020

n9300v-telemetry# show version
<---snip--->
Active Package(s):
 mtx-openconfig-all-1.0.0.182-9.3.5.lib32_n9000
n9300v-telemetry# 

Step 2: Configure your server with Telegraf

There are two ways to install Telegraf. One method would be to install Telegraf, InfluxDB and Chronograf within Docker containers on the host. The other method is to install them natively on the host using the Telegraf repository to install the component packages. This is the method that I followed in my example. There are many tutorials available for Telegraf installation, so I will reference the InfluxData documentation for this step. Once the services have been installed, you can verify their operational status or start/stop/restart services the using the following commands.

systemctl status telegraf
systemctl status influxdb
systemctl status chronograf

The two plugins cisco_mdt_telemetry (the Cisco model-driven telemetry plugin) and gnmi (the Cisco gNMI plugin) are integrated into the Telegraf release, and no specific configuration is required to install them. The cisco_mdt_telemetry plugin is based on dial-out telemetry or a push model. The gnmi plugin is based on dial-in telemetry or a pull model, which is what we explore in this example.

Step 3: Configure your switch

Telemetry using gRPC and gNMI can be enabled by the command “feature grpc”. The other gRPC configuration is summarized below.

n9300v-telemetry# show run grpc

!Command: show running-config grpc
!No configuration change since last restart
!Time: Tue Jul 14 16:56:37 2020

version 9.3(5) Bios:version  
feature grpc

grpc gnmi max-concurrent-calls 16
grpc use-vrf default
grpc certificate gnmicert

n9300v-telemetry# 

The max-concurrent-calls argument applies specifically to the new gNMI service and allows a maximum of 16 concurrent gNMI calls. The gRPC agent serves only the management interface by default. Adding the “use-vrf default” command allows it to accept requests from both the management and the default VRF.

Optionally, we can also configure gNMI to use a specific port for streaming telemetry. The default port is 50051.

n9300v-telemetry(config)# grpc port ?
    Default 50051

Telemetry with gNMI uses TLS certificates to validate the client-server communication. In my example, I used a self-signed certificate and uploaded it onto the server and the switch. The gNMI/gRPC agent on the switch is then set to honor the certificate. On the server side, the Telegraf configuration file (covered in the next section) is set to point to the certificate.

For the switch side of the configuration, the configuration guide covers the required steps. There are two methods that can be followed. The first method is available in older releases and consists of copying the .pem file onto bootflash and manually editing the gRPC configuration file to use the .pem and .key file.

The second method was introduced with NX-OS Release 9.3(3) and is our recommended way of installing certificates. It consists of generating a public and private key pair and embedding them in a certificate that is associated with a trustpoint. The trustpoint is then referenced in the grpc certificate command above.

n9300v-telemetry# run bash sudo su
bash-4.3# cd /bootflash/
bash-4.3# openssl req -newkey rsa:2048 -nodes -keyout gnmi.key -x509 -days 1000 -out gnmi.pem
bash-4.3# openssl pkcs12 -export -out gnmi.pfx -inkey gnmi.key -in gnmi.pem -certfile gnmi.pem -password pass:abcxyz12345
bash-4.3# exit
n9300v-telemetry(config)# crypto ca trustpoint gnmicert
n9300v-telemetry(config-trustpoint)# crypto ca import gnmicert pkcs12 gnmi.pfx abcxyz12345 
n9300v-telemetry(config)# grpc certificate gnmicert

The certificate can be verified using the command “show crypto ca certificates”. In my example, I copied the public key gnmi.pem from the switch bootflash to the host running Telegraf into the default configuration folder /etc/telegraf.

Step 4: Edit the configuration file in Telegraf

Now we get to the key piece of the puzzle. Telegraf uses input and output plugins. The output plugins are a method for sending data to InfluxDB. The input plugins are used to specify different sources of telemetry data that Telegraf can subscribe to receive data from, including our Cisco Nexus switch.

Here is the configuration for the output plugin. We ensure that we are pointing to our server IP address, and setting up a database name and credentials for InfluxDB. This information will be fed into Chronograf.

Most of the fields are left as default, but a few parameters are edited as seen below.

# Configuration for sending metrics to InfluxDB
[[outputs.influxdb]]
   urls = ["http://172.25.74.92:8086"]
   database = "telemetrydb"
   username = "telemetry"
   password = "metrics"

Here is the configuration for the input plugin, where we enter our switch details. Cisco has released two plugins with Telegraf, the MDT plugin and the gNMI plugin. For this exercise, we will be focusing on the gNMI plugin which is integrated into Telegraf when you install it. Note that our path specifies an origin of “openconfig”. The other options are to use device or DME as the origin and path for our gNMI subscription. The encoding can also be specified here. Please see the Cisco Nexus Programmability Guide for supported encoding formats with gNMI for the release you are working with. The examples below reference the plugin “cisco_telemetry_gnmi” which has since been renamed to “gnmi” in future Telegraf releases since it works with other vendors that support gNMI.

 [[inputs.cisco_telemetry_gnmi]]
  ## Address and port of the GNMI GRPC server
  addresses = ["172.25.74.84:50051"]
  #  addresses = ["172.25.238.111:57400"]
  ## define credentials
  username = "admin"
  password = "abcxyz12345"

  ## GNMI encoding requested (one of: "proto", "json", "json_ietf")
   encoding = "proto"

  ## enable client-side TLS and define CA to authenticate the device
   enable_tls = true
   tls_ca = "/etc/telegraf/gnmi.pem"
   insecure_skip_verify = true

[[inputs.cisco_telemetry_gnmi.subscription]]
 ## Name of the measurement that will be emitted
 name = "Telemetry-Demo"

 ## Origin and path of the subscription
    origin = "openconfig"
    path = "/interfaces/interface/state/counters"

Step 5: Set up Chronograf and start Telegraf

Browse to your server IP port 8888 to see the beautiful view of your time series telemetry data! Chronograf can be accessed as shown in the picture below. The settings icon on the left will need to be used to point to the InfluxDB database that you selected in the output plugin section of your Telegraf configuration file.

Cisco Prep, Cisco Tutorial and Material, Cisco Exam Prep, Cisco Guides, Cisco Certification
Chronograf with a connection to InfluxDB

In Step 4 where we edit the Telegraf configuration file in the folder /etc/telegraf on the host, I created a new configuration file that I edited so as not to modify the original configuration file. I called this file telegraf_influxdb.conf. When I start telegraf, I can do so by specifying this particular configuration file. As you can see below, the cisco_telemetry_gnmi plugin (later renamed to gnmi) is loaded.

dirao@dirao-nso:/etc/telegraf$ sudo /usr/bin/telegraf -config /etc/telegraf/telegraf_influxdb.conf -config-directory /etc/telegraf/telegraf.d/
[sudo] password for dirao: 
2020-07-15T00:33:54Z I! Starting Telegraf 1.14.4
2020-07-15T00:33:54Z I! Loaded inputs: cisco_telemetry_gnmi
2020-07-15T00:33:54Z I! Loaded aggregators: 
2020-07-15T00:33:54Z I! Loaded processors: 
2020-07-15T00:33:54Z I! Loaded outputs: influxdb file
2020-07-15T00:33:54Z I! Tags enabled: host=dirao-nso
2020-07-15T00:33:54Z I! [agent] Config: Interval:10s, Quiet:false, Hostname:"dirao-nso", Flush Interval:10s
{"fields":{"in_broadcast_pkts":0,"in_discards":0,"in_errors":0,"in_fcs_errors":0,"in_multicast_pkts":0,"in_octets":0,"in_unicast_pkts":0,"in_unknown_protos":0,"out_broadcast_pkts":0,"out_discards":0,"out_errors":0,"out_multicast_pkts":0,"out_octets":0,"out_unicast_pkts":0},"name":"Telemetry-Demo","tags":{"host":"dirao-nso","name":"eth1/14","path":"openconfig:/interfaces","source":"172.25.74.84"},"timestamp":1594773287}
{"fields":{"penconfig:/interfaces/interface/name":"eth1/14"},"name":"openconfig:/interfaces","tags":{"host":"dirao-nso","name":"eth1/14","path":"openconfig:/interfaces","source":"172.25.74.84"},"timestamp":1594773287}
{"fields":{"in_broadcast_pkts":0,"in_discards":0,"in_errors":0,"in_fcs_errors":0,"in_multicast_pkts":0,"in_octets":0,"in_unicast_pkts":0,"in_unknown_protos":0,"out_broadcast_pkts":0,"out_discards":0,"out_errors":0,"out_multicast_pkts":0,"out_octets":0,"out_unicast_pkts":0},"name":"Telemetry-Demo","tags":{"host":"dirao-nso","name":"eth1/9","path":"openconfig:/interfaces","source":"172.25.74.84"},"timestamp":1594773287}

Step 6: Verify and Validate gNMI on the switch

Verify gNMI/gRPC on the switch as below to check the configured gNMI status with certificate registration and to verify that the gNMI subscription was successful.

n9300v-telemetry# show grpc gnmi service statistics 

=============
gRPC Endpoint
=============

Vrf            : management
Server address : [::]:50051

Cert notBefore : Jul 10 19:56:47 2020 GMT
Cert notAfter  : Jul 10 19:56:47 2021 GMT

Max concurrent calls            :  16
Listen calls                    :  1
Active calls                    :  0

Number of created calls         :  4
Number of bad calls             :  0

Subscription stream/once/poll   :  3/0/0

Max gNMI::Get concurrent        :  5
Max grpc message size           :  8388608
gNMI Synchronous calls          :  0
gNMI Synchronous errors         :  0
gNMI Adapter errors             :  0
gNMI Dtx errors                 :  0
<---snip--->
n9300v-telemetry#  

n9300v-telemetry# show grpc internal gnmi subscription statistics  | b YANG
1              YANG                 36075             0                 0       
         
2              DME                  0                 0                 0       
         
3              NX-API               0                 0                 0          
<---snip--->

Note the output above showing the gRPC port number and VRF in use. It also shows that the certificate is installed successfully with the dates of the Cert being indicated. The second command output shows hits on the statistics for YANG every time we have a successful gNMI subscription, since gNMI uses the underlying YANG model.

Step 7: Visualize time-series telemetry data on Chronograf

Navigate to the measurement you specified in your Telegraf configuration file, and enjoy your new graphical view on Chronograf!

Cisco Prep, Cisco Tutorial and Material, Cisco Exam Prep, Cisco Guides, Cisco Certification
Chronograf – Setting up queries and parameters to monitor

Cisco Prep, Cisco Tutorial and Material, Cisco Exam Prep, Cisco Guides, Cisco Certification
Chronograf – Interface counter graphs and packet counts on time series view

The above output shows interface statistics collected by gNMI for unicast packets in and out of a particular interface that has traffic going on it. The data can be viewed and further modeled using queries to make it more granular and specific.

Source: cisco.com

Wednesday, 22 July 2020

Helping to keep employees safe by measuring workspace density with Cisco DNA Spaces

Cisco Tutorial and Material, Cisco Exam Prep, Cisco Study Material, Cisco DNA

Employee safety is top of mind as pandemic lockdowns ease and we gradually welcome employees back to the office. We’ll bring back employees in waves, starting with the 20-30% of employees whose jobs require them to be in the office, like engineers with hands-on responsibilities for development, testing, and operations. Before allowing additional employees to return, our Workplace Resources team wants to make sure the first employees are practicing social distancing—not standing or sitting too close or gathering in large groups.

We needed a solution quickly, which sped up our plans to adopt Cisco DNA Spaces. It’s a cloud-based, indoor location services platform that turns existing wireless networks into a sensor.

Quick deployment


Cisco DNA Spaces is a cloud solution. We deployed the connectors, which run on virtual machines, in about a day. Connectors retrieve data from our wireless LAN controllers, encrypt personally identifiable information, and then send the data on to Cisco DNA Spaces. Provisioning accounts in the cloud took just a few hours. Adding buildings took just minutes to add to Cisco DNA Spaces, as did uploading building maps. In total, we were able to onboard multiple sites in just two days and extend to production sites in four. That gave us time to vet the use case with Workplace Resources and collaborate with Infosec on data privacy and security.

Measuring workspace density to adjust the pace of return


To date, Cisco DNA Spaces is used for ten branch offices and three campus locations in the United States and Asia, with many more planned and underway.

Workplace Resources will use Cisco DNA Spaces to see where people gather and at what times. Based on that data, Workplace Resources will take actions such as increasing or reducing the number of employees on site, closing or opening certain areas of the building, posting signage, etc. After taking an action Workplace Resources can check the Cisco DNA Spaces App to make a data-based decision on whether to invite more employees back—or pause. A colleague compared the approach to turning the faucet on or off.

We receive alerts when density or device count in a certain area exceeds our thresholds, using the DNA Spaces Right Now App. It shows wireless density in near real-time, for a site, building, floor, or zone (Figure 1).

Cisco Tutorial and Material, Cisco Exam Prep, Cisco Study Material, Cisco DNA

Figure 1. Right Now App dashboard

Respecting privacy—no names


When employees return to the office, they’ll use a mobile app to attest that they don’t have a fever or other symptoms before they are allowed into the facility. Then they’ll badge in and use Wi-Fi as they would ordinarily. No change to the user experience.

The change is that Wi-Fi data we’ve always collected now feeds the analytics (real-time and historical) in Cisco DNA Spaces. As people move around the building throughout the day, Cisco DNA Spaces plots the location of devices connected to Wi-Fi (Figure 2). To respect employee privacy, we capture device location only—not the owner’s name or any other personally identifiable information. As an example, we can see that three people were in the break room from 3:00 p.m. – 3:45 p.m., but not who they are.

Another one of our suggestions as Customer Zero was making it easier to define zones, or specified areas of a floor. Workplace Resources finds it more useful to monitor density by zone rather than an entire floor or building. Other potential improvements have also been detailed by Cisco IT to the product management teams responsible for the DNA Spaces solution. Including various potential enhancements and new features, which in time will hopefully automate a number of currently manual tasks, expand APIs, and hopefully offer other benefits not only to Cisco IT, but other customers as well.

Cisco Tutorial and Material, Cisco Exam Prep, Cisco Study Material, Cisco DNA

Figure 2. Cisco DNA Spaces shows where people gather in groups

Getting an accurate count


While Cisco DNA Spaces gives us a good idea of density, we keep in mind there’s a margin of error. For example, wireless location data can be accurate to within about three meters. So it might appear that people are maintaining social distancing when they aren’t—or vice versa. Also, two connected devices in a room doesn’t necessarily mean two people. One person might be using two connected devices. Or there might be three people, one whose device isn’t connected to Wi-Fi.

To make our density estimates more accurate, for the first few buildings to re-open, Workplace Resources is correlating Cisco DNA Spaces data with badge-in data. If 20 people badge into a building and Cisco DNA Spaces reports 60 devices, for example, we’ll estimate one person for every three devices shown.

Lesson learned: accurate floor maps are important


During initial rollout we realized that some of our floor plans were inaccurate because of “drift.” That is, over time, the floor plans tend to diverge from access point placement data. In buildings where we’d recently upgraded infrastructure, the maps are accurate and include the height and azimuth of the access points. That’s not the case for buildings that haven’t been refreshed for a while. Cisco IT and Workplace Resources are currently updating the maps for sites where accurate information is important to plan a return to the office at a safe pace.

Before we return: checking office network health


As part of our return-to-office process, we’re evaluating each location against a readiness checklist. One item is network readiness.  While sheltering in place, Cisco IT staff has been turning on Cisco DNA Assurance in more locations. On one pane of glass we can see a holistic view of the health of all wired and wireless infrastructure in a given building. During the lockdown we’ve been keeping a to-do list of hands-on tasks—e.g., re-patching cables—to complete before employees return to the office.

More plans for Cisco DNA Spaces


Bringing employees back to the office at a safe pace was our incentive to deploy Cisco DNA Spaces.  We in Cisco IT eagerly implemented it via our Customer Zero program, which involves road testing new Cisco products or using existing ones in new ways.  As Customer Zero we help improve a solution by giving feedback to product engineers about bugs, additional features, and the user experience.

Later we’ll use Cisco DNA Spaces in new ways—for instance, showing the closest unoccupied conference room, tracking the movement of things in our supply chain, and tracking janitorial services. This will help us know where we have cleaned recently and ensure efficiency and effectiveness based on usage of the space.

Tuesday, 21 July 2020

ACI Gets Support for Segment Routing on MPLS

I’m pleased to announce that Cisco’s Application Centric Infrastruture (ACI) version 5.0 introduces support for Segment Routing on Mulitprotocol Label Switching (SR-MPLS). This will make it easier for service provider architects to roll out new 5G networks quickly, while meeting strict service-level agreements.

With this new feature, service providers can roll out 5G networks using Segment Routing as the data plane — all the way from their data centers, across the transport network, and to the edge. Using a single data plane across an entire wide-area network empowers service provider architects to design more efficient and flexible 5G networks. Also, a single data and control plane across data center and transport makes it easier for operations teams to maintain networks.

Powering Service Providers with ACI


Many of our service provider customers are using Cisco ACI to streamline operations for distributed central, regional, and edge data centers; and to build new distributed, 5G-ready telecom data centers. ACI provides consistent policy, automation, and telemetry, in addition to intelligent service chaining.

When building the 5G transport domains, many service providers use a SR-MPLS handoff, from service provider data center, across the transport, to the provider data center edge. ACI’s SR-MPLS feature offers the potential for dramatically simpler automation, through consistent policy applied end-to-end.

SR-MPLS handoff is supported directly in ACI 5.0. The handoff solution works in any data center topology, including ACI multi-site, ACI multi-pod, and remote leaf. It also improves day-2 operations by simplifying the network from their data center to the 5G edge.

Here are some key ways we leverage SR-MPLS handoff in ACI 5.0:

Unified SR-MPLS transport


ACI was built to solve data center challenges, such as workload mobility, and integration with different types of virtual environments — such as VMware, Microsoft and KVM Hypervisors for OpenStack, as well as container workloads — to support automation and visibility.  ACI uses a VXLAN data plane within the fabric. Many SP transport networks are built using an SR-MPLS data plane. An SR-MPLS data center handoff allows service providers to use a single data plane protocol on their transport devices.

Cisco Prep, Cisco Tutorial and Material, Cisco Learning, Cisco Exam Prep, Cisco Learning

Traditionally the handoff from the ACI fabric was done either with native IP or with VXLAN. In these cases, the transport devices needed to support VXLAN, and the handoff had to be manually configured. With SR-MPLS handoff in ACI, service provder customers no longer have to worry about supporting VXLAN, nor manually configuring an IP handoff on their transport devices.

A new automated and scalable data center handoff


To provide connectivity from the data center to the transport or external device, an IP handoff from the data center requires a separate interface and routing protocol for each virtual routing and forwarding (VRF) instance. This type of connectivity is referred to as a VRF-lite. At a service provider or in a large enterprise environment there might be many VRFs deployed. Creating separate sub-interfaces and routing protocol adjacencies for each VRF causes automation and scale issues.

Cisco Prep, Cisco Tutorial and Material, Cisco Learning, Cisco Exam Prep, Cisco Learning

But with SR-MPLS handoff, a single BGP EVPN session can exchange information about all prefixes and all VRFs, instead of having a routing protocol session and sub-interface for each VRF. This leads to better scalability and simplified automation.

Cisco Prep, Cisco Tutorial and Material, Cisco Learning, Cisco Exam Prep, Cisco Learning

Consistent policy across data center and transport


Customers can simply advertise a BGP color community for a prefix from the ACI Border Leaf (BL) and use the community on the Provider Edge (PE) to define an SR policy in the transport. Allowing this mapping between the data center and transport provides better automation and policy consistency across the domains. The following diagram shows how to achieve this.

Cisco Prep, Cisco Tutorial and Material, Cisco Learning, Cisco Exam Prep, Cisco Learning

Another option to achieve consistent policy end-to-end is to mark packets with specific DSCP or EXP values when they leave the data center, and use these values in the transport to define SR policies. The following diagram shows how.

Cisco Prep, Cisco Tutorial and Material, Cisco Learning, Cisco Exam Prep, Cisco Learning

Lastly, if the transport doesn’t support BGP color community or SR policies based on DSCP/EXP values, customers can define prefix-based SR policies based on prefixes advertised by the ACI fabric using the BGP EVPN session between border leaf and the data center-provider edge.

Sunday, 19 July 2020

The Tactical Chameleon: Security Through Diverse Strategy

Over the course of my professional career, I have been fortunate enough to be involved in the development of video games and I still keep up with current events and trends in the video game industry. For many, video games are a hobby but for me, they are much more than that. Video games have given me a way to model conflict and there are many patterns we can borrow and apply to the way we approach cybersecurity. When this subject comes up in academic circles, they are quick to reach into the field of study called Game Theory. However, I have had very little luck applying this logical and orderly model in the real world. The reality is, production networks are messy, attackers don’t fit nicely into categories, and in the fast-moving field of cybersecurity, a lot of what happened even this week will take months if not years to reach learning institutions.

The ability to communicate tactics and strategies that are useful in conflict pre-dates the invention of Game Theory and I’m sure you have your set of favorite strategists that have served you well in business, cybersecurity, sports, and other conflict-oriented environments.

I’m no exception to this and in this article, I want to introduce you to a favorite of mine named Musashi Miyamoto. He was the greatest samurai to ever walk this earth and in his later years, he wrote “The Book of Five Rings” where in he outlined his no-nonsense approach to the art of combat. There are a few patterns he describes that I believe are important to those of us trying to figure out how to automate our systems in a way that serves our businesses and not our attackers.

Cisco Prep, Cisco Tutorial and Material, Cisco Study Materials, Cisco Exam Prep

The Tactical Chameleon

The martial arts are a collection of moves or forms that are rehearsed over and over. This repetition trains the body and the mind for battle where milliseconds of hesitation might mean defeat. Musashi placed a lot of value on not just knowing one form, but all of them. For Musashi, being over-reliant upon a single form was worse than bad technique. This approach earned him a reputation as the “Tactical Chameleon” because he would adapt to his opponents form and exploit the deterministic qualities of those forms’ countermeasures.

Let’s take a moment to connect this approach to the video game genre of fighting games. Looking back to some of the earliest games in this genre like Street Fighter, each character in the game has a defined move-set that makes up a deterministic quality of that character. This still holds true for fighting games today as well. Competitive eSport players study every character, every move, and learn every frame by frame detail to help give them a predictive advantage over their competitors.

Now back to Musashi. When facing an opponent on the trail, he would at first not know what form that opponent was trained in so he would start to exhibit a gesture like “Are you form B?” The way his opponent would react to his initial gesture would confirm or deny this. If yes, the next course of action would be to respond with a countermeasure that was exclusive to form B. By determining the form of his opponent, Musashi could exhibit a move that would put his foe in a vulnerable position and allow him to perform a killing blow.

This same methodology is also applied in eSports. At major fighting game tournaments like the Evolution Championship Series (EVO), the top competitors not only know all the ins and outs of the character they play, but they also know all the moves and matchups against other characters down to the frame level. This approach holds deterministic qualities that the players can use offensively and defensively.

The Musashi Approach to Security Automation

One thing that I should point out in this analogy is that in fighting games, player A and player B both have offensive and defensive capabilities. This is not the case with cybersecurity, where the conflict dynamic is more akin to player A is primarily a defender and player B is an attacker.

However, regardless of this difference, there are still qualities we can learn from Musashi and the fighting video game genre that are useful in threat modeling security automation.

Cisco Prep, Cisco Tutorial and Material, Cisco Study Materials, Cisco Exam Prep

Behavioral Modeling

At a basic level, you can view Musashi’s strategies as behaviors that either lead to surviving the conflict or not. Similarly, you can also look at the top players of eSports fighting games as having a dominant set of behaviors that win tournaments and ultimately championships.

As a defender, you are constantly trying to model the behavioral aspects of your attacker. This happens at both your attacker’s cognitive level as well as the mechanical level (machine-scale). Both may exhibit deterministic characteristics that can be used for detection and lead to defensive actions.

As an attacker, threat actors are modeling your activity and identifying any behaviors that will help them achieve their desired outcome with the lowest chance of detection at the lowest cost of operations. If your adversary were to gain the knowledge of your playbooks or runbooks, how would that play to their advantage in terms of evading detected or achieving their goals?

When it comes to behavioral modeling, we just don’t talk about it enough when we assess our security programs. We are still so stuck on nouns (things) when we need to be looking at the verbs (behaviors). Any advanced set of technology will have a dual use with the potential for both good and evil. For example, encryption keeps your customers’ communications private, but it also keeps your adversaries command and control channels private too. The software distribution system you use for updates across your enterprise can also be used as malware distribution by your adversary. In both examples, the thing (or noun) has not changed, but (the verb) behavior has.

A Deterministic Approach to Defense Can Be a Vulnerability

Any deterministic quality can be a weakness for the attacker or defender. Because Musashi was an expert in all forms, early in a battle, he would exhibit moves that had deterministic responses from a martial arts form in order to determine his opponents move-sets. By seeing how his opponents reacted, he then knew what the optimal dominant strategy was to counter that form and defeat his adversary.

With fighting games, the game itself holds the deterministic qualities. A certain character will have moves that when a player commits to a specific input sequence, they turn control over to the game to complete that move. During this time, the other player will know at least for the next few microseconds, what the future holds and must determine their next move to move the fight towards their advantage. Repetitive and static use of automation is like using the same combos/patterns over and over in a game. It might work well against many of the opponents you face, but if your foe understands how the combo/pattern works and knows how you use it, they can counter it accordingly.

Take a moment to consider the following: What aspect of your processes or automation techniques could a threat actor use against you?  Just because you can automate something for security, does not mean you should. Our systems are becoming more and more automation rich as we move from human-scale operations to machine-scale operations. It is paramount that we understand how to automate safely and not to the advantage of our attackers. Treating your infrastructure as code and applying the appropriate level of testing and threat modeling is not optional.

Defense in Diversity

Security has always claimed that “Defense in Depth” is a dominant strategy. As we enter the world of automated workloads at internet-scale, it has become clear that it is “Defense in Diversity” that wins over depth. When dealing with mechanized attacks, iteration over the same defense a million times is cheap. However, attacking a million defenses that are slightly different is costly.  It then comes down to this: How can you raise the cost to your adversary’s observations and actions without raising the cost equally for the defender?

It is accepted that human beings have a cognitive limit on things like recall, working memory, dimensional space, etc. Operating outside of any one of these dimensions can be viewed as beyond the peripheral cognition of a human. This is important because machines have no problem operating outside these boundaries, which is why I have differentiated certain challenges in this article as human-scale versus machine-scale.

Diversity is the countermeasure to Determinism. Extreme forms of diversity are feasible for machines but infeasible for humans, so we need to be careful in its application in our systems.

By accepting these human-level versus machine-level constraints and capabilities, we need to design automation that has machine-scale diversity and operational capacity while still being able to be operated at the human-scale by the defenders.

Outro

In order to effectively combat an increasingly strategic and varied set of threats, security professionals need to take a page from fighting game players. While repetitive and static use of an effective move or combo might keep some adversaries at a disadvantage, or even defeat some of them outright, at some point, a player is going to come across a foe that not only recognizes those patterns, but also knows how to counter them and effectively punish them, leaving the player defenseless and open for attack. Much like how an e-sports pro can’t just spam the same set of moves to win every fight, security professionals can’t rely on the same static methods over and over again in order to defend their organizations.

I encourage you to take some time to assess your organization’s current approach to security and ask yourself some important questions:

◉ How deterministic are your defense methods?

◉ Are there any methods that you’re currently using that threat actors might be able to abuse or overcome? How would you know threat actors have taken control?

◉ What set of processes are human-scale? (manually executed)

◉ What set of processes are machine-scale? (automated by machines)

The first step to becoming a successful “Tactical Chameleon of Security” is learning to identify what elements of your approach are human-scale problems and which are machine-scale problems.  Recognizing how to efficiently balance the human and AI/ML components in your kit and understanding the advantages each provide will allow you to better defend against threats and allow you to seize victory against whatever foes come your way.

Saturday, 18 July 2020

Unleashing SecureX on a real Cyber Campaign

Cisco Prep, Cisco Exam Prep, Cisco Tutorial and Materials, Cisco Learning, Cisco Certification

There’s so much excitement around the general availability (GA) for SecureX. Let’s take a look under the hood as the industry learns to define what we should all expect from a security platform. And while I have your attention, I am going to attempt to thoroughly explain how SecureX delivers simplicity, visibility and efficiency through a cloud-native, built-in platform with an emerging use case. Here is the problem statement – we want to investigate cyber/malware campaigns impacting your environment and if there are any identified targets by looking at historical events from your deployed security technologies. Every Cisco security customer is entitled to SecureX and I hope you find this use case walk-through helpful. I will also share a skeletal workflow – which you can either run as your own ‘playbook’ or modify to be as simple or complex as your needs merit.

Let’s set the background. Recently we have been made aware that certain Australian government owned entities and companies have been targeted by a sophisticated state-based actor. The Australian Cyber Security Centre (ACSC) has titled these events as “Copy-Paste Compromises” and have published a summary with links to detailed TTPs (tactics, techniques, procedures). The ACSC also published and is maintaining an evolving list of IOCs (indicators of compromise) which can be found here. As far as mitigations, ACSC recommends prioritizing prompt patching of all internet facing systems and the use of multi-factor authentication (MFA) across all remote access services. Also, the ACSC recommends implementing the remainder of the ASD Essential Eight controls. Cisco Security has a comprehensive portfolio of technologies that can provide advanced threat protection and mitigation at scale. My colleague Steve Moros talked about these in his recent blog. However, if you are curious like me, you would first want to understand the impact of the threat in your environment. Are these observables suspicious or malicious? Have we seen these observables? Which endpoints have the malicious files or have connected to the domain/URL? What can I do about it right now?

If you are not in Australia, don’t walk away just yet! The title ‘Copy-Paste Compromises’ is derived from the actor’s heavy use of proof of concept exploit code, web shells and other tools copied almost identically from open source. So you may see some of these in your environment even if you are not being specifically targeted by this campaign. Also you can replace the example above with any other malware/cyber campaign. Typically you will find blogs from Cisco (TALOS) or other vendors or community posts, detailing the TTPs and more importantly the IOCs. In other situations, you might receive IOCs over a threat feed or simply scrape them from a webpage/blog/post. Irrespective with minor tweaks the below process should still work for any of those sources as well. Let’s get started!

Step 1 – Threat Hunting & Response

In this step, I simply copied all the IOCs from the published csv file and put them into the enrichment search box in my SecureX ribbon. This uses SecureX threat response to parse any observables (domains, IPs, URLs, file hashes, etc) from plain text and assign a disposition to each observable. We can see there are 102 observables that have been tagged as clean (3), malicious (59), suspicious (1) and unknowns (39). The unknowns are of higher concern, as the malicious and suspicious observables would hopefully have been blocked, if my threat feeds are working in concert with my security controls. Nonetheless, unless they are of clean disposition, any sightings of these observables in an environment are worth investigating. Also the ACSC will keep adding new observables to their list, as this campaign evolves. That just shows the live nature of today’s cyber campaigns and how important it to stay on top of things! Or you can automate it all, using the workflow I describe in Step 2 a bit later in this blog.

Cisco Prep, Cisco Exam Prep, Cisco Tutorial and Materials, Cisco Learning, Cisco Certification

Figure 1: Observables from Text in SecureX Dashboard

Let’s see if there are any sightings of these observables in my environment and identify any targets. I do this by clicking the “Investigate in Threat response” pivot menu option in the ‘Observables from Text’ pop-up. This brings all the observables into SecureX threat response which then queries integrated security controls (modules) from my environment. In my case, 5 modules including Umbrella and AMP, had responses. I can quickly see any historical sightings, both global, and local to my environment.

Cisco Prep, Cisco Exam Prep, Cisco Tutorial and Materials, Cisco Learning, Cisco Certification

Figure 2: Threat Hunting with SecureX threat response

There are few things to take note of in the screenshot above. The horizontal bar on top breaks down the 102 observables from ACSC into 9 domains, 31 file hashes, 44 IP addresses, 6 URLs and email addresses. I can now expand to see dispositions of each of them. The Sightings section (top right) gives me a timeline snapshot of global sightings and most importantly the 262 local sightings of these observables in my environment over the last few weeks. And an important detail on the top left we have 3 targets. This means that 3 of my organization’s assets have been observed having some relationship with one or more of the observables in my investigation. I can also investigate each observable more deeply in the observables section (bottom right). The relations graph (bottom left) shows me any relationships between all the 102 observables and the 3 targets. This helps me identify ‘patient zero’ and how the threat vector infiltrated my environment and spread.

Let’s expand the relations graph to get a closer look. I can apply various filters (disposition, observable type, etc.) to figure out what is going on. I can also click on any observable or target, both in relations graph as well as anywhere else in the SecureX/Threat Response user interface‑to investigate it further using threat intelligence or pivot into related Cisco Security products for a deeper analysis. Once I have completed the analysis, I can start responding to the threat, from the same screen. With a few clicks in the SecureX/Threat Response user interface, I can block any of the observables in the respective Cisco Security products (files in Cisco AMP, domains in Cisco Umbrella, etc.) and even isolate infected hosts (in Cisco AMP) to prevent further spread. I can also go beyond the default options and trigger pre-configured workflows (explained in next section) to take action in any other security product (Cisco or 3rd party) using the power of APIs/adapters. This is the illustrated by the ‘SecureX Orchestration Perimeter Block’ workflow option in below screenshot amidst other analysis/response options.

Cisco Prep, Cisco Exam Prep, Cisco Tutorial and Materials, Cisco Learning, Cisco Certification

Figure 3: Incident Response with a click

So far, using SecureX threat response, we have simplified the threat hunting and response process. We were able to take all the ACSC observables, run them through various threat feeds and historical events from our security controls, while avoiding the need to jump through each security product’s user interface. We have avoided “the swivel chair effect”, that plagues the security industry!

Step 2 – Orchestrating it all with a workflow

While we achieved a lot above using the power of APIs, what if we could further minimize the human intervention and make this an automated process. SecureX orchestrator enables you to create automated workflows to deliver further value. The workflow below can be modified for any IOC source, including the TALOS Blog RSS Feed, however in this case we are going to use the ACSC provided IOC csv file.

I’d like to credit my colleague Oxana who is deeply involved with our devnet security initiatives for the actual playbook I am about to share below. She is very comfortable with various Cisco Security APIs.

Here is the generic workflow:

Cisco Prep, Cisco Exam Prep, Cisco Tutorial and Materials, Cisco Learning, Cisco Certification


Figure 4: the Workflow

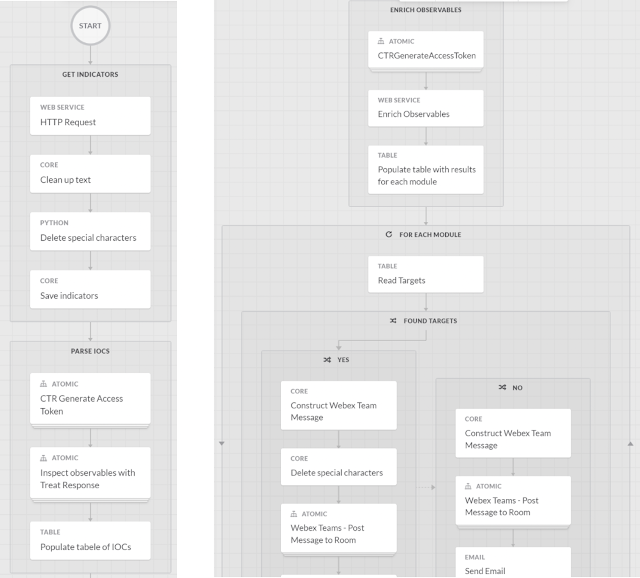
The workflow itself is fairly straightforward. It uses SecureX threat response APIs for the bulk of the work. For notifications we chose Webex APIs and SMTP, but this can be replaced with any collaboration tool of choice. The steps involved are as follows:

1. Get Indicators – by making a generic http request to ACSC hosted IOC csv file (or any other source!), do some clean up and store the raw indicators as text
2. Parse IOCs – from raw text stored in step 1, using SecureX threat response Inspect API
3. Enrich Observables – with SecureX Threat Response Enrich API to find any global sightings (in my integrated threat feeds) and more importantly local sightings/targets (in my integrated security modules like Umbrella, AMP, etc.)
4. Notify – if any targets found (from local sightings). For each queried module, post the targets on Webex teams and/or send an email.
5. Case Management – by creating a new casebook the first time any targets are found. On subsequent runs keep updating the casebook if targets found.

Here are some screenshots of the workflow in SecureX orchestrator. It is a bit difficult to fit in one screen, so you get 3 screenshots!

Cisco Prep, Cisco Exam Prep, Cisco Tutorial and Materials, Cisco Learning, Cisco Certification

Cisco Prep, Cisco Exam Prep, Cisco Tutorial and Materials, Cisco Learning, Cisco Certification

Figure 5: Workflow in SecureX orchestrator

It is possible to further improve this workflow by adding a schedule, so that workflow runs every few hours or days. This may be useful as ACSC keeps updating the indicators regularly. Another option could be to build in response options (with or without approval) using the SecureX threat response API. These are just ideas and the possibilities are limitless. SecureX orchestrator can be used to modify this workflow to run any API action for notifications and responses, both on Cisco and 3rd party products. Simply use the built in API targets or create new ones (eg. for 3rd party products), add any variables and account keys and just drag and drop the modules to build logic into your workflow. Essentially, we have given you the power of workflow scripting in a drag and drop UI. Every environment is different and so we will leave it for the readers to improve and adapt this workflow to their individual needs. Lastly as mentioned before, you can also use this workflow for extracting observables from any other web sources and not just the ACSC Copy Paste Compromises IOC list. To achieve this just modify the “ACSC Advisory Target” under Targets.

Cisco Prep, Cisco Exam Prep, Cisco Tutorial and Materials, Cisco Learning, Cisco Certification

Figure 6: Modifying the observables source

The above workflow is hosted on github here. You can import it into your own SecureX orchestrator instance as a json file. Before you go through the import process or when you run the workflow, you will need to provide and/or adjust variables like the Webex token, Webex teams room id and email account details.

Cisco Prep, Cisco Exam Prep, Cisco Tutorial and Materials, Cisco Learning, Cisco Certification

Figure 7: Adding the notification variables

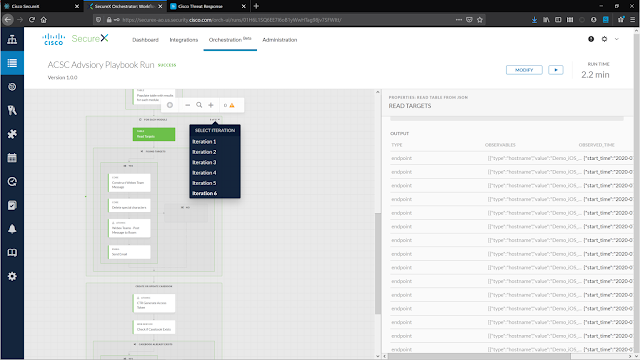
Lastly when you run the workflow, you can see it running live, the input and output of every module and every ‘for’ loop iteration. This allows easy troubleshooting of things from the same friendly graphical interface!

Cisco Prep, Cisco Exam Prep, Cisco Tutorial and Materials, Cisco Learning, Cisco Certification

Figure 8: Running the workflow in SecureX orchestrator

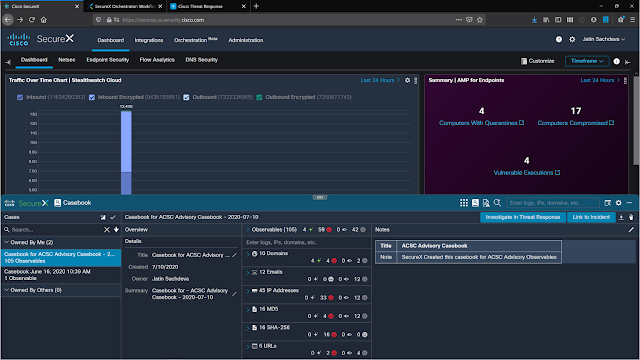
After running the playbook, you should see email notifications or Webex Teams messages, indicating targets found (or not) for each queried module. You should also see a case by selecting “Casebook” on the SecureX ribbon on the SecureX dashboard.

Cisco Prep, Cisco Exam Prep, Cisco Tutorial and Materials, Cisco Learning, Cisco Certification

Figure 9: Webex Teams notifications on local sightings and targets

Cisco Prep, Cisco Exam Prep, Cisco Tutorial and Materials, Cisco Learning, Cisco Certification

Figure 10: Casebook in SecureX dashboard

If you are a Cisco Webex Teams customer, simply login and get your personal webex access token to use in the workflow from here. To get the room id for the Webex Teams room that will be used for notifications from the workflow, add roomid@webex.bot to the room and it will reply to you with a private message containing the room id. Oxana has documented everything needed to get the workflow going in the readme file.