Thursday 18 March 2021

DCNM SAN Insights: Deep Fabric Visibility with Scalable Self-Learning Technology

As tradition, I had my paid time off during Xmas holidays. When back, I realized Cisco product development team had not slowed down their efforts to ameliorate and update existing products. One point in case is Cisco Datacenter Network Manager for SAN, DCNM-SAN for friends. The newly posted DCNM 11.5 release includes an enhancement about the validated scalability of one specific attribute that will make many users happier. Since I have not seen this specific enhancement explained and extolled anywhere else, I’ll try to offer my view on this.

Cisco SAN Analytics feature

All 32G Fibre Channel fabric switches and directors in the Cisco MDS 9000 family offer the SAN Analytics feature. This industry unique technology only inspects the Fibre Channel and SCSI/NVMe headers, not the payload, and so it is in agreement with GDPR requirements. The switch will process this data and then push the resulting metrics information out the management port. The relevant feature is known as SAN Telemetry Streaming (STS) and it uses the gRPC opensource API, based on HTTP/2 transport and gPB encoding format.

Cisco DCNM SAN Insights

Cisco DCNM for SAN includes a feature called SAN Insights. Essentially it enables DCNM to complement and enhance the SAN Analytics capability on network devices. In simple terms, DCNM SAN Insights enables DCNM to perform the following four tasks:

◉ a scalable receiver for data pushed out of MDS 9000 switches via STS

◉ a long term repository for the received data

◉ a post-processing engine for the received data

◉ an intuitive visualization tool for the processed data

Cisco Prep, Cisco Preparation, Cisco Tutorial and Material, Cisco Learning, Cisco Guides, Cisco Career

Let’s talk about self-learned I/O flows


But what kind of data is streamed out of MDS 9000 switches and received, stored, processed and displayed by DCNM SAN Insights? Well, essentially it is a massive collection of all the I/O flows traversing the Fibre Channel SAN and their associated 70+ metrics like latency, I/O size, outstanding I/Os, IOPS, throughput, CRC errors and many others. All that data is continuously collected in almost real time and can be accessed in its entirty via the NX OS CLI or some script (on-switch approach). It is a lot of data, in the form of database records and tables, possibly too much for a human being to consume and digest in an easy way.

An alternative method wants MDS 9000 switches to stream the collected data out the management ports every 30 seconds (off-switch approach) and toward an external receiver. This is where DCNM SAN Insights makes the magic: it turns an elephant of data into nice charts that administrators can easily interpret. Of course, some basic knowledge of the Fibre Channel protocol and block storage transactions in general are welcome.

Cisco Prep, Cisco Preparation, Cisco Tutorial and Material, Cisco Learning, Cisco Guides, Cisco Career

There is no unique definition of an I/O flow over a Fibre Channel network but the easiest way to get it is by describing an I/O flow as a combination of Initiator-Target-LUN (ITL) identifiers. When using the emerging NVMe/FC protocol, that would become Initiator-Target-Namespace (ITN). A single MDS 9000 switch port can so provide visibility for many I/O flows, even thousands of flows when it is an E_port (ISL).

Cisco Prep, Cisco Preparation, Cisco Tutorial and Material, Cisco Learning, Cisco Guides, Cisco Career

Let’s make an example and fix the concept in memory. Imagine a host (Initiator) zoned 1:1 with a single all flash array port (Target) where 30 LUNs are configured and exposed to that host. On the switch port connected to the host, we would see 30 ITL flows (1x1x30). Now imagine you have many hosts and many targets and even more LUNs so you can work out your math. Depending on number of ports and other configuration parameters, a real world SAN can transport from a few hundreds to many thousands of I/O flows. With DCNM SAN Insights adoption now being so strong within datacenters of any size, I would not be surprised if we would find situations where more than 200,000 I/O flows are present and need to be monitored. In my personal (and limited) experience with this unique capability, majority of customers today seem to have between 2,000 and 40,000 I/O flows running at the same time.

These numbers are even more impressive when you consider that all those I/O flows are automatically discovered by the switches, self-learned. It would be clearly impossible to configure them all manually. At the same time, it would be a bit useless to instruct the switches to monitor just a small subset of them, because we would miss data that could be crucial for an effective troubleshooting activity. The fact I/O flows are automatically discovered is very important because it makes SAN Analytics a proactive troubleshooting tool and not just a reactive one. DCNM SAN Insights builds upon the power of SAN Analytics, adding the ease of use that network administrators love.

Scale matters


All this said and explained, I’m now ready to share more about the recent DCNM enhancement that was the reason for me to write this blog. All data about I/O flows and their metrics are streamed out of MDS 9000 switches toward the external receiver. As a result, the receiver should be able to survive this data deluge. With DCNM 11.5, the tested and officially supported scale limit has been raised up to 60,000 simultaneous self-learned flows with 70+ metrics each, 3 times higher than previous release, and good enough for the majority of deployments.

Cisco is constantly working with customers to gather their input and analyze their real-world storage networks to understand the needs of the solution, while at the same time working to ensure the products can support those requirements. Cisco SAN Analytics is a comprehensive product solution that has the ability to generate up to 2.8 million data points every 30 seconds from a single director. At that rate, being able to consume and process that data in a meaningful manner is quite a tough job. It is not a sprint to the most metrics but rather a marathon to make sense out of the data that you have available over a reasonable amount of time. It is from this marathon with the elephant of data that we can gain actionable insights into real-world storage performance. This forms the basis for the value that DCNM SAN Insights provides. In the end, we all agree elephants are best at marathons, not sprints, right?

Hopefully it is now clear that scale matters. Dealing with one I/O flow at a time is not super-complex but dealing with thousands of I/O flows simultaneously is a totally different kind of animal. DCNM 11.5 release has just made an important step in that direction.

Cisco DCNM is a powerful and comprehensive management tool covering day0, day1 and day2 operations. It has always scored a high success in supporting the management and monitoring needs of Cisco customers for datacenter networking products. With its SAN Insights feature, it has augmented its value by also providing long-term trending, end-to-end correlation, advanced analytics (like automatic learning of the performance), automatic baseline calculations, automatic categorization of flows in colored buckets as per their health, dashboards for top talkers or slowest nodes and so on.

A nice overview of the top 10 use cases for DCNM SAN Insights can be found in this video:


Source: cisco.com

Wednesday 17 March 2021

Securing industrial networks: What is ISA/IEC 62443?

Cisco Prep, Cisco Tutorial and Material, Cisco Learning, Cisco Guides, Cisco Preparation

Cyber attacks targeting industrial networks increased by 2000% from 2018 to 2019. Attacks on operational technology (OT) can interrupt production and revenue, expose proprietary information, or taint product quality. They can even put employees in harm’s way or damage the environment. Attacks on critical infrastructure—water, power, and transportation—can inflict devastating effects on the economy and public health.

Barriers to industrial cybersecurity

Securing industrial operations is now top of mind. But converting good intentions to action can be challenging, for two main reasons. First, industrial networks are often managed by OT teams that don’t have advanced cybersecurity skills. They might also be concerned that the IT team will take actions that reduce operational uptime. Unlike a 2-hour outage to an email server, whose costs are measured in lost productivity and annoyance, a 2-hour unplanned outage to an assembly line can bring output and revenue to a halt.

The other barrier is not knowing where to start. Industrial networks are very complex. Should you start by adding cybersecurity controls to the easiest systems to protect, for a quick win, or to the most critical systems? Does the bigger payoff come from segmenting the network? Detecting anomalous activity? Authorizing users? Something else?

Framework for stronger cybersecurity with nominal disruption

Fortunately, the International Society of Automation (ISA) put together the ISA99 set of standards for building secure industrial automation and control systems (IACS). The International Electrotechnical Commission (IEC) built on that work to introduce IEC 62443.

Some think the ISA/IEC 62443 set of standards is too detailed and complex. We at Cisco like it because it gives IT and OT common ground to work together. It’s a framework to implement industrial cybersecurity best practices step by step, for continuous improvement. The standard defines a secure network architecture, functional requirements, and guidelines to measure your maturity level for each requirement. OT contributes its knowledge about which assets need to communicate and how critical they are, and IT contributes its cybersecurity expertise and technology.

The standards lay out a four-step framework:

1. Take an asset inventory. You can’t secure an asset unless you know it exists. The first step is for the OT team to list all assets and rank their criticality to operations. Invest the most in the most critical assets.

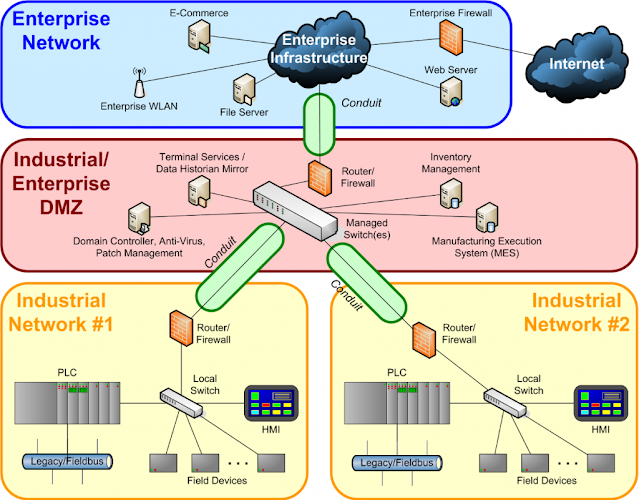
2. Define zones. A zone is a group of devices with similar security requirements, a clear physical border, and the need to talk to each other (figure 1). Imagine a plant with one production line for welding and another for painting. There’s no need for the machines in the two lines to communicate, so all machines in production line 1 would be in one zone, and all machines in production line 2 would be in another. Segmenting the network into zones contains damage if the network is attacked.

3. Define conduits. These are the communications links between zones that must talk to each other. In the plant floor example, both zones need to talk to a supervisory console. Call that zone 3. One conduit connects zone 1 and 3, and another connects zone 2 and 3. No need for a conduit between zones 1 and 2. Once IT and OT have defined zones and conduits, network deployment and security enforcement become straightforward.

Cisco Prep, Cisco Tutorial and Material, Cisco Learning, Cisco Guides, Cisco Preparation
Figure 1: IEC 62443 zones and conduits isolate threats

4. Add controls for each zone. Start with the zones containing equipment used for your most critical processes. For each zone, add controls as time and budget permits—for user control, data integrity, data confidentiality, restricted data flow (that’s where conduits come in), timely response to security events, and maintaining resource availability during denial-of-service attacks. The IEC 62443 defines four levels of maturity for zones. At a given time, some of your zones might be at maturity level 1 (most basic) while others are at levels 2, 3, 4, or 5 (most mature).

Significantly, the IEC 62443 doesn’t call the highest maturity level “mature” or “advanced.” Instead, the highest maturity level is “improving,” highlighting the fact that cybersecurity is never done. To stay ahead of ever-more-sophisticated attacks, OT and IT teams should plan to continually strengthen protection.

Source: cisco.com

Tuesday 16 March 2021

Get Ready to Explore gRPC in the DevNet IOS XR Always-on Sandbox

Cisco Exam Prep, Cisco Learning, Cisco Certification, Cisco Preparation, Cisco Tutorial and Material

"message blog { message content { string yang = 1; string gRPC = 2; } message author { string stuart_clark = 1; } }

We are always looking to deliver more at DevNet. Our fierce developer community is always learning, always coding, and we want to help them grow and learn the skills that will equip them in their roles now and for the next five years. Our DevNet sandbox has been a success for many developers, to get hands-on and explore Cisco platforms and APIs. So, when we asked to enable gRPC on our IOS XR always-on sandbox, of course, we said, ‘let’s do it’. 

What is gRPC? 

gRPC is a modern, lightweight communication protocol from Google. gRPC is a high-performance, open-source, universal RPC framework that can run in any environment.  

Protocol buffers, or Proto, are Google’s language-neutral, platform-neutral, extensible mechanism for serializing structured data – think XML, but smaller, faster, and simpler. It is based on protocol buffers, an open-source mechanism for serializing structured data, which is language and platform-neutral. You define the structure using protocol buffer message types in .proto files. Each protocol buffer message is a small logical record of information, containing a series of name-value pairs. XR devises ship with the YANG files that define the data models they support. Using a management protocol like gRPC, you can programmatically query a device for the list of models it supports and retrieves. gRPC encodes requests and responses in binary. gRPC is extensible to other content types along with Protobuf. The Protobuf binary data object in gRPC is transported over HTTP/2. 

gRPC supports distributed applications and services between a client and server. gRPC provides the infrastructure to build a device management service to exchange configuration and operational data between a client and a server. The structure of the data is defined by YANG models. 

◉ Efficient: Protocol buffers are verbose and descriptive. But they are smaller, faster, more efficient, and provide high performance. 

◉ Machine Readable: Protocol buffers are binary or machine-readable and can be used to exchange messages between services and not over browsers. 

◉ Generators: With a compiler, Protocol buffers can be easily compiled to source code along with runtime libraries for your choice of programming language. This makes serialization or deserialization easier, with no need for hand parsing. 

◉ Supports Types: Unlike JSON, we can specify field types and add validations for the same in the. proto file. 

Getting started with gRPC on the DevNet Sandbox 

Always-on Sandbox we are mapping the inbound port 19399 to 57777. The first thing we need to do is ensure that the IOS XR sandbox has gRPC enabled. Here is the configuration required with `tls` disabled.  

Cisco Exam Prep, Cisco Learning, Cisco Certification, Cisco Preparation, Cisco Tutorial and Material

To make this simple you can clone this sample code and install the requirements. The package contains a library with the methods that are available to use over gRPC with IOS-XR boxes after 6.0.0. The API has several methods which allows a user to send simple RPC commands such as get and push using YANG and JSON. 

The repo consists of two main components: 

◉ The compiled pb2 file from the proto definition. 
◉ A Python module accessing the pb2 file with the library bindings. 

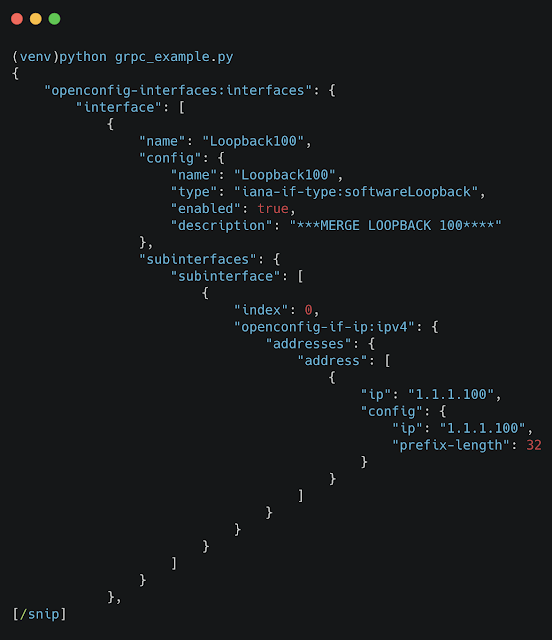
To get all the interfaces from the Always-on Sandbox IOS-XR device, we can run this small piece of code derived from OpenConfig YANG models, and serialize this as JSON. Change to into the examples directory and run the following code, this uses the YANG model. https://github.com/YangModels/yang/blob/master/vendor/cisco/xr/653/openconfig-interfaces.yang and will print all the interface from the Always-on Sandbox IOS-XR device in the `json` format. 

Cisco Exam Prep, Cisco Learning, Cisco Certification, Cisco Preparation, Cisco Tutorial and Material

Code Example “Configure, update, and delete BGP“ 

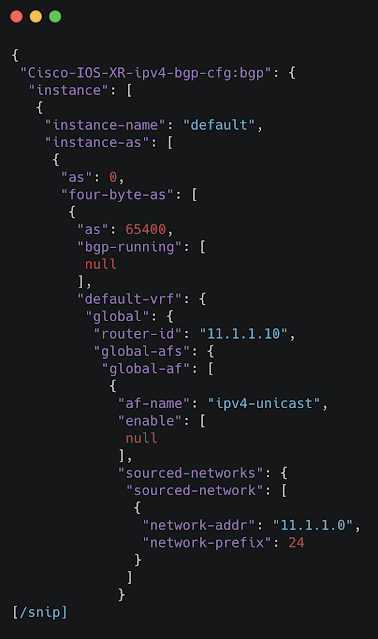
This next code uses the JSON below and is based off the YANG model provided by Cisco: https://github.com/YangModels/yang/blob/master/vendor/cisco/xr/653/Cisco-IOS-XR-ipv4-bgp-cfg.yang You can walk through the hierarchy using pyang, and create a JSON model similar to the example below. https://github.com/mbj4668/pyang/wiki/TreeOutput This JSON model is for a BGP configuration. We can see that it is defining a BGP instance and a single neighbor. 

Cisco Exam Prep, Cisco Learning, Cisco Certification, Cisco Preparation, Cisco Tutorial and Material

This code uses Object-Oriented Programming (OOP). This is a programming paradigm where different components of a computer program are modelled after real-world objects. An object is anything that has some characteristics and can perform a function. All args used in the running of the code are handled using Click. Click is a Python package for creating beautiful command line interfaces in a composable way with as little code as necessary. From the example’s directory run the following: 

GetConfig – Retrieves configuration data. Takes model path in JSON format as input argument. Returns configuration data in JSON format and an error string. 

◉ MergeConfig – Merge’s configuration data. Takes modelled data in JSON format as input argument. Returns error string. 

◉ DeleteConfig – Deletes configuration data. Takes modelled data in JSON format as input argument. Returns error string. 

◉ ReplaceConfig – Replaces configuration data. Takes modelled data in JSON format as input argument. Returns error string. 

Cisco Exam Prep, Cisco Learning, Cisco Certification, Cisco Preparation, Cisco Tutorial and Material

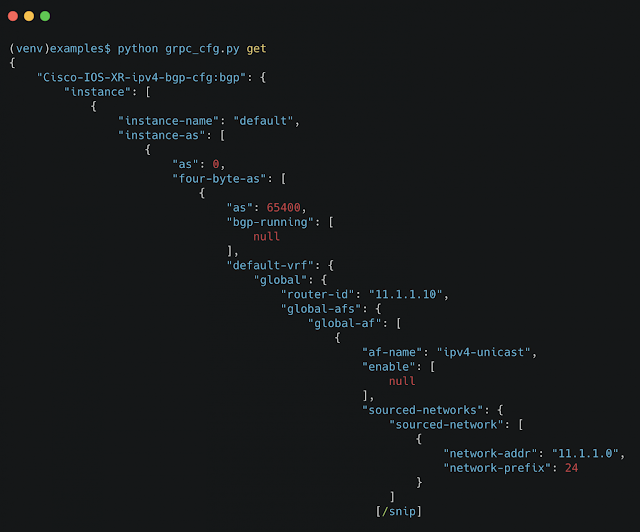
Start with a ‘get.’ This will look at the Always-on Sandbox IOS-XR device configuration and return that BGP is not configured (note that this is an Always-on Sandbox and that other users might be using this or there could be stale configurations on the device).

Cisco Exam Prep, Cisco Learning, Cisco Certification, Cisco Preparation, Cisco Tutorial and Material

Next, add a base BGP config using the JSON file we looked at before, using python grpc_cfg.py replace

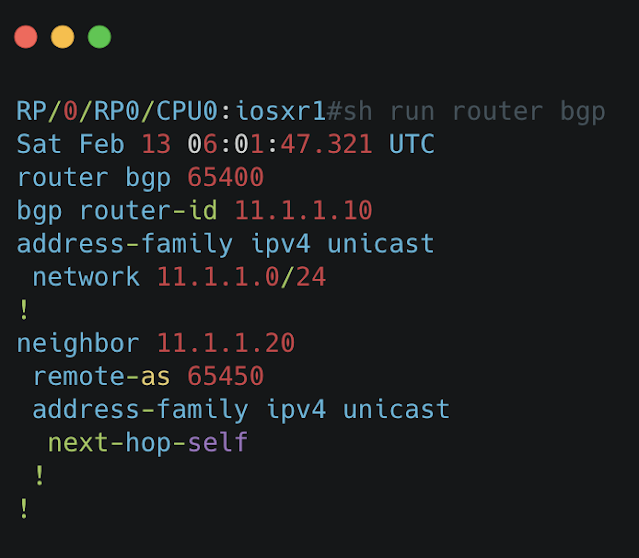
If we logged into the Always-on Sandbox IOS-XR device, we would now see one neighbor configured. 

Cisco Exam Prep, Cisco Learning, Cisco Certification, Cisco Preparation, Cisco Tutorial and Material

However, we can use the ‘get’ function once again to see this.

Cisco Exam Prep, Cisco Learning, Cisco Certification, Cisco Preparation, Cisco Tutorial and Material

If this worked correctly you should see the JSON file we looked at, and the response from the get should be identical. Now, use a merge request to add another neighbor with the second JSON file. 

Cisco Exam Prep, Cisco Learning, Cisco Certification, Cisco Preparation, Cisco Tutorial and Material

The resulting config should be the first config plus the second. Or in other words, there are two neighbors defined. This can also be seen by running the python grpc_cfg.py get file once more. 

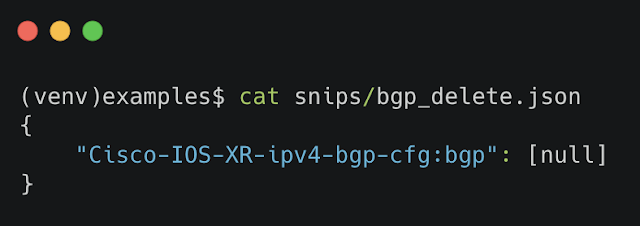
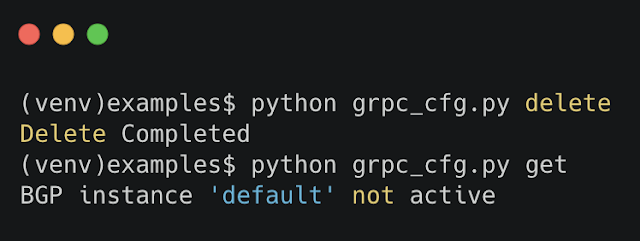
To delete the configuration, we can send an empty JSON file, followed by the get file to confirm that BGP is no longer configured/active. 

Cisco Exam Prep, Cisco Learning, Cisco Certification, Cisco Preparation, Cisco Tutorial and Material

Cisco Exam Prep, Cisco Learning, Cisco Certification, Cisco Preparation, Cisco Tutorial and Material

Sunday 14 March 2021

Threat Landscape Trends: Endpoint Security, Part 2

Threat Landscape Trends, Cisco Tutorial and Material, Cisco Learning, Cisco Certification, Cisco Career

Part 2: LOLBins, operating systems, and threat types

Being aware of what’s occurring on the threat landscape can be a valuable tool when it comes to defending your organization. If you’re well informed, that puts you in a good position to decide how best to protect your assets and allocate resources accordingly. While it’s important to stay up to date with the latest ground-breaking attack techniques and new threats, it’s equally important to keep abreast of the overall trends.

The fact is that, for every novel technique discovered, there are countless attacks taking place in the same time frame that use well-known and well-trodden tactics. For every attack carried out by a nation state, there’s a dozen million-dollar ransomware attacks that started with a simple phishing email.

This is why watching the trends is so important: it provides a view of what you’re most likely to encounter. This is the purpose of this new blog series, Threat Landscape Trends. In it, we’ll be taking a look at activity in the threat landscape and sharing the latest trends we see. By doing so, we hope to shed light on areas where you can quickly have an impact in defending your assets, especially if dealing with limited security resources.

In Part 1, we took a look at critical severity threats and MITRE ATT&CK tactics that were spotted by the Indication of Compromise (IoC) feature in Cisco’s Endpoint Security solution. In this second part, we’re going to step back and look at a larger swath of the IoC alerts to see what’s most frequently encountered.

The methodology remains the same as in Part 1, which we provide again at the end of this blog. In a nutshell, the data presented here is similar to alerts you would see within the dashboard of Cisco’s Endpoint Security solution, only aggregated across organizations. This time we rank the IoCs that organizations have encountered grouped by particular topics. The data set covers the first half of 2020, from January 1st through June 30th.

Signal from Noise

According to Cisco’s 2020 CISO Benchmark Report, one of the biggest issues IT folks face is alert fatigue. Of the respondents that claim they suffer from such fatigue, 93 percent said they receive at least 5,000 alerts per day. In circumstances like this, it’s absolutely critical to be able to derive what’s important from what can be discarded.

As we showed in Part 1, the vast majority of alerts fall into the low and medium severity categories (35 and 51 percent, respectively). It may be tempting to discount lower severities outright. Indeed, in some circumstances, this may be the correct course of action.

For instance, some of the more common low severity IoCs, like running PsExec as an administrator or stopping the firewall with NetSh, may on occasion trigger on activities carried out by IT administration—whether or not these are considered best practices. While not an attack, these sorts of alerts may be worth having a conversation about with the IT department, when time allots.

However, the significance of an alert shouldn’t be based on the severity alone. Under some circumstances, low severity alerts can be just as concerning as a critical severity alert. The trick is to figure out the context surrounding them. What happened before and after an alert? Are there other lower-severity alerts in the same time frame? Stringing together a series of suspicious alerts can give a much clearer picture of potential attacks that may only alert on lower severity IoCs.

For example, let’s say an attacker sends a phishing email to your organization. If the recipient opens the Word attachment, a macro contained within launches a script (triggering the IoC W32.WinWord.Powershell.ioc). The script in turn runs encoded PowerShell commands (W32.PowershellEncodedBuffer.ioc) to set the stage to download further malicious code (W32.PowershellDownloadString.ioc).

This scenario is comprised entirely of low- and medium-severity IoCs. Each of these by themselves do not necessarily point to an attack, but when viewed as a string of IoCs, it’s very unlikely that these would be associated with anything but malicious activity. At the end of the day, the idea with the lower IoC categories is that they indicate activity within your environment that should be investigated, especially if IT says they didn’t do it.

With this in mind, in the metrics that follow we’ll look at medium, high, and critical-severity IoCs. This is because, while low-severity IoCs are critical when looking at a series of alerts appearing in sequence, individually they can muddy the waters when analyzing larger malicious trends across organizations. Filtering out these IoCs ensures that the activity that we’re focusing on is actual malicious activity, as opposed to a round-about administrative solution.

So, without further ado, let’s have a look at more threat landscape trends, covering LOLBins, OSes, and other threats.

LOLBins

Utilizing the tools built into operating systems is a very common attack tactic these days. Leveraging such readily available binaries decreases the chances that an attacker will be discovered, compared to custom-tailored malicious tools that can stand out. Using readily available tools for malicious activity is generally referred to as “living off the land,” and the binaries utilized are called LOLBins. 

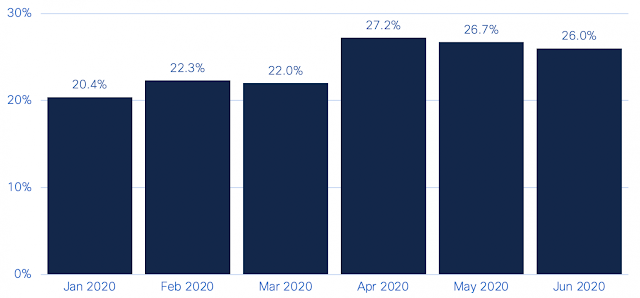
The use of LOLBins appears to be quite common for malicious activity, based on alerts seen during the first half of 2020. In our research, 20-27 percent of the IoC alerts organizations encountered at least once in a given month were related to suspicious LOLBin activity.

Threat Landscape Trends, Cisco Tutorial and Material, Cisco Learning, Cisco Certification, Cisco Career
Percentage of IoC alerts organizations encountered related to suspicious LOLBins.

What’s notable is the five percent jump witnessed in April. This is primarily due to activity related to an adware application called Browser Assistant. This adware generally injects JavaScript into web browsers to display advertisements. During April, Browser Assistant was seen using PowerShell to load itself into memory without launching files (using reflective DLL injection, to be specific). This is highly suspect, being a technique often used by fileless malware.

Two LOLBins in particular appear to dominate the top LOLBin IoCs seen: PowerShell and the Windows Scripting Host (covering both WScript and CScript). Both of these LOLBins facilitate the execution of scripts within the Windows operating system.

Threat Landscape Trends, Cisco Tutorial and Material, Cisco Learning, Cisco Certification, Cisco Career
Top LOLBin IoCs

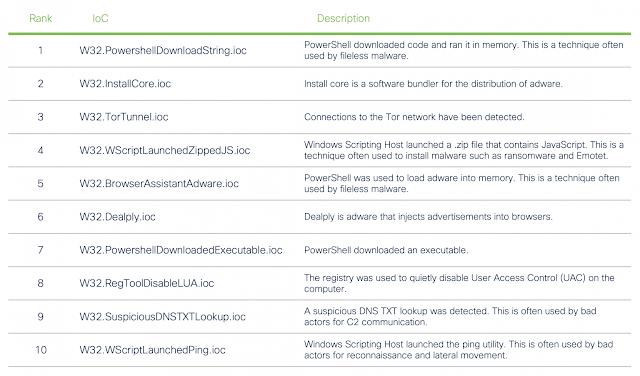
Overall, PowerShell is involved in five of the top ten IoCs seen relating to LOLBins, comprising around 59 percent of all LOLBin alerts. In many cases, PowerShell is used to download malicious code into memory or download further executables. The Windows Scripting Host is often leveraged to launch malicious files, perform reconnaissance, move throughout the network, or contact remote locations. The Windows Scripting Host made up 23 percent of all LOLBin alerts.

What’s interesting in looking at the malicious use of these native binaries is that bad actors often leverage one LOLBin to launch another. This is clear with the eighth and tenth entries in our list and can be seen in other IoCs beyond the top ten. Malicious actors likely swap LOLBins during an attack in order to hide their tracks.

Top OS IoCs


Let’s take a look at the two primary desktop operating systems, Windows and macOS, to see how attackers are targeting them.

Windows

Naturally, PowerShell makes its presence known, with appearances in three IoCs in the top ten. The Windows Scripting Host appears twice as well, showing just how prevalent LOLBins are in the Windows environment. In all, half of the top 10 IoCs on Windows use LOLBins.

Threat Landscape Trends, Cisco Tutorial and Material, Cisco Learning, Cisco Certification, Cisco Career
Top Windows IoCs

Adware also appears quite prominently on Windows, with three adware installers and ad-injecting IoCs making the top 10. However, these IoCs should not be taken lightly for being adware. These instances are some of the more egregious adware installers, often going well beyond what is considered a legitimate install process.

Other activities of note include:

◉ The presence of The Onion Router (TOR) connections ranks highly. TOR can feasibly be used to allow encrypted traffic through firewalls, at best to get around IT policies, and worst for data exfiltration.

◉ Quietly disabling UAC via the registry is something an attacker might do in order to run malicious code that requires elevated privileges.

◉ Using NSlookup to send DNS TXT queries is a technique often used by bad actors for C2 communication.

MacOS

Adware appears quite frequently on macOS as well, comprising four of the top ten IoCs seen. What’s interesting is that LOLBins don’t appear as frequently here as they do on Windows. Instead, attackers are likely to hide their presence by disabling the security programs, excluding their files from quarantine, clearing command histories, and hiding files.

Threat Landscape Trends, Cisco Tutorial and Material, Cisco Learning, Cisco Certification, Cisco Career
Top macOS IoCs

Threat categories


Finally, let’s home in on some specific threat types. Here is a closer look at four key types of threats currently seen on the threat landscape.

Ransomware

The most common IoC alert seen relating to ransomware is the deletion of shadow copies, which are snapshots of the file system used by the Windows operating system for backups. Ransomware threats often delete these files to prevent encrypted files from being restored from local backups. This particular IoC comprised 66 percent of all ransomware-related IoC alerts.

Threat Landscape Trends, Cisco Tutorial and Material, Cisco Learning, Cisco Certification, Cisco Career
Top Ransomware IoCs

It’s also worth noting that ransomware often uses the Windows Scripting Host to execute a .zip file that contains malicious JavaScript. This is a technique used by malicious actors that install ransomware, such as WastedLocker. However, since such zipped JavaScript files are also used in other malicious attacks outside of ransomware, such as email campaigns for Emotet, it is not included in the list above.

Credential Stealing

The most commonly encountered credential stealing tool, Mimikatz, was featured in Part 1 of our look at Endpoint Security related trends. At 28 percent, this critical-severity, credential-dumping tool topped other regularly used techniques, likely for the all-in-one approach that the tool offers.

Apart from Mimikatz, malicious actors were seen utilizing the Findstr utility on files, digging through LSASS, and combing through the registry in order to find credentials.

Threat Landscape Trends, Cisco Tutorial and Material, Cisco Learning, Cisco Certification, Cisco Career
Top Credential Stealing IoCs

Adware

Adware features heavily on both Windows and macOS operating systems. Adware appearing in the top five generally behave in a manner closer to malware than a simple annoyance of showing you an unexpected advertisement.

Threat Landscape Trends, Cisco Tutorial and Material, Cisco Learning, Cisco Certification, Cisco Career
Top Adware IoCs

Cryptomining

While cryptomining doesn’t currently feature heavily in overall IoC lists, the most common activities seen include regular activity associated with cryptomining, such as submitting and requesting work from a cryptomining server or wallet-related activity. However, instances of fileless cryptominers and attempts to stop other miners feature in the top five as well.

Threat Landscape Trends, Cisco Tutorial and Material, Cisco Learning, Cisco Certification, Cisco Career
Top Cryptomining IoCs

How to defend


While no doubt interesting, the information in this blog can also double as a blueprint for a plan of defense. This is especially important if working with limited resources, when prioritizing defensive actions where they’re most needed is critical. If you’re going to do one thing with this new information to protect your organization, focus your efforts on what consistently crops up in these lists: LOLBins.

Of course, this may be easier said than done, not only because these binaries are baked into the OS, but because many IT organizations utilize them in their daily operations. So how do you differentiate between normal operations and malicious activity? While it’s fairly obvious when some actions are being carried out by bad actors, others are not so clear.

First and foremost, it’s important to ensure you enable adequate logging on systems. The fact is you can’t pinpoint malicious activity if there’s no record of it.

It’s also important to have a clear understanding of the types of commands and activity that you can expect within these logs. Filtering out what you know is being carried out through automation or IT activities will clear out much of the noise, making it easier to drill down into what should be there.

It’s also important look for patterns. Individual activities and commands may not appear malicious on their own, but in the context of a series of commands, ran before and after, a malicious pattern may emerge. Create playbooks that address these patterns and use automation to detect when they trigger.

When it comes to what commands and activities are expected, every organization is different. Establishing your approach often requires the involvement a variety of people from different teams. Establishing those communications will not only help when building out a defensive plan, but can be critical in quickly resolving an incident if one arises.

Methodology


We’ve organized the data set in such a way as to obtain more meaningful trends. First, we’ve aggregated the data by the number of organizations that have received an alert about a particular activity, as opposed to the total number of detections in the given time frame. Charts are broken down by months. This means that an organization can be counted in each month, if they see the activity. Tables cover the full six-month period (January 1, 2020 through June 30, 2020), and organizations encountering an IoC are only counted once in these cases.

A word on privacy

Cisco takes customer privacy very seriously. While Cisco Security products can report telemetry back to us, this is an opt-in feature within our products. To further this end, we’ve gone to great lengths to ensure the data used for this blog series is anonymized and aggregated before any analysis is performed on it.

Saturday 13 March 2021

Migrating PnP API from APIC-EM to Cisco DNA Center

Cisco Prep, Cisco Preparation, Cisco Tutorial and Material, Cisco Learning, Cisco Career

I have had a number of questions about the best way to migrate from APIC-EM to DNA Center for Plug and Play (PnP) provisioning of devices.  The PnP API was very popular in APIC-EM and both the PnP functionality as well as API have been enhanced in DNA Center. While the older workflow style API still exist in DNAC, they are relatively complex and have no UI component.

Transition approaches

I used to have two answers to the “how do I migrate” question. One approach was to transition (just use the workflow API), and the other was to transform (move to the new “site base” API).

Cisco Prep, Cisco Preparation, Cisco Tutorial and Material, Cisco Learning, Cisco Career

If you had static configuration files for devices (e.g. some other tool to generate them) you would typically choose the first option.  If you were more interested in templates with variables, you would choose the second.

There is now a hybrid option, using the new site-claim API, with a “fixed” configuration template.

PnP API


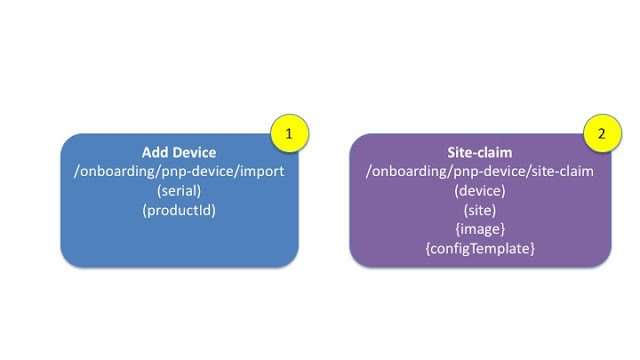
First a look at the PnP API and how they work.  There are two steps, 1) Add a device and 2) Claim a device.
Cisco Prep, Cisco Preparation, Cisco Tutorial and Material, Cisco Learning, Cisco Career

Step one adds the device to the PnP device table.  This can happen in two ways, unplanned (where the device discovers DNA Center), or pre-planned (where the device is inserted into DNA Center).  This step is unchanged from APIC-EM and uses the /import API endpoint.  All that is required is the model of the device and the serial number.

Once the device is part of the PnP table, it can then be claimed.   In the past, the workflow based API used the /claim API endpoint.  The newer /site-claim API endpoint is now recommended.   This requires a device (from step1) and a site.  There are optional attributes for image upgrade and configuration template.

These steps are seen in the UI.  The first device (“pre-planned”) has been added to DNA Center, but not claimed. The second device was added and claimed to a site.  The source of both devices was “User” which indicates they were pre-planned as opposed to “Network” which indicates an un-planned device.

Cisco Prep, Cisco Preparation, Cisco Tutorial and Material, Cisco Learning, Cisco Career

Using the Scripts


These scripts are available on github. The readme has instructions on installing them. The scripts use the dnacentersdk I described in this post.

The first step is to upload the configuration files as templates.  These should be stored in the “Onboarding Configuration” folder.

$ ./00load_config_files.py --dir work_files/configs
Processing:switch1.cfg: adding NEW:Commiting e156e9e6-653d-4016-85bd-f142ba0659f8
Processing:switch3.cfg: adding NEW:Commiting 9ae1a187-422d-41b9-a363-aafa8724a5b2

Second step is to edit a CSV file contain the devices to be uploaded, and the configuration file. This file deliberately contains some errors (missing config file and missing image) as examples.

$ cat work_files/devices.csv 
name,serial,pid,siteName,template,image
adam123,12345678902,c9300,Global/AUS/SYD5,switch1.cfg,cat3k_caa-universalk9.16.09.05.SPA.bin
adam124,12345678902,c9300,Global/AUS/SYD5,switch2.cfg,cat3k_caa-universalk9.16.09.05.SPA.bin
adam_bad_image,12345678902,c9300,Global/AUS/SYD5,switch2.cfg,cat3k_caa-universalk9.16.09.10.SPA.bin

Third step is to use the script to upload the devices into DNA Center. The missing configuration and missing image are flagged.

$ ./10_add_and_claim.py --file work_files/devices.csv 
Device:12345678902 name:adam123 siteName:Global/AUS/SYD5 Status:PLANNED
##ERROR adam124,12345678902: Cannot find template:switch2.cfg
##ERROR adam_bad_image,12345678902: Cannot find image:cat3k_caa-universalk9.16.09.10.SPA.bin
adam_bad_image,12345678902,c9300,Global/AUS/SYD5,switch2.cfg,cat3k_caa-universalk9.16.09.10.SPA.bin
This will be reflected in the PnP page in DNA Center.

Cisco Prep, Cisco Preparation, Cisco Tutorial and Material, Cisco Learning, Cisco Career

Under the Covers


Using the SDK abstracts the API.  For those that want to understand the payloads in more detail, here is a deeper dive into the payloads.

Templates

The following API call will get the projectId for the “Onboarding Configuration” folder.

GET dna/intent/api/v1/template-programmer/project?name=Onboarding%20Configuration
The result will provide the UUID of the project. It also provides a list of the templates, so could be used to find the template.   A different call is required to get the template body, as templates are versioned.  The “id” below is  the master template “id”

[
    {
        "name": "Onboarding Configuration",
        "id": "bfbb6134-8b1a-4629-9f5a-435a13dba75a",
        "templates": [

            {
                "name": "switch1.cfg",
                "composite": false,
                "id": "e156e9e6-653d-4016-85bd-f142ba0659f8"
            },

A better way to get the template is to call the template API with a projectId as a query parameter. It is not possible to lookup a template by name, the only option is to iterate through the list of results.

GET dna/intent/api/v1/template-programmer/template?projectId=bfbb6134-8b1a-4629-9f5a-435a13dba75a

Templates have versions. There is the master template Id, as well as an Id for each version. The example below only has one version “id”: “bd7cfeb9-3722-41ee-bf2d-a16a8ea6f23a”

{
        "name": "switch1.cfg",
        "projectName": "Onboarding Configuration",
        "projectId": "bfbb6134-8b1a-4629-9f5a-435a13dba75a",
        "templateId": "e156e9e6-653d-4016-85bd-f142ba0659f8",
        "versionsInfo": [ 
            {
                "id": "bd7cfeb9-3722-41ee-bf2d-a16a8ea6f23a", 
                "author": "admin",
                "version": "1",
                "versionTime": 1590451734078
            }
        ],
        "composite": false
    }

To get the body of the template (to compare SHA hash), use the template API call, for the specific version.

GET dna/intent/api/v1/template-programmer/template/bd7cfeb9-3722-41ee-bf2d-a16a8ea6f23a
Will return the body. Templates apply to a productFamily and softwareType. These will be used when creating or updating templates.

{
    "name": "switch1.cfg",
    "tags": [],
    "author": "admin",
    "deviceTypes": [
        {
            "productFamily": "Switches and Hubs"
        }
    ],
    "softwareType": "IOS-XE",
    "softwareVariant": "XE",
    "templateContent": "hostname switch1\nint g2/0/1\ndescr nice  one\n",
    "templateParams": [],
    "rollbackTemplateParams": [],
    "composite": false,
    "containingTemplates": [],
    "id": "bd7cfeb9-3722-41ee-bf2d-a16a8ea6f23a",
    "createTime": 1590451731775,
    "lastUpdateTime": 1590451731775,
    "parentTemplateId": "e156e9e6-653d-4016-85bd-f142ba0659f8"
}

To add a new template, there are two steps. The template has to be created, then committed. The second step is the same as updating an existing template, which creates a new version. Notice the deviceTypes and softwareType are required.

POST dna/intent/api/v1/template-programmer/project/bfbb6134-8b1a-4629-9f5a-435a13dba75a/template
{
     "deviceTypes": [{"productFamily": "Switches and Hubs"}],
     "name": "switch4.cfg",
     "softwareType": "IOS-XE",
     "templateContent": "hostname switch4\nint g2/0/1\ndescr nice  four\n"
}

This will return a task, which needs to be polled.

{
       "response": {
                 "taskId": "f616ef87-5174-4215-b5c3-71f50197fe72",
                 "url": "/api/v1/task/f616ef87-5174-4215-b5c3-71f50197fe72"
        },
        "version": "1.0"
}

Polling the task

GET dna/intent/api/v1/task/f616ef87-5174-4215-b5c3-71f50197fe72
The status is successful and the templateId is “57371b95-917b-42bd-b700-0d42ba3cdcc2”

{
  "version": "1.0", 
  "response": {
    "username": "admin", 
    "rootId": "f616ef87-5174-4215-b5c3-71f50197fe72", 
    "serviceType": "NCTP", 
    "id": "f616ef87-5174-4215-b5c3-71f50197fe72", 
    "version": 1590468626572, 
    "startTime": 1590468626572, 
    "progress": "Successfully created template with name switch4.cfg", 
    "instanceTenantId": "5d817bf369136f00c74cb23b", 
    "endTime": 1590468626670, 
    "data": "57371b95-917b-42bd-b700-0d42ba3cdcc2", 
    "isError": false
  }
}

The final step is to commit the change to the template.

POST dna/intent/api/v1/template-programmer/template/version
{
  "templateId": "57371b95-917b-42bd-b700-0d42ba3cdcc2"
}

To update an existing template, it is a PUT rather than POST. Again, the deviceTypes and softwareType are required.

PUT dna/intent/api/v1/template-programmer/template
{
 "deviceTypes": [ { "productFamily": "Switches and Hubs" } ],
 "id": "57371b95-917b-42bd-b700-0d42ba3cdcc2",
 "name": "switch4.cfg",
 "softwareType": "IOS-XE",
 "templateContent": "hostname switch4\nint g2/0/1\ndescr nice four **\n"
}

Again, a task is returned, which needs to be polled.

{
  "version": "1.0", 
  "response": {
    "username": "admin", 
    "rootId": "52689b1e-e9b8-4a60-8ae9-a574bb6b451c", 
    "serviceType": "NCTP", 
    "id": "52689b1e-e9b8-4a60-8ae9-a574bb6b451c", 
    "version": 1590470080172, 
    "startTime": 1590470080172, 
    "progress": "Successfully updated template with name switch4.cfg", 
    "instanceTenantId": "5d817bf369136f00c74cb23b", 
    "endTime": 1590470080675, 
    "data": "57371b95-917b-42bd-b700-0d42ba3cdcc2", 
    "isError": false
  }
}

The final step is to commit the change, as when first creating the template.  The UI will show two versions of this template.

Cisco Prep, Cisco Preparation, Cisco Tutorial and Material, Cisco Learning, Cisco Career

Site

To find the siteId, a simple lookup is used, with the name as a query parameter.  This is the fully qualified name of the site.

GET dna/intent/api/v1/site?name=Global/AUS/SYD5
This will return the siteId.

{
  "response" : [ {
    "parentId" : "ace74caf-6d83-425f-b0b6-05faccb29c06",
    "systemGroup" : false,
    "additionalInfo" : [ {
      "nameSpace" : "Location",
      "attributes" : {
        "country" : "Australia",
        "address" : "177 Pacific Highway, North Sydney New South Wales 2060, Australia",
        "latitude" : "-33.837053",
        "addressInheritedFrom" : "d7941b24-72a7-4daf-a433-0cdfc80569bb",
        "type" : "building",
        "longitude" : "151.206266"
      }
    }, {
      "nameSpace" : "ETA",
      "attributes" : {
        "member.etaCapable.direct" : "2",
        "member.etaReady.direct" : "0",
        "member.etaNotReady.direct" : "2",
        "member.etaReadyNotEnabled.direct" : "0",
        "member.etaEnabled.direct" : "0"
      }
    } ],
    "groupTypeList" : [ "SITE" ],
    "name" : "SYD5",
    "instanceTenantId" : "5d817bf369136f00c74cb23b",
    "id" : "d7941b24-72a7-4daf-a433-0cdfc80569bb",
    "siteHierarchy" : "80e81504-0deb-4bfd-8c0c-ea96bb958805/ace74caf-6d83-425f-b0b6-05faccb29c06/d7941b24-72a7-4daf-a433-0cdfc80569bb",
    "siteNameHierarchy" : "Global/AUS/SYD5"
  } ]
}

Image

To find the imageid, for upgrading software, search for the image by imageName. NOTE, on some platforms this is different to name.

GET dna/intent/api/v1/image/importation?imageName=cat3k_caa-universalk9.16.09.05.SPA.bin
Returns the imageUuid, and a lot of other information about the image, including model numbers etc.

{
    "response": [
        {
            "imageUuid": "04d69fe0-d826-42e9-82c0-45363a2b6fc7",
            "name": "cat3k_caa-universalk9.16.09.05.SPA.bin",
            "family": "CAT3K_CAA",
            "version": "16.9.5",
            "md5Checksum": "559bda2a74c0a2a52b3aebd7341ff96b",
            "shaCheckSum": "a01d8ab7121e50dc688b9a2a03bca187aab5272516c0df3cb7e261f16a1c8ac355880939fd0c24cc9a79e854985af786c430d9b704925e17808353d70bf923f4",
            "createdTime": "2020-05-26 04:20:42.904",
            "imageType": "SYSTEM_SW",
            "fileSize": "450283034 bytes",
            "imageName": "cat3k_caa-universalk9.16.09.05.SPA.bin",
            "applicationType": "",
            "feature": "",
            "fileServiceId": "94eccf65-a1dd-47ca-b7c4-f5dd1a8cdeb7",
            "isTaggedGolden": false,
            "imageSeries": [
                "Switches and Hubs/Cisco Catalyst 3850 Series Ethernet Stackable Switch",
                "Switches and Hubs/Cisco Catalyst 3650 Series Switches"
            ],
            
Add Device

To add the device, supply a serialNumber, and pid. The name is optional. The aaa parameters are not used prior to DNAC 1.3.3.7. They are used to solve an issue with “aaa command authorization”.

POST dna/intent/api/v1/onboarding/pnp-device/import
[
  {
    "deviceInfo": {
      "serialNumber": "12345678902", 
      "aaaCredentials": {
        "username": "", 
        "password": ""
      }, 
      "userSudiSerialNos": [], 
      "hostname": "adam123", 
      "pid": "c9300", 
      "sudiRequired": false, 
      "stack": false
    }
  }
]

The response contains the deviceId, other attributes have been removed for brevity. At this point the device appears in PnP, but is unclaimed.

{
                 "successList": [
                     {
                         "version": 2,
                         "deviceInfo": {
                             "serialNumber": "12345678902",
                             "name": "12345678902",
                             "pid": "c9300",
                             "lastSyncTime": 0,
                             "addedOn": 1590471982430,
                             "lastUpdateOn": 1590471982430,
                             "firstContact": 0,
                             "lastContact": 0,
                             "state": "Unclaimed",

                         "tenantId": "5d817bf369136f00c74cb23b",
                         "id": "5eccad2e29da7c0008613b69"
                     }

Site-Claim

To claim the device to a site, use the siteId, imageId, templateId(configId) from earlier steps. Notice the master templateId is used, rather than a specific version. The master gets the latest version of the template by default. The type should be “Default”. If you are using a stack, then the type would be “StackSwitch”. Wireless Access points will set the type field to “AccessPoint”.

POST dna/intent/api/v1/onboarding/pnp-device/site-claim
{
  "configInfo": {
    "configId": "e156e9e6-653d-4016-85bd-f142ba0659f8", 
    "configParameters": []
  }, 
  "type": "Default", 
  "siteId": "d7941b24-72a7-4daf-a433-0cdfc80569bb", 
   "deviceId": "5eccad2e29da7c0008613b69", 
  "imageInfo": {
    "skip": false, 
    "imageId": "04d69fe0-d826-42e9-82c0-45363a2b6fc7"
  }
}

The response shows success, and this is reflected in the PnP UI.

{
      "response": "Device Claimed",
      "version": "1.0"
}

More on Stacks


One major innovation in DNAC PnP is support for stack renumbering. Prior to this, it was recommended that stack members be powered on two minutes apart, from top to bottom. This was to ensure a deterministic interface numbering. Stack renumbering is a much better solution to this problem. One of two stack cabling methods can be used, and the serial number of the top-of-stack switch is required.

There are two implications for API calls for the pre-planned workflow. The first is for the add device call. The stack parameter needs to be set to True.

POST dna/intent/api/v1/onboarding/pnp-device/import
[
  {
    "deviceInfo": {
      "serialNumber": "12345678902", 
      "aaaCredentials": {
        "username": "", 
        "password": ""
      }, 
      "userSudiSerialNos": [], 
      "hostname": "adam123", 
      "pid": "c9300", 
      "sudiRequired": false, 
      "stack": true 
    }
  }
]

The second is the site-claim. The type needs to be changed to “StackSwitch” and two extra attributes are required.

Note: The topOfStackSerialNumber has to be the same as the serial number used to add the device. In other words, add the device with the serial number you intend to use for the top of stack. It does not matter which switch in the stack initiates contact, as the stack will provide all serial numbers to DNAC.

POST dna/intent/api/v1/onboarding/pnp-device/site-claim
{
  "configInfo": {
    "configId": "e156e9e6-653d-4016-85bd-f142ba0659f8", 
    "configParameters": []
  }, 
  "type": "StackSwitch",
  "topOfStackSerialNumber":"12345678902",
  "cablingScheme":"1A", 
 
  "siteId": "d7941b24-72a7-4daf-a433-0cdfc80569bb", 
  "deviceId": "5eccad2e29da7c0008613b69", 
  "imageInfo": {
    "skip": false, 
    "imageId": "04d69fe0-d826-42e9-82c0-45363a2b6fc7"
  }
}