Tuesday, 26 October 2021

Plug & Play (PnP) enables faster onboarding of new offices

Plug & Play (PnP), Cisco Prep, Cisco Tutorial and Materials, Cisco Career, Cisco Preparation, Cisco Learning, Cisco Jobs, Cisco Skills

Most IT engineers can agree that device provisioning for new offices is tedious, time-consuming, and error-prone. Fortunately, our Cisco IT Customer Zero team—which tries out the latest Cisco solutions and integrations to prove value and share experiences—has discovered that it doesn’t need to be that way.

By leveraging the Plug & Play (PnP) capability in Cisco DNA Center, we’ve managed to slash provisioning time by over 50%, while improving the engineer/user experience, reducing configuration issues, and enhancing security.

Prior to PnP, provisioning new offices was tedious and error-prone

Before PnP, our process was manual and slow, with a high risk of producing errors. In the weeks before we set up a switch, engineers had to scour a 501-page playbook to find the right configuration for the device model and office size. They would then travel to the office and paste in the appropriate code snippets via the command-line interface (CLI).

During this process, engineers could easily type an incorrect character or miss a line/s of code. These types of mistakes were responsible for the vast majority of Day-1 problems. The process also required engineers to remain for Day-1 support.

PnP provides the ability to automate onboarding, eliminating errors and saving time

Today, Cisco DNA Center’s PnP capability allows us to onboard new sites much faster by automating the onboarding of devices and the configuration of underlay routing (Figure 1). Switches automatically connect to Cisco DNA Center and retrieve the correct template, based on their serial number and tags. Engineers no longer have to engage in the time-consuming activity of searching through the playbook for the right configuration. PnP also reduces the need to type command-line instructions and cut-and-paste blocks of code. We are now able to standardize our configuration with the use of templates and version control. Instead of using Microsoft Word or Excel spreadsheets, we can create templates that are used across multiple devices with the concept of variables allowing us to be adaptable to each device using templates and tags, saving time and ensuring compliance. Finally, with PnP, engineers no longer need to go on-site for Day-1 support.

Plug & Play (PnP), Cisco Prep, Cisco Tutorial and Materials, Cisco Career, Cisco Preparation, Cisco Learning, Cisco Jobs, Cisco Skills
Figure 1: Day-0 provisioning with PnP

PnP enables zero-touch device provisioning – ensuring simplicity, security, and consistency:

◉ Simplicity: When the device boots up for the first time, it automatically reaches out to the PnP Connect Cloud, then is redirected to Cisco DNA Center. From there, we can easily push the required Day-0 and Day-1 configs as well as the software images to the device—lowering the risk of an accidental input.

◉ Security: The device securely connects to the PnP cloud via https and is verified and redirected using its product ID and serial number.

◉ Consistency: This process enables a consistent workflow across all platforms— switches, routers, and wireless LAN controllers—regardless of the number of devices that need to be staged.

The Cisco IT Customer Zero team recently conducted a detailed value analysis to quantify the benefits of Cisco DNA Center PnP (Figure 2). Here is what the Customer Zero team found:

◉ Significant time savings: PnP cut the provisioning time of wireless controllers by 54 percent—from 130 minutes using the manual approach, to 60 minutes using Cisco DNA Center with PnP. Similarly, PnP reduced onboarding time for Cisco Catalyst 9300/9400 switches by 43 percent—from 180 minutes manually to 77 minutes with PnP.

◉ Enhanced NetOps experience: Because PnP does not require actual monitoring during device provisioning, only 45 percent of the provisioning process requires “active engineering time.” As a result, the experience is less tedious and stressful for network engineers.

◉ Better end-user experience: By automating initial provisioning and underlay routing configurations, PnP ensures faster site readiness and seamless user onboarding.

◉ Improved security: PnP enables end-to-end security, from Cisco DNA Center to network devices, from Day-0 to Day-N, with no physical access required.

Plug & Play (PnP), Cisco Prep, Cisco Tutorial and Materials, Cisco Career, Cisco Preparation, Cisco Learning, Cisco Jobs, Cisco Skills
Figure 2. Key findings: Cisco DNA Center Plug & Play benefits

The Cisco Customer Zero team is committed to exploring other ways that Cisco DNA Center PnP can further drive value by leveraging automation to fuel greater efficiency, better user experiences, and improved security. We are working towards initiatives such as configuration management across multiple Cisco DNA Centers and other automated use cases. Stay tuned…

Source: cisco.com

Saturday, 23 October 2021

The Future of Broadcast: The All-IP Olympics

This summer, we witnessed the future of broadcasting, and it wasn’t the first time the Olympics were involved. When the Games were first held in Tokyo in 1964, it made history for being the first live televised broadcast. Fifty-seven years later, with the help of 6,700 pieces of Cisco equipment, NBC Olympics was able to deliver more than 7,000 hours of coverage across multiple platforms. The ingenuity behind the scenes was Cisco helping power the first all-IP production in the host city for NBC Olympics’ coverage of the Games.

IP networking is a proven and robust technology, as evidenced by the IP-based enterprise networks that support so many businesses and organizations. The tremendous benefit of IP is that it enables new workflows that simply aren’t possible with legacy video technology. These new workflows enable broadcasters to fundamentally transform how they create and deliver content while lowering their operating expenses. And they can do this without negatively impacting the reliability or real-time delivery of content.

Improving Capabilities & Visibility

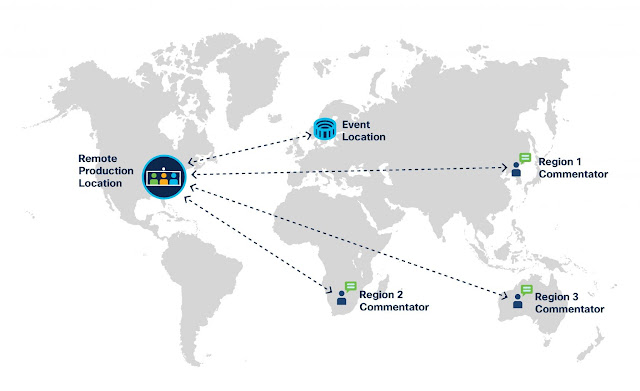
Consider a workflow like distributed production (see Figure 1). Traditionally, all participants in a live broadcast, from those being filmed to those doing the filming, had to be in the same location. With distributed production, each group can be in its own location. A host or commentator could be on one continent while athletes are on another, and the production team is yet again somewhere else. This allows for a lighter onsite crew and for production teams to work in their home production studios with full access to all of their usual tools and equipment.

Cisco Preparation, Cisco Tutorial and Material, Cisco Career, Cisco Guides, Cisco Learning, Cisco Study Materials
Figure 1: A distributed production workflow allows production, participants, and commentators to be located anywhere in the world.

This was truer than ever for NBC Olympics because of COVID-19. Production was split between crews in Tokyo and employees back at NBC Olympics’ studios in Stamford, New York, Englewood Cliffs, Miami, and Sky Sports in the UK. There was increased importance on being able to send content back to the video team for editing and post-production before being distributed. Reliability, always important, was even more vital due to the scale of these Games.

Delivering Live Production


To deliver live production, the IP network at the IBC had to guarantee reliable transport of uncompressed video (SMPTE 2110). Cisco’s Nexus 9000 switches, deployed in a hybrid spine-leaf network, made this possible running with Cisco’s innovative Non-Blocking Multicast (NBM) technology. NBM provides end-to-end bandwidth guarantees for all multicast flows without relying on the traditional “equal cost, multipath-based” load balancing of flow. The flexibility of IP ensured that all flows within the IBC were reliable while meeting the capacity demands. Along with NBM, the Nexus 9000 switches distributed timing at scale using Precision Time Protocol (PTP). This ensured all endpoints were always in sync with nanosecond precision.

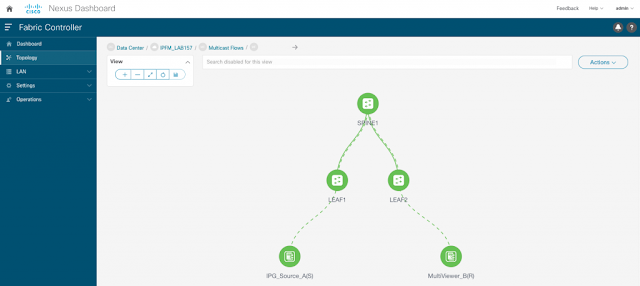
In addition, Cisco Nexus 9000 switches powered by Cisco’s Cloud scale ASICs, provided granular visibility into critical aspects of the network, including tracking the bitrate of every multicast flow and following flow paths as signals travelled through the network and streaming all of this information real-time using software and hardware telemetry to Nexus Dashboard Fabric Controller (see Figure 2).

Cisco Preparation, Cisco Tutorial and Material, Cisco Career, Cisco Guides, Cisco Learning, Cisco Study Materials

Cisco Preparation, Cisco Tutorial and Material, Cisco Career, Cisco Guides, Cisco Learning, Cisco Study Materials
Figure 2: Flow analytics track the bitrate of every single flow in the network.

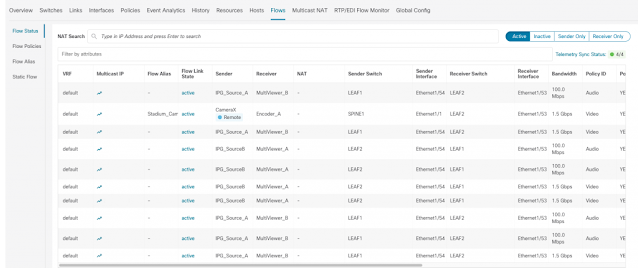
Simplification and automation were critical given the live nature of the Olympics. There wasn’t time for a tech to log into a switch and scan a session log to figure out an issue. Using the Nexus Dashboard and Cisco Nexus Dashboard Fabric Controller (NDFC) gave NBC Olympics a single pane of glass approach to network management. Combined with the granular visibility of Cisco Nexus 9000 switches (see Figures 3 and 4), NDFC provided real-time insights into network performance, all the way to the application level. This enables NBC Olympics to identify and resolve issues before they became problems that can impact the quality of broadcasting.

Cisco Preparation, Cisco Tutorial and Material, Cisco Career, Cisco Guides, Cisco Learning, Cisco Study Materials
Figure 3: The Cisco Nexus Dashboard provides flow information.

Cisco Preparation, Cisco Tutorial and Material, Cisco Career, Cisco Guides, Cisco Learning, Cisco Study Materials
Figure 4: Monitoring precision time protocol performance on Cisco Nexus 9000 switches.

In addition to increasing reliability and simplifying management, NBC Olympics also recognized substantial operational savings with an all-IP distributed production approach. While COVID-19 necessitated a reduced crew on the ground in Tokyo, the technology enabled teams in different countries or regions to do their work from their home base.

The flexibility of all-IP production also enables network and production investment to be used in different events around the world. This reduces the overall carbon footprint of the entire industry and create long-term operational savings while optimizing workflows.

Source: cisco.com

Thursday, 21 October 2021

Secure and Simplify Your Programmable Edge and Industrial Sensors

The Cisco IoT Operations Dashboard provides operations teams with a centralized, cloud-based dashboard to securely deploy, monitor, and troubleshoot device connectivity. Using this secure connectivity as a foundation, that same dashboard then enables you to extract, transform, govern and deliver data from IoT edge devices to the cloud with Cisco Edge Intelligence, install and manage your containerized edge applications and to deploy a broad range of industrial IoT sensors with Cisco Industrial Asset Vision.

Cisco Prep, Cisco Preparation, Cisco Tutorial and Materials, Cisco Certification, Cisco Career

Once your solution is in place, or as part of your solution development process, IoT Operations Dashboard enables you to securely and simply access remote connected equipment and to monitor its connectivity status, using nothing more than your browser.  This simplifies maintenance, solution development and updates, and ensures business continuity without the need for frequent and costly truck rolls to remote sites and locations.

With IoT Operations Dashboard, scaling up is straightforward.  Using the cloud-based dashboard, Cisco Industrial Routers and Gateways can be zero-touch provisioned at remote sites, and automatically configured with proven solution templates and configurations, helping you to streamline configuration of your devices, and reduce errors. You can then deploy your industrial IoT solutions, applications and sensors using that same dashboard. Once in operation, Dashboard provides an Operations Technology (OT) focused user experience and is simple and easy to use. Directly from the browser-based dashboard you can see map-based views of your deployments, equipment status, sensor data, events and alerts, which greatly simplifies monitoring and gaining insights into your operations.

Operations Dashboard offers a rich set of capabilities for developers and systems integrators, as well as custom solutions. And you can start right now on DevNet! The new DevNet IoT Operations Dashboard sandbox includes components such as Edge Device Manager (EDM) and Industrial Asset Vision, and we also offer an IoT Cisco Edge Intelligence (EI) sandbox.

Create templates and test remote access with the Edge Device Manager Sandbox


Custom forms called eCVDs allow you to configure Cisco Industrial Routers and Gateways to meet the exact needs of your solution. Use predefined eCVD configuration forms to leverage Cisco-provided zero-touch provisioning (ZTP) and best security practices. These can then be easily customized using the open-source Freemarker template language on which they are based.  This makes it straightforward for you to create a custom configuration form which is specific to your solution with ZTP, security and solution-specific configuration options and in-form guidance.

Using the built-in Secure Equipment Access (SEA) feature of IoT Operations Dashboard, you can then use RDP, VNC, SSH or HTTP/S to securely access remote connected equipment using just the dashboard and your browser.  SEA provides this ability for simple and secure remote access even if you are in a different organization and network to your customer’s solution, for example as a solution developer or equipment vendor.  This greatly simplifies solution development, especially for those real-world proof-of-concepts and in-field development and update activities that are often so challenging and time consuming.

Reserve our all-new EDM sandbox today for access to a real Cisco IR1101 and your own IoT Operations Dashboard organization! Test on-boarding, deploy applications, and connect via the dashboard to the Linux DevBox without any VPN configuration.

Cisco Prep, Cisco Preparation, Cisco Tutorial and Materials, Cisco Certification, Cisco Career

Extract all your IoT sensor data via MQTT with Industrial Asset Vision


Cisco Industrial Asset Vision (IAV) provides a complete full-stack solution that includes all hardware and software components, pre-integrated and delivered as a cloud SaaS offer. IAV includes an end-user dashboard application, network management tools, LoRaWAN network devices, and Cisco industrial sensors for collecting environmental and GPS location data.

Cisco IAV exposes APIs through which global independent software vendors (ISVs) and applications developers can integrate with systems such as enterprise resource planning (ERP), service management, manufacturing execution systems, and analytics. Asset and sensor information can also be published to 3rd party data brokers via MQTT and to Azure IoT Hub.


Simplify IoT Edge-to-Multi-Cloud Data Flow with Cisco Edge Intelligence


As part of IoT Operations Dashboard, the IoT data orchestration software, Cisco Edge Intelligence, connects assets at the edge to multi-cloud application destinations in a very easy way for the user and can even extend its functionality with a transformation engine at the edge.

Cisco Prep, Cisco Preparation, Cisco Tutorial and Materials, Cisco Certification, Cisco Career

Source: cisco.com

Tuesday, 19 October 2021

Cisco IT accelerates its transformation with CX Cloud

Cisco Executive Platform, Cisco IT, Cisco Skills, Cisco Career, Cisco Preparation, Cisco Guides, Cisco Certification, Cisco

As any CIO with a digital transformation agenda can attest, success relies upon establishing clearly defined objectives for each step of the journey – with visibility into the entire IT infrastructure. Also critical is the ability to receive the right information at the right time to help achieve desired outcomes faster. This was especially true during the pandemic when, for example, Cisco enabled – within 10 days – 140,000 employees and partners to work from home.

In Cisco IT, we’re meeting these goals with CX Cloud – a one-stop destination that combines Cisco expertise and best practices with telemetry, AI-/ML-driven insights, use cases, and contextual learning. This cloud-based Software as a Service (SaaS) portal is smoothing the bumps in our digital journey by removing complexity, filling skills gaps, and ultimately accelerating technology adoption.

Cisco Executive Platform, Cisco IT, Cisco Skills, Cisco Career, Cisco Preparation, Cisco Guides, Cisco Certification, Cisco
It accomplishes this by providing:

◉ Full visibility into all of our network assets and contracts

◉ Automated risk detection and mitigation

◉ Actionable data and insights

◉ Ready access to targeted learning resources and expertise, and much more

Let’s take a closer look at how we’re leveraging these and other CX Cloud capabilities to benefit our business.

‘Single source of truth’ with 360-degree insights

CX Cloud provides a secure, single source of truth that enables full visibility of our 100,000-plus IT assets (see Figure 1). CX Cloud’s telemetry ensures we always have the latest information pertaining to purchased and connected assets, security advisories, support cases, and individual success tracks.

Because we now have all of our asset information and security advisories in one place, our engineers no longer need to build reports manually or reconcile across platforms. As a result, they expect to boost their efficiency and improve their operational scale by 50 to 60 percent, allowing them to spend more time on innovation. The bottom line: We’re accomplishing much more with the same number of people.

CX Cloud also lets us keep track of on-premises and cloud-based infrastructure across multiple deployments — with tools to search, filter, and see a 360-degree view of an asset’s hardware and software details. We can access contract and coverage details with key support milestones, while also receiving on-demand diagnostic scans and updated advisories.

Cisco Executive Platform, Cisco IT, Cisco Skills, Cisco Career, Cisco Preparation, Cisco Guides, Cisco Certification, Cisco
Figure 1. CX Cloud provides a “single plane of glass” for viewing 100,000+ Cisco IT assets.

Timely expertise with quick resolution and enhanced security


CX Cloud leverages machine learning to analyze our network and generate a prioritized listing of security advisories (alerts), field notices, and priority bugs (see Figure 2). Each security advisory shows the vulnerabilities, the number of affected assets, IP addresses, and actionable data – ultimately helping us drive faster resolution and enhanced security.

Before we had this tool, our engineers would spend as many as three hours analyzing each potentially impacted device. CX Cloud is dramatically reducing the majority of the time it takes to gather the information from multiple sources, giving our engineers opportunities to focus on higher-value activities.

Cisco Executive Platform, Cisco IT, Cisco Skills, Cisco Career, Cisco Preparation, Cisco Guides, Cisco Certification, Cisco
Figure 2. CX Cloud’s advisories help to eliminate security vulnerabilities

With CX Cloud, we can access use-case-guided expertise and lifecycle resources to help us deploy, manage, and optimize our technology while reducing risks. We can leverage a guided adoption journey to help us deploy and optimize specific use cases, with expert advice tailored to our specific progress (see Figure 3).

CX Cloud enables us to gauge our deployment progress using a combination of telemetry insights and manual actions. We can engage with Cisco and partner expert resources such as best-practices webinars and 1-to-1 coaching. We also enjoy access to extensive eLearning catalog and remote practice labs (Level 2), as well as product documentation and communities.

We’ve found the lifecycle section of CX Cloud to be especially useful when we onboard new people. This feature helps keep us moving forward in our transformation journey, without having to backtrack.

Cisco Executive Platform, Cisco IT, Cisco Skills, Cisco Career, Cisco Preparation, Cisco Guides, Cisco Certification, Cisco
Figure 3. CX Cloud’s lifecycle resources provide expert advice, when and where it’s needed

Speedy resolution and simplified case management


With CX Cloud, we can see all open support cases in a handy list view (provided that each viewer on our team is eligible to review those cases). This easy access is available regardless of whether a viewer is the case owner or not. This built-in support is akin to always having a high-touch operations manager at our fingertips, accelerating collaboration and issue resolution.

Cisco Executive Platform, Cisco IT, Cisco Skills, Cisco Career, Cisco Preparation, Cisco Guides, Cisco Certification, Cisco
Figure 4. CX Cloud makes case management easy

Minimize risks with tailored recommendations and insights


CX Cloud delivers deep intelligence and insights into our network and security posture, allowing us to reduce our operational risk. We can view targeted insights and suggestions that help us optimize our business and solve problems before they happen.

For our Catalyst 9500 switches, we receive software recommendations tailored to our assets and configuration – by risk profile. Combined with Cisco DNA Center software image management (SWIM), this helps us automate software upgrades and ensure all the assets are on the same Golden Image.  Our engineering leaders can also see potential crash risks based on known contributing factors, along with tailored recommendations to minimize risks. With Integrated Secure Operations, we also have visibility into license consumption information and features used.

CX Cloud even lets us quickly identify devices with regulatory compliance (e.g., HIPAA, PCI) violations and view recommended fixes.

Cisco Executive Platform, Cisco IT, Cisco Skills, Cisco Career, Cisco Preparation, Cisco Guides, Cisco Certification, Cisco
Figure 5. CX Cloud’s deep insights help solve problems – before they happen

Ultimately, CX Cloud’s comprehensive suite of use-case-driven solutions work together to help us drive business value across architectures. CX Cloud digitally connects us to the right expertise at the right time, with the right level of engagement to achieve our goals – faster.

Source: cisco.com

Sunday, 17 October 2021

Create, Document, and Share Live Code Examples with Jupyter Notebook

Q: How do you eat a whale?

A: One bite at a time… or so the saying goes. Admittedly, I don’t know of anyone who eats whale one bite at a time (or any way otherwise for that matter). But we can all agree that breaking large problems into smaller pieces is a valuable arrow in the quiver of problem-solving techniques. It’s a practice that certainly applies in the world of programming.

Once the problem is broken down and implemented, however, how can we convey what we learned to others? One way is using Jupyter Notebook to combine documentation authored in markdown together with live code. As an example, a developer writes small blocks of Python to vet an algorithm, a function, or syntax. Once verified, it is documented, saved, and the code is then added to the IDE, such as VSCode, where the main Python code is developed.

This post shows a simple Python example that retrieves physical compute inventory claimed in Cisco Intersight. In this example, the items in the inventory are UCS X-Series compute nodes managed by IMM (Cisco Intersight Managed Mode).

What is Jupyter Notebook?

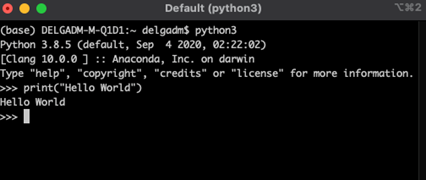
Jupyter Notebook is an open-source web application used to create and share code along with narrative text. It’s used extensively in academia especially by data scientists. If you have experience with Python you may be familiar with IDLE (see the screenshot below). IDLE lets you execute Python code directly from the command line without needing to run a *.py file. You run your line(s) of code and verify things work and when you are finished, you close your session with <cntrl><d> and you move on with life. What if you wanted to share what you tried with someone else? Assuming you copy/pasted the contents of your shell session, would someone else be able to understand what the flow of what you were trying? Could you refer to it later and understand the flow of what you did?

Cisco Preparation, Cisco Learning, Cisco Guides, Cisco Tutorial and Materials, Cisco Career, Cisco Study Materials

IDLE does the job but it has limitations when it comes to documenting and sharing ideas. Enter Jupyter Notebook, an interactive way of documenting and executing live code from a web-based interface. It runs as an interactive web application supporting markdown and code execution with support for over 100 programming languages (called “kernels”) including Python, PowerShell, and Matlab just to name a few. I’ll show you examples in both Python and PowerShell since those are commonly used to interface with Cisco compute API’s.  

How Jupyter Notebook works – A very simple tutorial


First, be sure to first install Jupyter Notebook if it’s not already on your machine. Once installed, you can launch the browser by entering the command jupyter notebook from the command line. When the command is executed a new browser tab opens with the Jupyter notebook interface. 

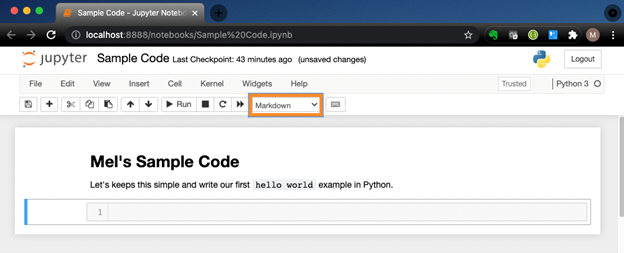
In the example below, we use Python 3 as our language of choice with the first entry authored with markdown and the second “hello world” passed to the print function. For the first entry, select Markdown as the type of content to run, enter markdown syntax, followed by simultaneously pressing the <shift> and <enter> keys and voila! The markdown is rendered.

Cisco Preparation, Cisco Learning, Cisco Guides, Cisco Tutorial and Materials, Cisco Career, Cisco Study Materials

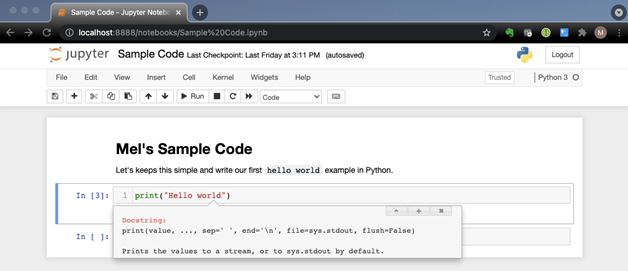
In the next entry, select Code from the highlighted pulldown, enter one or more lines of code, followed by simultaneously pressing <shift> and <enter>. The code runs and the results are displayed just below the code. Well, that was easy!

Cisco Preparation, Cisco Learning, Cisco Guides, Cisco Tutorial and Materials, Cisco Career, Cisco Study Materials

Pro Tip: Not sure what to pass else you can pass to print? Select the field where you entered the print function and followed by simultaneously pressing the <shift> and <tab> keys. You will see a documentation snippet describing the function.

Cisco Preparation, Cisco Learning, Cisco Guides, Cisco Tutorial and Materials, Cisco Career, Cisco Study Materials

Show Me a Real-World Example


The examples above are right up there with the ‘hello world’ examples you undoubtedly encountered when learning a new language. Next, let us dive into the real-world scenario of calling the Intersight API to retrieve a list of physical compute items from claimed inventory while documenting how you accomplished it.

The specifics of how to go about making the code authenticate and such are covered in the file itself for this post, the example is cut back for brevity, but you can download the code from DevNet’s Code Exchange if you would like to follow along and try it. The examples available in Python and PowerShell.

Here are the steps taken to retrieve physical compute inventory:

◉ Import the necessary Python modules
◉ Populate the AUTH variable and define the base URL
◉ Run a GET operation on the URI of compute/PhysicalSummaries
◉ Inspect the JSON data returned by the call
◉ Print the results

Documenting and Executing Code


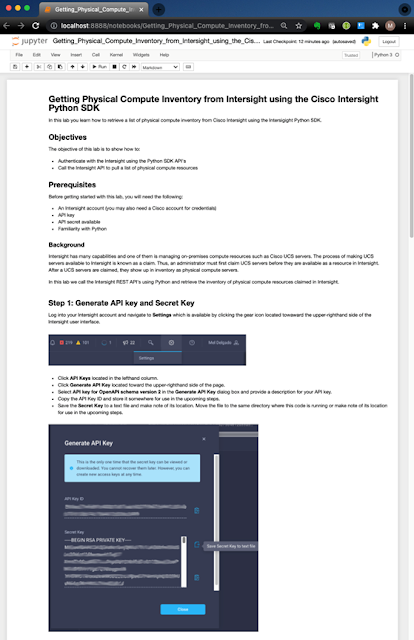
In step 1 below, you see these steps in action broken apart into smaller pieces along with documentation explaining what each step does along with the live code. If fact, we do not need to discuss the steps in this blog since it is already contained in the Jupyter Notebook. Instead, we pass along a few pro tips.

Cisco Preparation, Cisco Learning, Cisco Guides, Cisco Tutorial and Materials, Cisco Career, Cisco Study Materials

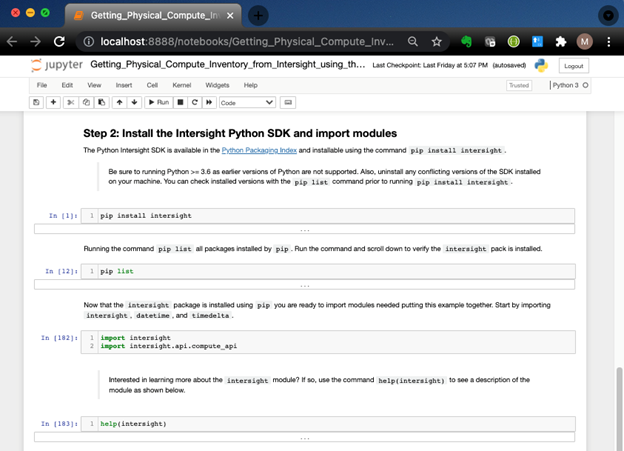
In Step 2, instructions for installing the Python SDK and importing modules are provided with the code for each just below it. Pressing <shift><enter> runs the code and produces a result. The number of lines to execute is up to you and the instructions executed remain in memory.

Pro tip: JSON responses are often lengthy. To manage how you view the output, click the output cell, in this case cell 23. Click once and you see the smaller scrollable window, click twice and you see the full-length listing. If you double-click, the data is hidden. The screenshot below shows the cells with the results hidden.

Cisco Preparation, Cisco Learning, Cisco Guides, Cisco Tutorial and Materials, Cisco Career, Cisco Study Materials

Finally, if you skip ahead to step 6 you will see the number of UCS X-Series compute nodes currently in our inventory along with how the hardware is completely managed by Intersight by virtue of its management mode also known as IMM (Intersight Management Mode).

Cisco Preparation, Cisco Learning, Cisco Guides, Cisco Tutorial and Materials, Cisco Career, Cisco Study Materials

Source: cisco.com

Saturday, 16 October 2021

Flexible Hybrid Cloud Networking with Infrastructure as Code and Cisco Nexus Dashboard

Applications are becoming the most visible aspect of an organization’s brand. The performance, usability, and reachability of branded apps are of utmost importance since they are a primary interface to customers. To keep up with evolving customer expectations, developers and operations teams are rapidly adopting design patterns using containers and microservices for continuous integration and continuous delivery (CI/CD). In order to enable these innovations to deliver a competitive customer experience, IT relies more and more on a hybrid cloud model.

The enterprise cloud network—including the WAN—keeps application components securely connected and operating in a predictable and performant way. In this sense, the network is an intrinsic part of modern application design and plays an essential role in maintaining KPIs that protect the brand as customers depend on applications to accomplish their daily tasks, including essential services where availability is crucial. Being able to safely automate workflows and have deep visibility into the cloud network, compute infrastructure, and applications has always been a critical need for IT organizations—and even more so in the new hybrid world.

But Hybrid Cloud Gets Challenging

Deploying applications in the cloud is relatively simple for new cloud-native applications. According to IDC research, to gain business agility, enterprises are committing to modernize more than half of their existing applications by 2022, leveraging cloud-native application architectures as a means of achieving their goals.* That’s a significant portion of existing application deployments. For many organizations refactoring these applications to a cloud-native foundation will include integration with exisiting data center services and data repositories, while taking advantage of embedded security policies to protect payment and personal information. This is accelerating the rise of hybrid applications.

The transition to hybrid-cloud introduces new challenges, like the many individual services on a smart watch pulling data from a plethora of sources, but hyper-scaled to serve millions of clients. Established services in an on-premises data center need to be easily accessible to cloud application containers, such as when a cloud-native shopping cart needs to access the payment information on the PCI island in the private data center. The entire communication path needs protection with guaranteed levels of service.

Hybrid cloud requires a simple-to-use, centralized cloud networking platform built to support multiple operator personas—NetOps, DevOps, and CloudOps—to manage a constantly changing constellation of services, data sources, and connections. Historically, provisioning a new application required a handshake between DevOps and NetOps, with NetOps configuring the network before DevOps could deploy the application. This was a manual, error prone process, assuming static dependencies, thus reducing the velocity of change. Thankfully, the increasing adoption of Infrastructure as Code (IaC) tools is helping automate and simplify management of the complex interactions among data centers, hybrid-clouds, networks, and compute infrastructure.

Infrastructure as Code Is the Operational Link Between DevOps and NetOps

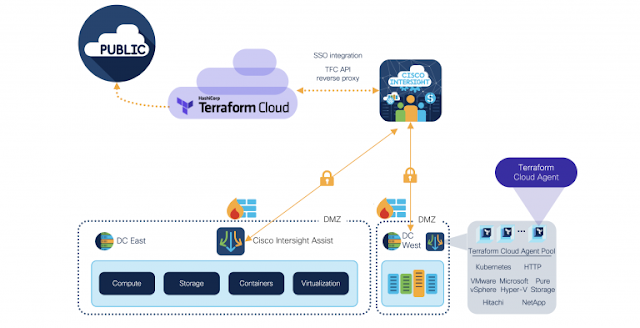
IaC automation capabilities are critical for DevOps teams for automating provisioning of cloud infrastructure. DevOps teams can rely on a consistent automation model for infrastructure and workloads across the edge, co-locations, data centers, and public clouds. Depending on the desired outcome, IT teams can leverage IaC tools such as HashiCorp Terraform and Red Hat Ansible, interacting with either Cisco Nexus Dashboard for managing cloud networking services or through Cisco Intersight to manage compute resources.

NetOps can now expose infrastructure services for consumption by the DevOps and CloudOps teams via the Cisco Nexus Dashboard. Using HashiCorp Consul Terraform Sync with Nexus Dashboard, DevOps can directly drive the infrastructure changes needed for application deployment and management while enabling NetOps to monitor the progress in real time, across the global infrastructure. This is made possible by the automation capabilities of Cisco Nexus Dashboard enabling rapid deployment of services, CI/CD pipelines, and seamless collaboration between DevOps, CloudOps, and NetOps.

Take, for example, a Development Team working with the Nexus Dashboard owner to package connectivity permissions for a hybrid-cloud application in an IaC Plan/Playbook. NetOps can use Nexus Dashboard to define the secure connections needed for the application to function among clouds and on-premises services—and only those services. This alleviates the need for DevOps to define and keep track of the network permissions needed for the application. DevOps can make functional changes to a Plan/Playbook using the existing infrastructure and connectivity requirements or NetOps can add new resource connections as needed for updates.

Flexible Hybrid Cloud Networking, Cisco Nexus Dashboard, Cisco Prep, Cisco Preparation, Cisco Guides, Cisco Career, Cisco
Integrating On-Premises IaC with Cisco Nexus Dashboard

Learning the Ways of IaC for Network Operations


NetOps teams, one of the key operators of Nexus Dashboard, have an opportunity to not only provide valuable assists to DevOps to keep applications up to date and running efficiently, but also to advance their professional career. Learning the principles of IaC by using Terraform or Ansible is an essential skillset that will become even more valuable as organizations continue their move to hybrid application architectures and hybrid cloud operations. To support this learning journey, Cisco DevNet provides classes, learning labs, videos, and sandboxes for experimenting with IaC and Nexus Dashboard services such as Nexus Dashboard Orchestrator. These educational opportunities enable a more productive partnership between NetOps and DevOps teams, improving the deployment and upkeep of vital applications.

Working Together with Cisco Nexus Dashboard and Cisco Intersight


Today, IT teams that base workflows on Cisco Intersight can seamlessly take advantage of Cisco Intersight Service for HashiCorp Terraform. Likewise, network operation teams using Nexus Dashboard as their cloud networking platform will be able to take advantage of Cisco Nexus Dashboard support for HashiCorp Terraform cloud agents. Cisco offers IT teams the flexibility to incorporate IaC models no matter which infrastructure management platform or toolchains they employ to ensure the desire outcomes. With both approaches, Cisco Solution Support provides a single point of contact to support the integration of Nexus Dashboard and Intersight with Terraform Cloud for Business.

Flexible Hybrid Cloud Networking, Cisco Nexus Dashboard, Cisco Prep, Cisco Preparation, Cisco Guides, Cisco Career, Cisco
Integrating On-Premises IaC with Cisco Intersight

Source: cisco.com

Thursday, 14 October 2021

Emerging trends in IoT gateway and edge application management in a cloud native paradigm

The COVID-19 pandemic has thrust the world into an era of massive digital business transformation across industries like manufacturing, utilities, smart cities, oil and gas, and transportation. To meet these new challenges and keep business operations running smoothly, we need cost-effective solutions. Traditionally, IoT solutions were typically used to reduce operational expenses and increase operational equipment efficiency (OEE). With the onset of the pandemic however, the need for managing business operations remotely across these IoT verticals has increased rapidly. This has led to a sudden, unprecedented shift towards an increased adoption of cloud native IoT management applications hosted by public cloud providers in partnership with IoT SaaS vendors. An example for such a use case is remotely managing operations of IOT gateways and edge compute applications deployed on a manufacturing floor. This migration from having personnel onsite managing and accessing devices, IoT gateways, and edge compute applications to remote cloud based management brings a new set of IoT security challenges that are primarily seen in a cloud native application. While cloud native applications are considered reasonably secure in general, there is still room for improvement. Containers, orchestrators, and APIs present in an application’s surrounding infrastructure represent new attack surfaces. In addition to the cloud service itself, each of these layers has an array of user-defined configuration settings intended to help users apply their security policies. This manual configuration is often fraught with opportunities for user error and misconfiguration, opening the IoT applications to potential security attacks.

In addition, new technology and architectural trends are emerging within the functionality of IoT management applications. These new trends change the way gateway management, security, and network management is done for IOT networks. They also alter how edge compute applications run on IoT gateways and integrate with public cloud-based platforms like Amazon Web Services, Microsoft Azure, and Google Cloud. In this technical blog we will discuss some of the emerging architectural trends in the IoT industry. They are classified as the six critical pillars of cloud native IoT management application in a hybrid cloud and multi cloud environment:

◉ Compute scalability

◉ High frequency data processing

◉ Low latency data processing

◉ Robust data processing pipeline

◉ Variety of IoT protocols

◉ Cloud native IoT messaging service

We will discuss these six critical pillars further in detail, but first let’s look at the challenges they are solving.

Challenges of distributed edge IoT data infrastructure

Distributed edge computing makes sense for a variety of use cases in IoT applications. Consider the following challenges with a cloud native integration for the distributed IoT edge:

◉ Bandwidth – traditionally the available WAN network bandwidth is a focus for data centers. However, this focus will shift towards IoT edge computing use cases as many distributed edge IoT deployments emerge.

◉ Latency tradeoff – some IoT use cases would experience increased latency if data processing happened in a cloud or fog layer and there should be a tradeoff to do it in a distributed edge paradigm.

◉ Heterogeneity– in a cluster of gateways deployed at the edge, heterogeneous compute capability of these individual gateways could affect the overall efficiency by adding dissimilar components to handle tasks for the edge compute scenario.

◉ Transparency– conceals the separated components in a distributed edge network to allow the disparate pieces to work in sync.

◉ Concurrency– allows several IoT clients to access shared resources at the edge, which creates concurrent access related problems.

◉ Security– is simpler when all compute resources are consolidated in a centralized data center but not in a distributed edge as in IoT network architectures.

◉ Backup – of dispersed IoT data requires new data protection strategies in a distributed edge IoT to cloud data pipeline paradigm.

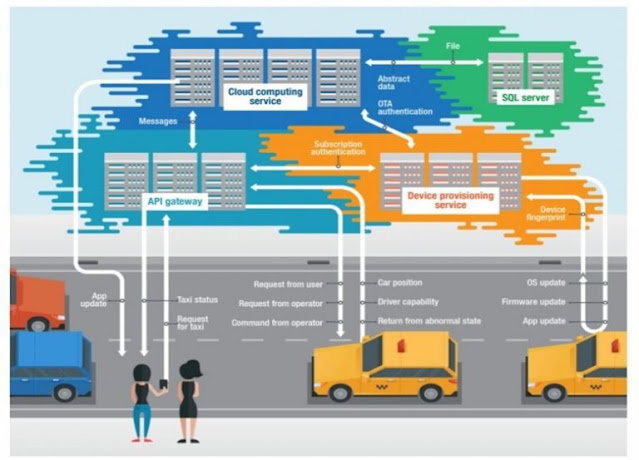
5G enabled IoT applications require a highly dynamic response from the end to end IoT system, which creates the need for a distributed event driven edge compute service. To meet these demands, IoT application developers need a flexible and agile development environment like the cloud native approach to quickly create event driven edge compute applications running on IoT gateways. However, introducing such a cloud native approach can come with its own challenges. Take for example fleet management use cases. IoT gateways are deployed on vehicles for continuous monitoring of GPS location, collecting telemetry, and other diagnostic health information. Adding an additional distributed event processing component at the edge for communicating to a cloud native IoT application to manage these gateways could lead to an increased latency, which may eventually create OT operational issues for the end customer. Therefore, it is very important to design the edge application in a resilient and robust manner. Cisco Edge Device Management offers such capability to seamlessly integrate with Cisco IoT Operations Dashboard.

Real-world cloud native IoT illustration of transportation use case

Cisco IR829 Industrial Integrated Services Routers, Cisco Catalyst IR1100 Rugged Series Routers, and Cisco Catalyst IR1835 Rugged Series Router
Cisco Prep, Cisco Tutorial and Materials, Cisco Career, Cisco Preparation, Cisco Study Materials

Further technical challenges that can arise in a distributed IoT Edge compute scenario as follows:

1. In connected vehicle/car related use cases the ECU’s software tech stack embedded in the vehicle is different from those of the cloud application software stack to enable quicker integration based on the API’s exposed by the cloud platforms.

2. Limited vehicle’s embedded computing resources and lack of scalability to directly integrate with a cloud native management application

3. Mobility roaming constraints specific to unstable LTE/4G WAN network link connections for exchanging telemetry data at scale in remote deployments.

4. Limited power supply when engines are switched off. The Cisco 829 Industrial Integrated Services Routers and out other industrial routing gateways with ignition power management capability address this challenge.

5. CAN bus data decoding/encoding via protocol translation at the edge and embedded software development challenges to cater to a wide variety of automotive communication protocols

Implementing IoT cloud-based management application itself should minimize the risks that could otherwise arise from integrating edge and cloud. Enterprises can also take additional steps to ensure that their entire ecosystem is secure-from the cloud to the IoT endpoints running at the edge. We need to consider the following security specific challenges for cloud native IoT application.

◉ End to end observability
◉ Secured edge computing stack
◉ Edge cluster monitoring
◉ Secure IoT cloud convergence

Cisco Prep, Cisco Tutorial and Materials, Cisco Career, Cisco Preparation, Cisco Study Materials
End to End Cloud native IoT architectural Illustration

Embedded code is typically static and tailored to a specific platform. It is tested meticulously to ensure safe, secure, reliable, and deterministic operation. However, Cloud native IoT applications typically run on non-deterministic Linux and have many hidden library and Kubernetes clusters or other infrastructure dependencies.

They often can’t be certified to IoT standards such as IEC 61508, ISO 26262, or DO-178C. Even if they could be certified, the cost of certification is prohibitive as it is proportional to the number of effective source lines of code (eLOC) used in the system. For reference, the Linux kernel alone consists of more than 25 million lines of code. The growing number of security threats and attacks happening in the entire stack of IoT systems increase the need for end to end visibility in a cloud native application architecture. We have built a cloud native IoT Security application to mitigate these threats.

The challenges and emerging architectural trends as discussed above for different IoT use cases in a distributed edge compute environment drive the need for a scalable cloud native IoT management application architecture.
 

Possible solutions


In some IoT use cases, the IoT product architectures across industries would require CEP (complex event processing) or processing high volumes of data in a 3V (volume, velocity, variety) model. This drives the need for the following IoT application capabilities classified as the six pillars of cloud native IoT management application in a hybrid cloud or multi cloud world.

◉ Compute scalability: There is an inherent need for scale up/down capability of compute processing power for building IoT applications. This is due to the variety of OT traffic spanning across IoT architectures in different industries.

◉ High frequency data processing: IoT traffic is highly bursty in nature. Therefore, processing of high volume of data without any adverse performance issues to the end-to-end system performance is critical.

◉ Low latency data processing: The majority of IoT use cases require low latency-based processing of OT traffic flows and data.

◉ Robust data processing pipeline: Since IoT requires a low overhead and no single point of failure in the data processing pipelines from the edge to the cloud, cloud native application architectures are suitable to handle robust data processing pipeline.

◉ Variety of IoT protocols: The number of IoT protocols (connectivity, message queues, streaming data, analytics, databases) and specifications of IoT standard have traditionally dealt with interface specifications and related data models, such as device-to-cloud interfaces. This requires cloud native IoT application architecture support.

◉ Cloud native IoT messaging service: The IoT industry’s definition of cloud native IoT messaging service is as follows:

◉ The standards-based offering doesn’t rely upon the services of a particular cloud vendor.
◉ Transparent, elastic scalability that can accommodate peaks and valleys in telemetry data traffic from IoT devices.
◉ Transparent fault tolerance and high availability that fulfills the service level agreements business critical IoT applications require.
◉ Ability to run on different public cloud platforms.
◉ Open API allows for the integration of the data with other cloud and third-party services.

It is easier to build IoT applications or an IoT platform using cloud native principles for both a hybrid cloud and multi cloud journey for our customers and partners. Traditionally, ICS, cyber-physical systems and other operational technology systems were dependent on embedded compute platforms. But the convergence of OT and IT in Industry 4.0 has created a need for building cloud native IoT applications and AEP’s (Application Enablement Platforms). This need is at odds with legacy embedded code running in traditional OT systems. Cisco has built a cloud native IoT management application, which can manage both, the life cycle of edge compute applications and the IoT gateways in a scalable manner.

Cisco IoT architectural solution


We developed Cisco IoT Operations Dashboard to solve these issues along with the technical debt incurred with Cisco’s legacy IoT management applications and based on the global macro trends seen in IoT. The Operations Dashboard comprises of the following main modules: Cisco Edge Device Management, Cisco Edge Intelligence, Secure Equipment Access, and Cisco Industrial Asset Vision. Cisco Edge Intelligence securely handles traffic routed in a hybrid cloud environment from different I/O devices PLC’s devices/OT systems to IoT applications hosted in the public cloud environment. Secure Equipment Access provides capability to remotely manage access and interact with both the gateways and connected devices. This can be used to directly troubleshoot or monitor the IoT devices in your deployment. Operations Dashboard is a cloud native application for deployment, management monitoring, troubleshooting, and gaining insights into IoT network edge connectivity, which is agnostic to different connectivity technologies.

Operations Dashboard provides the following three key services:

1. Deployment, monitoring, troubleshooting, and gaining insights into the operation of industrial IoT routers and gateways, and connected equipment.

2. Cisco Industrial Asset Vision: Monitoring of facilities and assets using Cisco’s industrial sensors.

3. Cisco Edge Intelligence: Edge to multi cloud data orchestration.

From a security perspective we offer a full stack observability platform with Cisco Cyber Vision, Cisco Telemetry Broker, and Cisco SecureX to complement the end-to-end security stack for a diverse set of IoT use cases. With this new cloud native paradigm, you can define each network edge as a small cloudlet for doing security analytics at the edge locally

Key takeaways


Based on these emerging market trends in the cloud native IoT application management, IoT security, and the IoT gateway management, it’s important for you to take action. Cisco IOT Operations Dashboard is based on cloud native primitives and addresses the above discussed scenarios. It leverages the available cloud native infrastructure and tools for enabling your successful journey to a hybrid and multi cloud architecture, and future-proofs your investment.

Source: cisco.com