Are you still configuring your industrial router with CLI? Are you still getting network telemetry data with SNMP? Do you still use many industrial components when you can just have one single ruggedized IoT gateway that features an open edge-compute framework, cellular interfaces, and high-end industrial features?
Also Read: 200-201: Threat Hunting and Defending using Cisco Technologies for CyberOps (CBROPS)
Get ready to try out these features in an all-new learning lab and DevNet Sandbox featuring real IR1101 ruggedized hardware.
◉ Take me to the new learning lab
◉ Take me directly to the Industrial Networking and Edge Compute IR1101 Sandbox
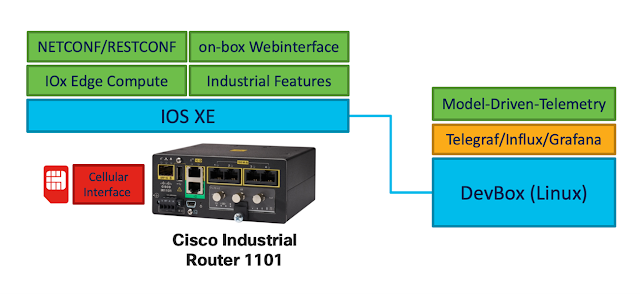
Architecture and feature overview of industrial networking and edge compute in the IR1101 Sandbox
The Industrial Router 1101
The Cisco IoT Gateway IR1101 delivers secure IoT connectivity for today and the future. Its 5G ready modular design allows you to upgrade to new communications protocols when they become available, avoiding costly rip-and-replace. Add or upgrade WAN, edge compute and storage components as technologies and your needs evolve. With its rugged hardware and compact form-factor, you can install it almost anywhere.
Here are a few examples of use cases for the IR1101
Utilities: Remotely manage thousands of miles of unmanned power grids between distribution substations and control centers. Improve power flow, Volt-VAR optimization, and fault detection and isolation, resulting in reduced outage durations and costs.
Public safety and transportation: The IR1101 provides redundant WAN connectivity for increased reliability. And with intelligence at the edge, you can accelerate decision making for mission-critical applications such as public safety, so you can better regulate traffic flow and detect traffic violations.
Oil and gas: Make decisions at the edge for faster response. Utilize cellular redundancy to manage thousands of miles of remote oil and gas pipelines to quickly identify and fix problems, limit downtime, and reduce costs.
WebUI & high-end industrial feature-set
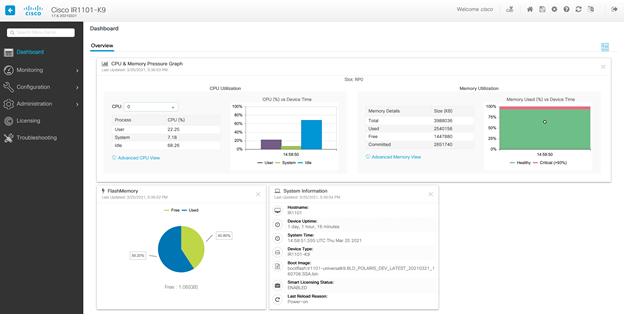
Get familiar with the user-friendly on-box Device Manger (WebUI) as seen below. Users can easily navigate in their browser through the monitoring data, configuration and settings of their industrial device.
Graphical User interface on the IR1101
Of course, you can access as well many other specific industrial features via SSH Ruggedized like QoS, VPN, seamless integration to SCADA with Raw socket and DNP3 Serial/IP and IEC 60870 T101/T104 protocol translation.
IOx Edge Compute
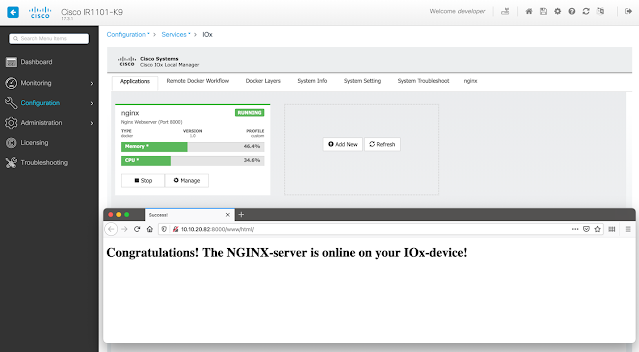
Furthermore, it is possible to install containerized applications directly on the switch. Test now deploying your Docker containers / IOx applications on the ARM powered CPU of the IR1101. We have prepared a sample server application on the DevNet Code Exchange which you can download or build.
On-boxed IOx Local Manager: Managing your IOx applications on the IR1101 – here NGINX server is installed and reachable on Port 8000
Device APIs NETCONF/RESTCONF & Model-Driven Telemetry
Since this switch series runs Cisco’s open and programmable operating system IOS XE, you can even configure the device via the device level APIs such as NETCONF/RESTCONF. This means for example that you can change any device configuration by simply running a Python script from your local machine and apply the changes on as many devices as you want.
Model-driven Telemetry (MDT) provides a mechanism to stream data from an MDT-capable device (=IR1101) to a destination (e.g. database and dashboard).
It uses a new approach for network monitoring in which data is streamed from network devices continuously using a publish/subscribe model and provides near real-time access to operational statistics for monitoring data. Applications can subscribe to specific data items they need, by using standards-based YANG data models over open protocols. Structured data is published at a defined cadence or on-change, based upon the subscription criteria and data type.
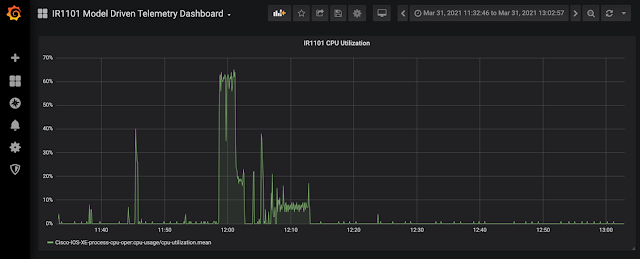
The operational data of the IR1101 is transmitted via gRPC (a high performance open-source universal RPC framework) to a 3rd party collector or receiver, in our example to a Telegraf/InfluxDB/Grafana stack.
Sample Grafana Dashboard in the sandbox: Near real-time monitoring of the CPU utilization on the IR1101 with model-driven telemetry
Source: cisco.com


0 comments:
Post a Comment