In this ‘Focus on HyperFlex’ blog, we’ll zero-in on different aspects of the Cisco HyperFlex (‘HX’) hyperconverged system and ways to make HX work best for you and your organization. This edition will illustrate on how to size a cluster when you might not have all the details of the workload worked out. In this situation, HyperFlex Profiler is the right approach to learn more about the workloads.
During my time in sales, teams often asked me to size a HyperFlex cluster and provide a customer quote. It was customary to have many more questions than the team or customer could answer about the application. Normally, they would provide me with an Excel sheet with some CPU and memory values. That is a great start, and it gave me deep insight into the customer’s application. However, an application profile is not only about averages of CPU and memory. There are several more parameters needed, including the performance and latency peaks. With the customer’s permission, I would run a HyperFlex Profiler in their environment to gain more information about their application. Before installing the OVA on their vCenter, I would explain what HyperFlex Profiler is and how it helps with sizing their new HyperFlex environment.
HyperFlex Profiler
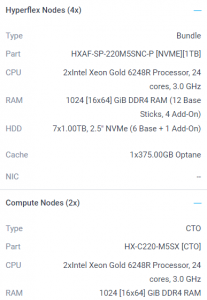
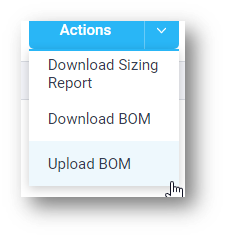
If there is no historical insight into the potential clustered application environment, then start with HyperFlex Profiler. HyperFlex Profiler will gather data on the vCenter environment and consolidate that mass of data to a single, easily digestible file. This file will quickly size the cluster after importing it into the HyperFlex Sizer tool and paint a clearer picture of the environment and workloads.
However, profiling the environment is not a quick hit in a short period of time. The best approach is to run the HyperFlex Profiler for at least seven days or, preferably, 30 days. A longer measuring period ensures you capture data when “end of the month reports” are run. Of course, don’t just measure the environment during a weekend when there is little traffic! Be sure to capture at least one logical business cycle for that application.
The HyperFlex Profiler is an OVA installed on a VMware environment. The only configuration is to provide (read-only) access to the vCenter environment and define which servers the HyperFlex Profiler will monitor. Multiple servers and/or clusters can be selected. For environments running different types of workloads, it is recommended to isolate them by selecting the servers in their environments – for instance, the VDI or the SQL environment. Of course, selecting all servers and workloads is also an option. Keep in mind that you will have more overhead this way.
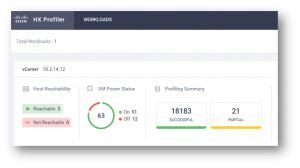
When it is monitoring the environment, you will see the following:


0 comments:
Post a Comment