Tuesday, 19 March 2024

Complexity drives more than security risk. Secure Access can help with that too.

Modern networks are complex, often involving hybrid work models and a mix of first- and third-party applications and infrastructure. In response, organizations have adopted security service edge (SSE) solutions, such as Cisco Secure Access, to protect users regardless of where they are located or what they are accessing.

This reliance on third-party infrastructure doesn’t only drive security risk, it also increases the likelihood of performance outages and disruptions. Oftentimes, these disruptions are the result of service outages and slowdowns in third-party infrastructure, which make it difficult for IT teams to detect and remediate the problem. Experience Insights, a component of Cisco Secure Access, allows administrators to maintain a positive end user experience by detecting and responding to connectivity problems as soon as they occur, all from the same dashboard they use to manage security capabilities and access policies.

Cisco Secure Access is our flagship Security Service Edge (SSE) product, which provides all the tools you need to enable remote and branch users to securely connect to the Internet, software-as-a-service (SaaS) applications, and private apps. While much of these capabilities are focused on security, it is also important to monitor network performance, ensuring a strong digital experience with minimal outages and connectivity problems.

Experience Insights is powered by Cisco ThousandEyes technology, which enables rapid root cause identification and resolution from device to application and every network in between. According to the Forrester Total Economic Impact report for ThousandEyes, the technology’s end user monitoring capabilities resulted in a 50% productivity boost for IT and network operations and a 50-80% reduction in the time it took to identify intermittent or degraded performance, whether it was global or localized.

Complexity drives more than security risk. Secure Access can help with that too.

Provide a strong user experience and troubleshoot performance issues


Performance problems can originate in many sources, including:

  • Devices, such as laptops
  • Wi-Fi networks
  • Internet service providers
  • Corporate resources, such as VPNs or security tools
  • Applications

For many organizations, it can be a challenge to simply detect these problems, let alone mitigate them. This results in ongoing, undetected connectivity problems, causing a loss of productivity and end user frustration.

Experience insights is a digital experience monitoring (DEM) solution that provides a comprehensive view of endpoint, application, and network performance, making it easier to identify and troubleshoot performance problems as they arise. Ultimately, these capabilities result in a reduced mean time to resolution (MTTR) for performance incidents.

This includes a variety of metrics related to:

  • Device – detailed user and system information, including CPU and memory utilization and Wi-Fi signal strength.
  • Internet and network paths – key metrics regarding the network path from the device to the Secure Access gateway, including latency, packet loss, and jitter.
  • Collaboration applications – automatic performance tests for key collaboration tools, such as Cisco Webex, Microsoft Teams, and Zoom.
  • SaaS applications – insight into the most popular SaaS applications, including the overall health status and details such as HTTP response times and status codes.

Complexity drives more than security risk. Secure Access can help with that too.

Single-dashboard, single-agent


One of the primary benefits of Cisco Secure Access is a single-dashboard experience. The solution combines 12 different technologies and provides unified management, configuration, and troubleshooting capabilities. Experience insights is a core component of Secure Access, which means all its data and alerts are provided in the same management portal as the rest of Secure Access’ capabilities. This prevents administrators from being forced to juggle numerous technologies and management portals, streamlining operations and reducing frustration.

In addition, all Secure Access capabilities, including Experience Insights, rely on the Cisco Secure Client, a single agent on the end-user’s machine. This simplifies administration and deployment while optimizing workflows.

All at no extra cost


We recognize how important it is to be able to identify and troubleshoot connectivity problems in an SSE solution, which is why we are including it in the base Secure Access license at no extra cost. In addition, customers can purchase a full license for Cisco ThousandEyes for more advanced capabilities and broader coverage across their network.

Experience insights is just one capability of an incredible solution


While experience insights is our latest announcement, Secure Access includes many capabilities, including a secure web gateway, cloud access security broker with data loss prevention, firewall-as-a-service, and zero trust network access. It is an all-encompassing solution for securely connecting remote and branch users to the Internet, SaaS applications, and private apps.

Source: cisco.com

Saturday, 16 March 2024

Simplify DNS Policy Management With New Umbrella Tagging APIs

Simplify DNS Policy Management With New Umbrella Tagging APIs

This blog post will show you how you can automate DNS policy management with Tags.

To streamline DNS policy management for roaming computers, categorize them using tags. By assigning a standard tag to a collection of roaming computers, they can be collectively addressed as a single entity during policy configuration. This approach is recommended for deployments with many roaming computers, ranging from hundreds to thousands, as it significantly simplifies and speeds up policy creation.

High-level workflow description

1. Add API Key

2. Generate OAuth 2.0 access token

3. Create tag

4. Get the list of roaming computers and identify related ‘originId’

5. Add tag to devices.

The Umbrella API provides a standard REST interface and supports the OAuth 2.0 client credentials flow. While creating the API Key, you can set the related Scope and Expire Date.

To start working with tagging, you need to create an API key with the Deployment read/write scope.

Simplify DNS Policy Management With New Umbrella Tagging APIs

After generating the API Client and API secret, you can use it for related API calls.

First, we need to generate an OAuth 2.0 access token.


You can do this with the following Python script:

import requests
import os
import json
import base64

api_client = os.getenv('API_CLIENT')
api_secret = os.getenv('API_SECRET')

def generateToken():

   url = "https://api.umbrella.com/auth/v2/token"

   usrAPIClientSecret = api_client + ":" + api_secret
   basicUmbrella = base64.b64encode(usrAPIClientSecret.encode()).decode()
   HTTP_Request_header = {"Authorization": "Basic %s" % basicUmbrella,
"Content-Type": "application/json;"}

   payload = json.dumps({
   "grant_type": "client_credentials"
   })

   response = requests.request("GET", url, headers=HTTP_Request_header, data=payload)
   print(response.text)
   access_token = response.json()['access_token']
   print(accessToken)

   return accessToken


if __name__ == "__main__":
   accessToken = generateToken()

Expected output:
{“token_type”:”bearer”,”access_token”:”cmVwb3J0cy51dGlsaXRpZXM6cmVhZCBsImtpZCI6IjcyNmI5MGUzLWQ1MjYtNGMzZS1iN2QzLTllYjA5NWU2ZWRlOSIsInR5cCI6IkpXVCJ9.eyJpc3MiOiJ1bWJyZWxsYS1hdXRoei9hdXRoc3ZjIiwic…OiJhZG1pbi5wYXNzd29yZHJlc2V0OndyaXRlIGFkbWluLnJvbGVzOnJlYWQgYWRtaW4udXNlcnM6d3JpdGUgYWRtaW4udXNlcnM6cmVhZCByZXBvcnRzLmdyYW51bGFyZXZlbnRzOnJlYWQgyZXBvcnRzLmFnZ3Jl…MzlL”,”expires_in”:3600}

We will use the OAuth 2.0 access token retrieved in the previous step for the following API requests.

Let’s create tag with the name “Windows 10”


def addTag(tagName):
   url = "https://api.umbrella.com/deployments/v2/tags"

   payload = json.dumps({
   "name": tagName
   })

   headers = {
   'Accept': 'application/json',
   'Content-Type': 'application/json',
   'Authorization': 'Bearer ' + accessToken
   }

   response = requests.request("POST", url, headers=headers, data=payload)

   print(response.text)


addTag("Windows 10", accesToken)

Expected output:

{
   "id": 90289,
   "organizationId": 7944991,
   "name": "Windows 10",
   "originsModifiedAt": "",
   "createdAt": "2024-03-08T21:51:05Z",
   "modifiedAt": "2024-03-08T21:51:05Z"
}

Simplify DNS Policy Management With New Umbrella Tagging APIs
Umbrella dashboard, List of roaming computers without tags 

Each tag has its unique ID, so we should note these numbers for use in the following query.

The following function helps us Get the List of roaming computers:


def getListRoamingComputers(accesToken):

url = "https://api.umbrella.com/deployments/v2/roamingcomputers"

payload = {}
headers = {
'Accept': 'application/json',
'Content-Type': 'application/json',
'Authorization': 'Bearer ' + accessToken
}

response = requests.request("GET", url, headers=headers, data=payload)

print(response.text)

Expected output:

[
{
“originId”: 621783439,
“deviceId”: “010172DCA0204CDD”,
“type”: “anyconnect”,
“status”: “Off”,
“lastSyncStatus”: “Encrypted”,
“lastSync”: “2024-02-26T15:50:55.000Z”,
“appliedBundle”: 13338557,
“version”: “5.0.2075”,
“osVersion”: “Microsoft Windows NT 10.0.18362.0”,
“osVersionName”: “Windows 10”,
“name”: “CLT1”,
“hasIpBlocking”: false
},
{
“originId”: 623192385,
“deviceId”: “0101920E8BE1F3AD”,
“type”: “anyconnect”,
“status”: “Off”,
“lastSyncStatus”: “Encrypted”,
“lastSync”: “2024-03-07T15:20:39.000Z”,
“version”: “5.1.1”,
“osVersion”: “Microsoft Windows NT 10.0.19045.0”,
“osVersionName”: “Windows 10”,
“name”: “DESKTOP-84BV9V6”,
“hasIpBlocking”: false,
“appliedBundle”: null
}
]

Users can iterate through the JSON list items and filter them by osVersionName, name, deviceId, etc., and record the related originId in the list that we will use to apply the related tag.

With related tag ID and roaming computers originId list, we can finally add a tag to devices, using the following function:

def addTagToDevices(tagId, deviceList, accesToken):
   url = "https://api.umbrella.com/deployments/v2/tags/{}/devices".format(tagId)

   payload = json.dumps({
   "addOrigins":
   })
   headers = {
   'Accept': 'application/json',
   'Content-Type': 'application/json',
   'Authorization': 'Bearer ' + accessToken
   }

   response = requests.request("POST", url, headers=headers, data=payload)

   print(response.text)

addTagToDevices(tagId, [ 621783439, 623192385 ], accesToken)

Expected output:

{
   "tagId": 90289,
   "addOrigins": [
       621783439,
       623192385
   ],
   "removeOrigins": []
}

After adding tags, let’s check the dashboard


Simplify DNS Policy Management With New Umbrella Tagging APIs
Umbrella dashboard, list of roaming computers after we add tags using API

A related tag is available to select when creating a new DNS policy.

Simplify DNS Policy Management With New Umbrella Tagging APIs

Notes:

  • Each roaming computer can be configured with multiple tags
  • A tag cannot be applied to a roaming computer at the time of roaming client installation.
  • You cannot delete a tag. Instead, remove a tag from a roaming computer.
  • Tags can be up to 40 characters long.
  • You can add up to 500 devices to a tag (per request).

Source: cisco.com

Thursday, 14 March 2024

Enterprise security: Making hot desking secure and accessible on a global scale

Enterprise security: Making hot desking secure and accessible on a global scale

Making hot desking secure and accessible on a global scale


The first rule of interviewing a CISO at the Australian division of Laing O’Rourke is this: You can’t dig deep into use cases or clients.

And this makes perfect sense, because when you’re responsible for securing critical infrastructure for an AUD $6 billion global construction and engineering firm, with projects ranging from transport to defense, even scant details can lead to cyberattacks.

Crafting security for joint ventures, and a very distributed network


Despite the high stakes, Laing O’Rourke’s security challenges are distinctly universal – especially post-2020, where the world saw a massive boost in the sophistication and number of DDoS, VPN, and other web-related attacks. And like peer companies, the company needed to set a firm foundation to block internet-based attacks on distributed infrastructure.

But here’s where things are different. Thanks to business requirements, Laing O’Rourke’s network environment is complex. The company often works on what James Fields, Group Deputy CISO for Laing O’Rourke, calls “mega projects,” joint ventures (JVs) with other companies that are – to put it plainly – competitors.

“Being a construction business, physical security is a real challenge out on project sites. Often, for some of our larger-scale projects, we find ourselves in collaborative partnerships with our rivals,'” Fields commented. “At one moment, they’re our partners in a project, and in the next, they could be our competitors for fresh contracts. By engaging in these joint ventures, we’re effectively inviting our competition into our network.”

So, it is imperative that Laing O’Rourke delivers secure network access to staff, clients and JV partners in a hot-desking environment AND satisfy clients demanding adherence to different frameworks and certification. The company must also prevent threat actors — as well as anyone who could benefit competitively, financially, or in any other way – – from accessing or exfiltrating information from the network.

And they did it this by adding two different Cisco solutions to the stack: Cisco Secure Firewall and Cisco Identity Services Engine (ISE).

Streamlining security in the face of unnecessary, time-consuming tasks


Getting backing from leadership to invest in the best traffic and threat management tools can seem impossible for many teams. Thankfully, Fields has enthusiastic backing from the board.

“My team and I are truly passionate about cybersecurity, and we have the board’s support not just for compliance’s sake (not just performing a tick box exercise), but also for establishing the best practices and instilling a cyber-centric mindset throughout the business.”

But that doesn’t mean it’s been easy building that framework.

As a snapshot, before Cisco ISE, Fields says, “Our joint venture partners and clients had a potential risk of unintentionally (or deliberately) accessing our corporate network due to shared office space. This prevented business agility, necessitating fixed desks. Consequently, IT had to frequently reconfigure ports on project sites as staff assignments changed based on project phases or collaboration needs.”

Developing those pre-designed workspaces based on whether the user was from Laing O’Rourke, or a JV took precious time and energy that could have been used elsewhere. The Laing O’Rourke team needed intelligent automation to streamline the process.

Laing O’Rourke already had multiple firewalls in place, but it needed a Cisco Secure Firewall to help the company control network access, prevent intrusions and exfiltration, filter URLs, and conduct deep packet inspection. Meanwhile, Cisco ISE would help wrangle all those joint venture devices.

Since the Laing O’Rourke team was already using Cisco switches and was familiar with how Cisco solutions work, it made the choice to add more Cisco to the stack all that much easier.

“We, like most enterprises, use Cisco switches at our core and at the edge. So it made sense to talk to Cisco about how they could help us protect our network.”

Using Cisco Secure Firewall to streamline access and safeguard the network


Laing O’Rourke needed physical security that could accommodate hybrid staff members and contractors through hot-desking (multiple workers using a single physical workstation) and achieving seamless connectivity and network management was crucial.

To address this, Laing O’Rourke turned to Cisco Secure Firewall, allowing the company to achieve and maintain the confidentiality, integrity, and availability — the coveted CIA triad — of data. By effectively controlling network access and preventing unauthorized data changes, Cisco Secure Firewall played a pivotal role in safeguarding Laing O’Rourke’s network infrastructure.

Key stakeholders, including Fields, emphasized the importance of Cisco’s wide-ranging threat intelligence. These updates ensured that the firewalls remain current with the latest threat and vulnerability signatures, reinforcing the strength and effectiveness of Laing O’Rourke’s security measures.

By partnering with Cisco, Laing O’Rourke has enhanced its ability to identify and mitigate a wide range of threats by using advanced features of Cisco Secure Firewall, including intrusion prevention, URL filtering, and deep packet inspection capabilities.

The team also used Firewall Management Center (FMC) dashboards to manage firewalls using a single pane of glass, which was ultra-convenient when they needed insights on intrusion events, potential threats, and geolocation. Thanks to the proactive security measures implemented through Cisco’s Secure Firewall solution, Laing O’Rourke has experienced a considerable decrease in web-related vulnerability attacks.

Once the Cisco Firewall was in place for Laing O’Rourke, it was ready to do what it’s known for: helping prevent DDOS, malware, VPN, and many other attacks.

“When it comes to firewalling, we take a dual vendor approach. Around five years ago we went out to market to replace our [competitor] firewalls. Given our positive experience with Cisco’s networking equipment, Cisco FTD’s were on our shopping list,” Fields said. “We still take a dual vendor approach and Cisco is still helping secure our edge.”

Adding a zero-trust framework with ISE for identity


Cisco Secure Firewall has proven itself a formidable force to manage traffic and block threats, with automatic updates and frequent attack intel as a sweetener. But ISE has been a revelation for Laing O’Rourke, giving the team a firm, confident hand when managing IP phones, tablets, and laptops – all used to conduct business.

“ISE was a real game changer for us. It has transformed the way we operate on project sites, negating the need for predefined workspaces based on if the user was a Laing O’Rourke staff member, JV partner, client, or guest, while simultaneously increasing protection of our corporate network”.

With ISE, ports can be configured to dynamically reconfigure a port based on security posture and device ownership, permitting access to the right network segments at the right time. This includes access to the company’s corporate wireless (and wired) networks, guest Wi-Fi, and BYOD – including operational technology (OT) networks.

Enterprise security: Making hot desking secure and accessible on a global scale

“While ISE takes a bit of effort to set up right, once it up and running, it’s a very stable platform, easy to configure and integrates well with other security platforms like Firewall Threat Defense (FTD) and mobile device management (MDM) solutions,” Fields said.

If he had to name three things that make Cisco ISE a solid solution for Laing O’Rourke, Fields spoke of dynamic profiling that detects device type and applies the right policy, the MDM integration and compliance check that makes sure devices are up-to-date, and anomalous behaviour detection.

According to Fields, many years ago, a pen-tester discovered a technical gap that absolutely needed to be closed. So now when an IP phone starts to communicate as Windows traffic, for instance, ISE catches it with behavioural detection.

“With the lack of physical security on our project sites, along with actively inviting our competitors onto our network, seems like a disaster waiting to happen,” he said. “Cisco ISE has proven to be an invaluable solution for segregating access between our employees and our clients and partners, protecting us from threat actors and rogue network devices.”

Cisco Secure Firewall and ISE save money and time


Many network and security pros understand how painful it can be to secure a network – especially one that’s distributed. But with a Cisco Secure Firewall in play and ISE to manage BYODs, Laing O’Rourke’s networking team has already seen a difference.

To start, those Monday morning calls about desk moves and disrupted network access are no more. Laing O’Rourke is saving minutes, hours, and days, while simultaneously bolstering network security:  something that notoriously…takes time.

The user experience has improved, and the team has more time to focus on threats. Though Laing O’Rourke uses a dual vendor approach, Cisco is the go-to for this critical, global company, with ROI already evident once the company’s other firewalls were replaced with Cisco Firewalls.

“The [competitor] firewalls were significantly more expensive and offered no additional functionality. The replacement [Cisco] actually saved us money,” Fields said. “What I can say is one of the few things that doesn’t keep me up at night is our network uptime or network-based security — thanks to Cisco Firewall Threat Defense (FTD) and Cisco ISE.”

Source: cisco.com

Tuesday, 12 March 2024

Dashify: Solving Data Wrangling for Dashboards

This post is about Dashify, the Cisco Observability Platform’s dashboarding framework. We are going to describe how AppDynamics, and partners, use Dashify to build custom product screens, and then we are going to dive into details of the framework itself. We will describe its specific features that make it the most powerful and flexible dashboard framework in the industry.

What are dashboards?


Dashboards are data-driven user interfaces that are designed to be viewed, edited, and even created by product users. Product screens themselves are also built with dashboards. For this reason, a complete dashboard framework provides leverage for both the end users looking to share dashboards with their teams, and the product-engineers of COP solutions like Cisco Cloud Observability.

In the observability space most dashboards are focused on charts and tables for rendering time series data, for example “average response time” or “errors per minute”. The image below shows the COP EBS Volumes Overview Dashboard, which is used to understand the performance of Elastic Block Storage (EBS) on Amazon Web Services. The dashboard features interactive controls (dropdowns) that are used to further-refine the scenario from all EBS volumes to, for example unhealthy EBS volumes in US-WEST-1.

Dashify: Solving Data Wrangling for Dashboards

Several other dashboards are provided by our Cisco Cloud Observability app for monitoring other AWS systems. Here are just a few examples of the rapidly expanding use of Dashify dashboards across the Cisco Observability Platform.

  • EFS Volumes
  • Elastic Load Balancers
  • S3 Buckets
  • EC2 Instances

Why Dashboards


No observability product can “pre-imagine” every way that customers want to observe their systems. Dashboards allow end-users to create custom experiences, building on existing in-product dashboards, or creating them from scratch. I have seen large organizations with more than 10,000 dashboards across dozens of teams.

Dashboards are a cornerstone of observability, forming a bridge between a remote data source, and local display of data in the user’s browser. Dashboards are used to capture “scenarios” or “lenses” on a particular problem. They can serve a relatively fixed use case, or they can be ad-hoc creations for a troubleshooting “war room.” A dashboard performs many steps and queries to derive the data needed to address the observability scenario, and to render the data into visualizations. Dashboards can be authored once, and used by many different users, leveraging the know-how of the author to enlighten the audience. Dashboards play a critical role in low-level troubleshooting and in rolling up high-level business KPIs to executives.

Dashify: Solving Data Wrangling for Dashboards

The goal of dashboard frameworks has always been to provide a way for users, as opposed to ‘developers’, to build useful visualizations. Inherent to this “democratization” of visualizations is the notion that building a dashboard must somehow be easier than a pure JavaScript app development approach. Afterall, dashboards cater to users, not hardcore developers.

The problem with dashboard frameworks


The diagram below illustrates how a traditional dashboard framework allows the author to configure and arrange components but does not allow the author to create new components or data sources. The dashboard author is stuck with whatever components, layouts, and data sources are made available. This is because the areas shown in red are developed in JavaScript and are provided by the framework. JavaScript is neither a secure, nor easy technology to learn, therefore it is rarely exposed directly to authors. Instead, dashboards expose a JSON or YAML based DSL. This typically leaves field teams, SEs, and power users in the position of waiting for the engineering team to release new components, and there is almost always a deep feature backlog.

Dashify: Solving Data Wrangling for Dashboards

I have personally seen this scenario play out many times. To take a real example, a team building dashboards for IT services wanted rows in a table to be colored according to a “heat map”. This required a feature request to be logged with engineering, and the core JavaScript-based Table component had to be changed to support heat maps. It became typical for the core JS components to become a mishmash of domain-driven spaghetti code. Eventually the code for Table itself was hard to find amidst the dozens of props and hidden behaviors like “heat maps”. Nobody was happy with the situation, but it was typical, and core component teams mostly spent their sprint cycles building domain behaviors and trying to understand the spaghetti. What if dashboard authors themselves on the power-user end of the spectrum could be empowered to create components themselves?

Enter Dashify


Dashify’s mission is to remove the barrier of “you can’t do that” and “we don’t have a component for that”. To accomplish this, Dashify rethinks some of the foundations of traditional dashboard frameworks. The diagram below shows that Dashify shifts the boundaries around what is “built in” and what is made completely accessible to the Author. This radical shift allows the core framework team to focus on “pure” visualizations, and empowers domain teams, who author dashboards, to build domain specific behaviors like “IT heat maps” without being blocked by the framework team.

Dashify: Solving Data Wrangling for Dashboards

To accomplish this breakthrough, Dashify had to solve the key challenge of how to simplify and expose reactive behavior and composition without cracking open the proverbial can of JavaScript worms. To do this, Dashify leveraged a new JSON/YAML meta-language, created at Cisco in the open source, for the purpose of declarative, reactive state management. This new meta-language is called “Stated,” and it is being used to drive dashboards, as well as many other JSON/YAML configurations within the Cisco Observability Platform. Let’s take a simple example to show how Stated enables a dashboard author to insert logic directly into a dashboard JSON/YAML.

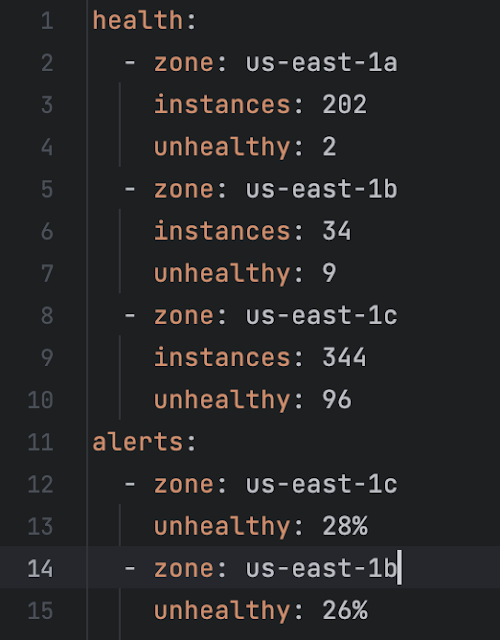
Suppose we receive data from a data source that provides “health” about AWS availability zones. Assume the health data is updated asynchronously. Now suppose we wish to bind the changing health data to a table of “alerts” according to some business rules:

1. only show alerts if the percentage of unhealthy instances is greater than 10%
2. show alerts in descending order based on percentage of unhealthy instances
3. update the alerts every time the health data is updated (in other words declare a reactive dependency between alerts and health).

This snippet illustrates a desired state, that adheres to the rules.

Dashify: Solving Data Wrangling for Dashboards

But how can we build a dashboard that continuously adheres to the three rules? If the health data changes, how can we be sure the alerts will be updated? These questions get to the heart of what it means for a system to be Reactive. This Reactive scenario is at best difficult to accomplish in today’s popular dashboard frameworks.

Notice we have framed this problem in terms of the data and relationships between different data items (health and alerts), without mentioning the user interface yet. In the diagram above, note the “data manipulation” layer. This layer allows us to create exactly these kinds of reactive (change driven) relationships between data, decoupling the data from the visual components.

Let’s look at how easy it is in Dashify to create a reactive data rule that captures our three requirements. Dashify allows us to replace *any* piece of a dashboard with a reactive rule, so we simply write a reactive rule that generates the alerts from the health. The Stated rule, beginning on line 12 is a JSONata expression. Feel free to try it yourself here.

Dashify: Solving Data Wrangling for Dashboards

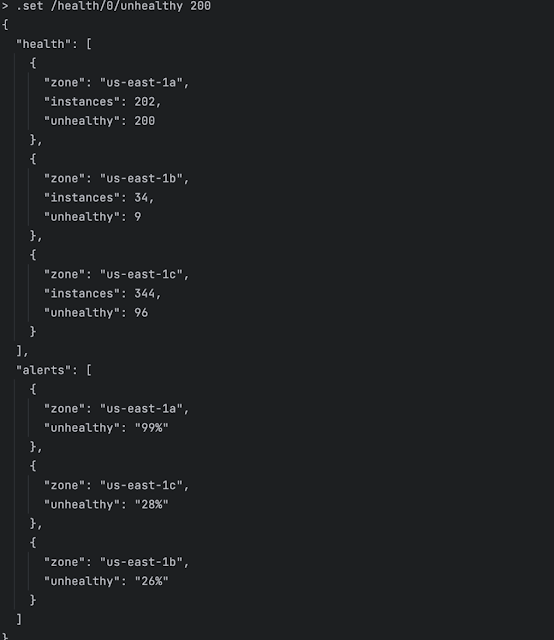
One of the most interesting things is that it appears you don’t have to “tell” Dashify what data your rule depends on. You just write your rule. This simplicity is enabled by Stated’s compiler, which analyzes all the rules in the template and produces a Reactive change graph. If you change anything that the ‘alerts’ rule is looking at, the ‘alerts’ rule will fire, and recompute the alerts. Let’s quickly prove this out using the stated REPL which lets us run and interact with Stated templates like Dashify dashboards. Let’s see what happens if we use Stated to change the first zone’s unhealthy count to 200. The screenshot below shows execution of the command “.set /health/0/unhealthy 200” in the Stated JSON/YAML REPL. Dissecting this command, it says “set the value at json pointer /health/0/unhealthy to value 200”. We see that the alerts are immediately recomputed, and that us-east-1a is now present in the alerts with 99% unhealthy.

Dashify: Solving Data Wrangling for Dashboards

By recasting much of dashboarding as a reactive data problem, and by providing a robust in-dashboard expression language, Dashify allows authors to do both traditional dashboard creation, advanced data bindings, and reusable component creation. Although quite trivial, this example clearly shows how Dashify differentiates its core technology from other frameworks that lack reactive, declarative, data bindings. In fact, Dashify is the first, and only framework to feature declarative, reactive, data bindings.

Let’s take another example, this time fetching data from a remote API. Let’s say we want to fetch data from the Star Wars REST api. Business requirements:

  • Developer can set how many pages of planets to return
  • Planet details are fetched from star wars api (https://swapi.dev)
  • List of planet names is extracted from returned planet details
  • User should be able to select a planet from the list of planets
  •  ‘residents’ URLs are extracted from planet info (that we got in step 2), and resident details are fetched for each URL
  • Full names of inhabitants are extracted from resident details and presented as list

Again, we see that before we even consider the user interface, we can cast this problem as a data fetching and reactive binding problem. The dashboard snippet below shows how a value like “residents” is reactively bound to selectedPlanet and how map/reduce style set operators are applied to entire results of a REST query. Again, all the expressions are written in the grammar of JSONata.

Dashify: Solving Data Wrangling for Dashboards

To demonstrate how you can interact with and test such a snippet, checkout This github gist shows a REPL session where we:

1. load the JSON file and observe the default output for Tatooine
2. Display the reactive change-plan for planetName
3. Set the planet name to “Coruscant”
4. Call the onSelect() function with “Naboo” (this demonstrates that we can create functions accessible from JavaScript, for use as click handlers, but produces the same result as directly setting planetName)

From this concise example, we can see that dashboard authors can easily handle fetching data from remote APIs, and perform extractions and transformations, as well as establish click handlers. All these artifacts can be tested from the Stated REPL before we load them into a dashboard. This remarkable economy of code and ease of development cannot be achieved with any other dashboard framework.

If you are curious, these are the inhabitants of Naboo:

Dashify: Solving Data Wrangling for Dashboards

What’s next?


We have shown a lot of “data code” in this post. This is not meant to imply that building Dashify dashboards requires “coding”. Rather, it is to show that the foundational layer, which supports our Dashboard building GUIs is built on very solid foundation. Dashify recently made its debut in the CCO product with the introduction of AWS monitoring dashboards, and Data Security Posture Management screens. Dashify dashboards are now a core component of the Cisco Observability Platform and have been proven out over many complex use cases. In calendar Q2 2024, COP will introduce the dashboard editing experience which provides authors with built in visual drag-n-drop style editing of dashboards. Also in calendar Q2, COP introduces the ability to bundle dashify dashboards into COP solutions allowing third party developers to unleash their dashboarding skills. So, weather you skew to the “give me a gui” end of the spectrum or the “let me code” lifestyle, Dashify is designed to meet your needs.

Summing it up


Dashboards are a key, perhaps THE key technology in an observability platform. Existing dashboarding frameworks present unwelcome limits on what authors can do. Dashify is a new dashboarding framework born from many collective years of experience building both dashboard frameworks and their visual components. Dashify brings declarative, reactive state management into the hands of dashboard authors by incorporating the Stated meta-language into the JSON and YAML of dashboards. By rethinking the fundamentals of data management in the user interface, Dashify allows authors unprecedented freedom. Using Dashify, domain teams can ship complex components and behaviors without getting bogged down in the underlying JavaScript frameworks. Stay tuned for more posts where we dig into the exciting capabilities of Dashify: Custom Dashboard Editor, Widget Playground, and Scalable Vector Graphics.

Source: cisco.com

Saturday, 9 March 2024

Protect Your Cloud Environments with Data Security Observability

Protect Your Cloud Environments with Data Security Observability

Data is the new fuel for business growth


Data is at the heart of seemingly everything these days, from the smart devices in our homes to the mobile apps we use on the go every day. This wealth of information at our fingertips allows us to correlate data points and determine patterns and outcomes faster than humanly possible — enabling us to predict and quickly thwart adverse events on the horizon. We know that the volume of data collected by organizations is a goldmine of information that, when leveraged correctly, can empower growth. We also know that clean data, free of sensitive information, is critical for fueling GenAI initiatives across the globe. However, this uptick in data creation and usage also amplifies the need for organizations to ensure that they handle data responsibly and adhere to increasingly stringent data regulatory standards.

With astronomical amounts of data constantly being generated, tracked, and stored – it’s become more important than ever to secure it and be able to answer several key questions: Where is my data? Who is accessing my data? And is my data secure?

Introducing Observability for Data Security Posture Management (DSPM)


The new Data Security module announced at Cisco Live 2024 Amsterdam is now generally available. It expands our business risk observability capabilities for cloud environments and delivers automated data discovery and classification in data stores like Snowflake and AWS S3. The new module provides real-time data insights that help visualize, prioritize, and act on security issues before they become revenue-impacting.

A quick look at the new data security capabilities:

◉ Discovery and classification of sensitive data: Easily identify all data stores and data entities, to quickly focus on securing sensitive data.

◉ Data access control: Understand which users, roles, and applications are accessing your data and who have access to personally identifiable information. Seamlessly adopt a least privilege approach by detecting unused privileges and locking down access to your data stores.

◉ Exfiltration attempt detection: Unlock GenAI-based detection and remediation guidance for data exfiltration attempts to stop attackers in their tracks.

◉ Identify security risks: Efficiently detect unencrypted buckets, dormant risky users and siloed unused data entities to reduce your overall security risk posture.

Protect Your Cloud Environments with Data Security Observability

The future of data security


With data being created and moving at the speed of light every day, it can be overwhelming to keep track of exactly where the data is and how it’s being stored – let alone comprehensively securing it. Automation is imperative to keep up, and choosing the right tool will enable you to continue leveraging data and innovating while knowing your data is secure. The Data Security module provides teams with deep visibility and actionable insights to effortlessly protect data at scale. The future of data security relies on our ability to put adequate security controls in place now, so we can embrace the full potential of data and the unlimited capabilities that it unlocks.

Source: cisco.com

Thursday, 7 March 2024

Using the Power of Artificial Intelligence to Augment Network Automation

Talking to your Network


Embarking on my journey as a network engineer nearly two decades ago, I was among the early adopters who recognized the transformative potential of network automation. In 2015, after attending Cisco Live in San Diego, I gained a new appreciation of the realm of the possible. Leveraging tools like Ansible and Cisco pyATS, I began to streamline processes and enhance efficiencies within network operations, setting a foundation for what would become a career-long pursuit of innovation. This initial foray into automation was not just about simplifying repetitive tasks; it was about envisioning a future where networks could be more resilient, adaptable, and intelligent. As I navigated through the complexities of network systems, these technologies became indispensable allies, helping me to not only manage but also to anticipate the needs of increasingly sophisticated networks.

Using the Power of Artificial Intelligence to Augment Network Automation

In recent years, my exploration has taken a pivotal turn with the advent of generative AI, marking a new chapter in the story of network automation. The integration of artificial intelligence into network operations has opened up unprecedented possibilities, allowing for even greater levels of efficiency, predictive analysis, and decision-making capabilities. This blog, accompanying the CiscoU Tutorial, delves into the cutting-edge intersection of AI and network automation, highlighting my experiences with Docker, LangChain, Streamlit, and, of course, Cisco pyATS. It’s a reflection on how the landscape of network engineering is being reshaped by AI, transforming not just how we manage networks, but how we envision their growth and potential in the digital age. Through this narrative, I aim to share insights and practical knowledge on harnessing the power of AI to augment the capabilities of network automation, offering a glimpse into the future of network operations.

In the spirit of modern software deployment practices, the solution I architected is encapsulated within Docker, a platform that packages an application and all its dependencies in a virtual container that can run on any Linux server. This encapsulation ensures that it works seamlessly in different computing environments. The heart of this dockerized solution lies within three key files: the Dockerfile, the startup script, and the docker-compose.yml.

The Dockerfile serves as the blueprint for building the application’s Docker image. It starts with a base image, ubuntu:latest, ensuring that all the operations have a solid foundation. From there, it outlines a series of commands that prepare the environment:

FROM ubuntu:latest

# Set the noninteractive frontend (useful for automated builds)
ARG DEBIAN_FRONTEND=noninteractive

# A series of RUN commands to install necessary packages
RUN apt-get update && apt-get install -y wget sudo ...

# Python, pip, and essential tools are installed
RUN apt-get install python3 -y && apt-get install python3-pip -y ...

# Specific Python packages are installed, including pyATS[full]
RUN pip install pyats[full]

# Other utilities like dos2unix for script compatibility adjustments
RUN sudo apt-get install dos2unix -y

# Installation of LangChain and related packages
RUN pip install -U langchain-openai langchain-community ...

# Install Streamlit, the web framework
RUN pip install streamlit

Each command is preceded by an echo statement that prints out the action being taken, which is incredibly helpful for debugging and understanding the build process as it happens.

The startup.sh script is a simple yet crucial component that dictates what happens when the Docker container starts:

cd streamlit_langchain_pyats
streamlit run chat_with_routing_table.py

It navigates into the directory containing the Streamlit app and starts the app using streamlit run. This is the command that actually gets our app up and running within the container.

Lastly, the docker-compose.yml file orchestrates the deployment of our Dockerized application. It defines the services, volumes, and networks to run our containerized application:

version: '3'
services:
 streamlit_langchain_pyats:
  image: [Docker Hub image]
  container_name: streamlit_langchain_pyats
  restart: always
  build:
   context: ./
   dockerfile: ./Dockerfile
  ports:
   - "8501:8501"

This docker-compose.yml file makes it incredibly easy to manage the application lifecycle, from starting and stopping to rebuilding the application. It binds the host’s port 8501 to the container’s port 8501, which is the default port for Streamlit applications.

Together, these files create a robust framework that ensures the Streamlit application — enhanced with the AI capabilities of LangChain and the powerful testing features of Cisco pyATS — is containerized, making deployment and scaling consistent and efficient.

The journey into the realm of automated testing begins with the creation of the testbed.yaml file. This YAML file is not just a configuration file; it’s the cornerstone of our automated testing strategy. It contains all the essential information about the devices in our network: hostnames, IP addresses, device types, and credentials. But why is it so crucial? The testbed.yaml file serves as the single source of truth for the pyATS framework to understand the network it will be interacting with. It’s the map that guides the automation tools to the right devices, ensuring that our scripts don’t get lost in the vast sea of the network topology.

Sample testbed.yaml


---
devices:
  cat8000v:
    alias: "Sandbox Router"
    type: "router"
    os: "iosxe"
    platform: Cat8000v
    credentials:
      default:
        username: developer
        password: C1sco12345
    connections:
      cli:
        protocol: ssh
        ip: 10.10.20.48
        port: 22
        arguments:
        connection_timeout: 360

With our testbed defined, we then turn our attention to the _job file. This is the conductor of our automation orchestra, the control file that orchestrates the entire testing process. It loads the testbed and the Python test script into the pyATS framework, setting the stage for the execution of our automated tests. It tells pyATS not only what devices to test but also how to test them, and in what order. This level of control is indispensable for running complex test sequences across a range of network devices.

Sample _job.py pyATS Job


import os
from genie.testbed import load

def main(runtime):

    # ----------------
    # Load the testbed
    # ----------------
    if not runtime.testbed:
        # If no testbed is provided, load the default one.
        # Load default location of Testbed
        testbedfile = os.path.join('testbed.yaml')
        testbed = load(testbedfile)
    else:
        # Use the one provided
        testbed = runtime.testbed

    # Find the location of the script in relation to the job file
    testscript = os.path.join(os.path.dirname(__file__), 'show_ip_route_langchain.py')

    # run script
    runtime.tasks.run(testscript=testscript, testbed=testbed)

Then comes the pièce de résistance, the Python test script — let’s call it capture_routing_table.py. This script embodies the intelligence of our automated testing process. It’s where we’ve distilled our network expertise into a series of commands and parsers that interact with the Cisco IOS XE devices to retrieve the routing table information. But it doesn’t stop there; this script is designed to capture the output and elegantly transform it into a JSON structure. Why JSON, you ask? Because JSON is the lingua franca for data interchange, making the output from our devices readily available for any number of downstream applications or interfaces that might need to consume it. In doing so, we’re not just automating a task; we’re future-proofing it.

Excerpt from the pyATS script


    @aetest.test
    def get_raw_config(self):
        raw_json = self.device.parse("show ip route")

        self.parsed_json = {"info": raw_json}

    @aetest.test
    def create_file(self):
        with open('Show_IP_Route.json', 'w') as f:
            f.write(json.dumps(self.parsed_json, indent=4, sort_keys=True))

By focusing solely on pyATS in this phase, we lay a strong foundation for network automation. The testbed.yaml file ensures that our script knows where to go, the _job file gives it the instructions on what to do, and the capture_routing_table.py script does the heavy lifting, turning raw data into structured knowledge. This approach streamlines our processes, making it possible to conduct comprehensive, repeatable, and reliable network testing at scale.

Using the Power of Artificial Intelligence to Augment Network Automation

Enhancing AI Conversational Models with RAG and Network JSON: A Guide


In the ever-evolving field of AI, conversational models have come a long way. From simple rule-based systems to advanced neural networks, these models can now mimic human-like conversations with a remarkable degree of fluency. However, despite the leaps in generative capabilities, AI can sometimes stumble, providing answers that are nonsensical or “hallucinated” — a term used when AI produces information that isn’t grounded in reality. One way to mitigate this is by integrating Retrieval-Augmented Generation (RAG) into the AI pipeline, especially in conjunction with structured data sources like network JSON.

What is Retrieval-Augmented Generation (RAG)?


Retrieval-Augmented Generation is a cutting-edge technique in AI language processing that combines the best of two worlds: the generative power of models like GPT (Generative Pre-trained Transformer) and the precision of retrieval-based systems. Essentially, RAG enhances a language model’s responses by first consulting a database of information. The model retrieves relevant documents or data and then uses this context to inform its generated output.

The RAG Process


The process typically involves several key steps:

  • Retrieval: When the model receives a query, it searches through a database to find relevant information.
  • Augmentation: The retrieved information is then fed into the generative model as additional context.
  • Generation: Armed with this context, the model generates a response that’s not only fluent but also factually grounded in the retrieved data.

The Role of Network JSON in RAG


Network JSON refers to structured data in the JSON (JavaScript Object Notation) format, often used in network communications. Integrating network JSON with RAG serves as a bridge between the generative model and the vast amounts of structured data available on networks. This integration can be critical for several reasons:
  • Data-Driven Responses: By pulling in network JSON data, the AI can ground its responses in real, up-to-date information, reducing the risk of “hallucinations.”
  • Enhanced Accuracy: Access to a wide array of structured data means the AI’s answers can be more accurate and informative.
  • Contextual Relevance: RAG can use network JSON to understand the context better, leading to more relevant and precise answers.

Why Use RAG with Network JSON?


Let’s explore why one might choose to use RAG in tandem with network JSON through a simplified example using Python code:

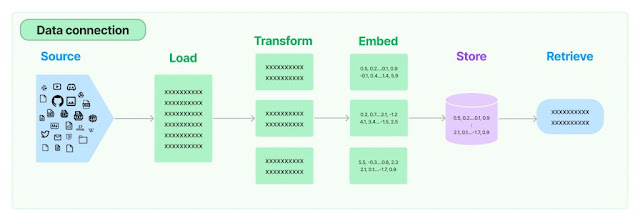
  • Source and Load: The AI model begins by sourcing data, which could be network JSON files containing information from various databases or the internet.
  • Transform: The data might undergo a transformation to make it suitable for the AI to process — for example, splitting a large document into manageable chunks.
  • Embed: Next, the system converts the transformed data into embeddings, which are numerical representations that encapsulate the semantic meaning of the text.
  • Store: These embeddings are then stored in a retrievable format.
  • Retrieve: When a new query arrives, the AI uses RAG to retrieve the most relevant embeddings to inform its response, thus ensuring that the answer is grounded in factual data.

By following these steps, the AI model can drastically improve the quality of the output, providing responses that are not only coherent but also factually correct and highly relevant to the user’s query.

class ChatWithRoutingTable:
    def __init__(self):
        self.conversation_history = []
        self.load_text()
        self.split_into_chunks()
        self.store_in_chroma()
        self.setup_conversation_memory()
        self.setup_conversation_retrieval_chain()

    def load_text(self):
        self.loader = JSONLoader(
            file_path='Show_IP_Route.json',
            jq_schema=".info[]",
            text_content=False
        )
        self.pages = self.loader.load_and_split()

    def split_into_chunks(self):
        # Create a text splitter
        self.text_splitter = RecursiveCharacterTextSplitter(
            chunk_size=1000,
            chunk_overlap=100,
            length_function=len,
        )
        self.docs = self.text_splitter.split_documents(self.pages)

    def store_in_chroma(self):
        embeddings = OpenAIEmbeddings()
        self.vectordb = Chroma.from_documents(self.docs, embedding=embeddings)
        self.vectordb.persist()

    def setup_conversation_memory(self):
        self.memory = ConversationBufferMemory(memory_key="chat_history", return_messages=True)

    def setup_conversation_retrieval_chain(self):
        self.qa = ConversationalRetrievalChain.from_llm(llm, self.vectordb.as_retriever(search_kwargs={"k": 10}), memory=self.memory)

    def chat(self, question):
        # Format the user's prompt and add it to the conversation history
        user_prompt = f"User: {question}"
        self.conversation_history.append({"text": user_prompt, "sender": "user"})

        # Format the entire conversation history for context, excluding the current prompt
        conversation_context = self.format_conversation_history(include_current=False)

        # Concatenate the current question with conversation context
        combined_input = f"Context: {conversation_context}\nQuestion: {question}"

        # Generate a response using the ConversationalRetrievalChain
response = self.qa.invoke(combined_input)

        # Extract the answer from the response
answer = response.get('answer', 'No answer found.')

        # Format the AI's response
        ai_response = f"Cisco IOS XE: {answer}"
        self.conversation_history.append({"text": ai_response, "sender": "bot"})

        # Update the Streamlit session state by appending new history with both user prompt and AI response
        st.session_state['conversation_history'] += f"\n{user_prompt}\n{ai_response}"

        # Return the formatted AI response for immediate display
        return ai_response

Conclusion

The integration of RAG with network JSON is a powerful way to supercharge conversational AI. It leads to more accurate, reliable, and contextually aware interactions that users can trust. By leveraging the vast amounts of available structured data, AI models can step beyond the limitations of pure generation and towards a more informed and intelligent conversational experience.

Source: cisco.com