Monday 28 September 2020

Introduction to Programmability – Part 2

Cisco Prep, Cisco Tutorial and Material, Cisco Learning, Cisco Certification, Cisco Guides

Part 1 of this series defined and explained the terms Network Management, Automation, Orchestration, Data Modeling, Programmability, and APIs. It also introduced the Programmability Stack and explained how an application at the top layer of the stack, wishing to consume an API exposed by the device at the bottom of the stack, does that. The previous post covered data modeling in some detail due to the novelty of the concept for most network engineers. I’m sure that Part I, although quite lengthy, left you scratching your head. At least a little.

So, in this part of the series, I will try to clear some more of the ambiguity related to programmability. As discussed in the previous post, the API exposed by a device uses a specific protocol. For example, a device exposing a NETCONF API will use the NETCONF protocol. The same applies to RESTCONF, gRPC, or Native REST APIs. The choice of protocol also decides which data encoding to use, as well as the transport over which the application speaks with the device.

Where to start?

One of the problems with discussing programmability is where to start. If you start with a protocol, you will need to understand the encoding in order to decipher the contents of the protocol messages. But for you to appreciate the importance of encoding, you need to understand its application and use by the protocol. The chicken first, or the egg! Moreover, with respect to RESTful protocols, you will also need a pretty good understanding of the transport protocol, HTTP in this case, in order to put all the pieces together.

So in order to avoid unnecessary confusion, this part of the series will only cover NETCONF and XML. HTTP, REST, RESTCONF, and JSON will be covered in the next part. Finally, gRPC and GPB will be covered in one last part of this series.

Note: In this blog post we will make very good use of Cisco’s DevNet Sandboxes. In case you didn’t already know that, Cisco DevNet provides over 70 sandboxes that constitute devices in different technology areas, for you to experiment with during your studies. Some of those are always-on, available for immediate use, and others need a reservation. All the sandboxes can be found at: https://devnetsandbox.cisco.com/RM/Topology. For the purpose of this blog, the sandboxes that do not need a reservation will suffice. Any other excuses for not reading on?… I didn’t think so!

APIs: RPC vs REST

In the previous part of this series we looked at APIs and identified them as software running on a device. An API exposed by the device provides a particular function or service to other software that wish to consume this API. The internal workings of an API are usually hidden from the software that consumes it.

For example, Twitter exposes an API that a program can consume in order to tweet to an account automatically without human intervention. Similarly, Google exposes a Geolocation API that returns the location of a mobile device based on information about cell towers and WiFi nodes that the device detects and sends over to the API.

Similarly, an API exposed by, say, a router, is software running on the router that provides a number of functions that can be consumed by external software, such as a Python script.

APIs may be classified in a number of different ways. Several API types (and different classifications) exist today. For the purpose of this blog series, we will discuss two of the most commonly used types in the network programmability arena today: RPC-based APIs and RESTful APIs.

Remote Procedure Call (RPC)-based APIs

A Remote Procedure Call (RPC) is a programmatic method for a client to Call (execute) a Procedure (piece of code) on another device. Since the device requesting the execution of the procedure (the client) is different than the device actually executing that procedure (the server), it is labelled as Remote.

An RPC-based API opens a software channel on the server, exposing the API, to clients, wishing to consume that API, for those clients to request the remote execution of procedures on the server. Both NETCONF and gRPC are RPC-based protocols/APIs. This part of the series will cover NETCONF and describe its RPC-based operation.

Representational State Transfer (REST):

REST is a framework, specification or architectural style that was developed by Roy Fielding in his doctoral dissertations in 2000 on APIs. The REST framework specifies six constraints, five mandatory and one optional, on coding RESTful APIs. The REST framework requires that a RESTful API be:

◉ Client-Server based

◉ Stateless

◉ Cacheable

◉ Have a uniform interface

◉ Based on a layered system

◉ Utilize code-on-demand (Optional)

When an API is described as RESTful, then this API adheres to the constraints listed above.

To elaborate a little, a requirement such as “Stateless” mandates that the client send a request to the API exposed by the server. The server processes the request, sends back the response, and the transaction ends at this. The server does not maintain the state of this completed transaction. Of course, this is an over simplification of the process and a lot of corner cases exist. An API may also be fully RESTful, or just partially RESTful. It all depends on how much it adheres to the constrains listed here.

REST is an architectural style for programming APIs and uses HTTP as an application-layer protocol to implement this framework. Thus far, HTTP is the only protocol designed specifically to implement RESTful APIs. RETCONF is a RESTful protocol/API and will be the subject of an upcoming part of this series, along with HTTP.

Although gRPC is an RPC-based protocol/API, it still uses HTTP/2 at the transport layer (recall the programmability stack from Part I ?) You may find this a little confusing. While it is beyond the scope of this part of the series to describe the operation of gRPC and its encoding GBP, this will be covered in an upcoming part. Stay with me on this series, and I promise that you won’t regret it ! For the sake of accuracy, gRPC also supports JSON encoding.

NETCONF

Cisco Prep, Cisco Tutorial and Material, Cisco Learning, Cisco Certification, Cisco Guides
In the year 2003 the IETF assembled the NETCONF working group to study the shortcomings of the network management protocols and practices that were in use then (such as SNMP), and to design a new protocol that would overcome those shortcomings. Their answer was the NETCONF protocol. The core NETCONF protocol is defined in RFC 6241 and the application of NETCONF to model-based programmability using YANG models is defined in RFC 6244. NETCONF over SSH is covered on its own in RFC 6242.

Figure 1 illustrates the lifecycle of a typical NETCONF session.

Cisco Prep, Cisco Tutorial and Material, Cisco Learning, Cisco Certification, Cisco Guides

Figure 1 – The lifecycle of a typical NETCONF session

NETCONF is a client-server, session-based protocol. The client initiates a session to the server (the network device in this case) over a pre-configured TCP port (port 830 by default). The session is typically initiated using SSH, but it may use any other reliable transport protocol. Once established, the session remains so until it is torn down by either peer.

The requirement that the transport protocol be reliable means that only TCP-based protocols (such as SSH or TLS) are supported. UDP is not. The NETCONF RFC mandates that a NETCONF implementation support, at a minimum, NETCONF over SSH. The implementation may optionally support other transport protocols in addition to SSH.

The first thing that happens after a NETCONF session is up is an exchange of hello messages between the client and server (either peer may send their hello first). Hello messages provide information on which version of NETCONF is supported by each peer, as well as other device capabilities. Capabilities describe which components of NETCONF, as well as which data models, the device supports. Hello messages are exchanged only once per session, at the beginning of the session. Once hello messages are exchanged, the NETCONF session is in established state.

On an established NETCONF session, one or more remote procedure call messages (rpc for short) are sent by the client. Each of these rpc messages specify an operation for the server to carry out. The get-config operation, for example, is used to retrieve the configuration of the device and the edit-config operation is used to edit the configuration on the device.

The server executes the operation, as specified in the rpc message (or not) and responds with a remote procedure call reply (rpc-reply for short) back to the client. The rpc-reply message contents will depend on which operation was requested by the client, the parameters included in the message, and whether the operation execution was successful or not.

All NETCONF messages (hello, rpc and rpc-reply) must be a well-formed XML document encoded in UTF-8. However, the content of these messages will depend on the data model referenced by the message. You will see what this means shortly !

In a best-case scenario, the client gracefully terminates the session by sending an rpc message to the server explicitly requesting that the connection be closed, using a close-session operation. The server terminates the session and the transport connection is torn down. In a not-so-good scenario, the transport connection may be unexpectedly lost due to a transmission problem, and the server unilaterally kills the session.

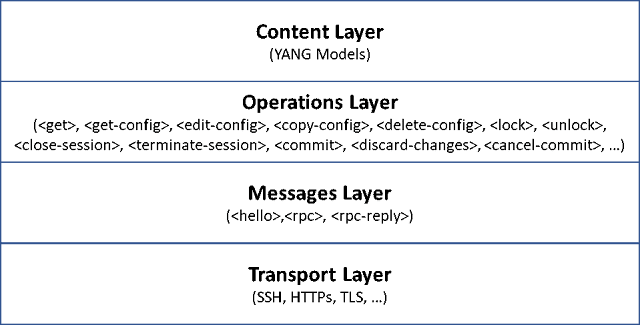
The architectural components of NETCONF discussed thus far can be summarized by the 4-layer model in Figure 2. The 4 layers are Transport, Messages, Operations and Content.

Cisco Prep, Cisco Tutorial and Material, Cisco Learning, Cisco Certification, Cisco Guides

Figure 2 – The NETCONF architectural 4-Layer model

Now roll up your sleeves and get ready. Open the command prompt on your Windows machine or the Terminal program on your Linux or MAC OS machine and SSH to Cisco’s always-on IOS-XE sandbox on port 10000 using the command:

[kabuelenain@server1 ~]$ ssh -p 10000 developer@ios-xe-mgmt-latest.cisco.com

When prompted for the password, enter C1sco12345. Once the SSH connection goes through, the router will spit out its hello message as you can see in Example 1.

[kabuelenain@server1 ~]$ ssh -p 10000 developer@ios-xe-mgmt-latest.cisco.com
developer@ios-xe-mgmt-latest.cisco.com's password:

<?xml version="1.0" encoding="UTF-8"?>
<hello xmlns="urn:ietf:params:xml:ns:netconf:base:1.0">
    <capabilities>
        <capability>urn:ietf:params:netconf:base:1.0</capability>
        <capability>urn:ietf:params:netconf:base:1.1</capability>
        <capability>urn:ietf:params:netconf:capability:writable-running:1.0</capability>
        <capability>urn:ietf:params:netconf:capability:xpath:1.0</capability>
        <capability>urn:ietf:params:netconf:capability:validate:1.0</capability>
        <capability>urn:ietf:params:netconf:capability:validate:1.1</capability>
        <capability>urn:ietf:params:netconf:capability:rollback-on-error:1.0</capability>
        <capability>urn:ietf:params:netconf:capability:notification:1.0</capability>
        <capability>urn:ietf:params:netconf:capability:interleave:1.0</capability>
        <capability>urn:ietf:params:netconf:capability:with-defaults:1.0?basic-mode=explicit&amp;also-supported=report-all-tagged</capability>
        <capability>urn:ietf:params:netconf:capability:yang-library:1.0?revision=2016-06-21&amp;module-set-id=730825758336af65af9606c071685c05</capability>
        <capability>http://tail-f.com/ns/netconf/actions/1.0</capability>
        <capability>http://tail-f.com/ns/netconf/extensions</capability>
        <capability>http://cisco.com/ns/cisco-xe-ietf-ip-deviation?module=cisco-xe-ietf-ip-deviation&amp;revision=2016-08-10</capability>
        <capability>http://cisco.com/ns/cisco-xe-ietf-ipv4-unicast-routing-deviation?module=cisco-xe-ietf-ipv4-unicast-routing-deviation&amp;revision=2015-09-11</capability>
        <capability>http://cisco.com/ns/cisco-xe-ietf-ipv6-unicast-routing-deviation?module=cisco-xe-ietf-ipv6-unicast-routing-deviation&amp;revision=2015-09-11</capability>
        <capability>http://cisco.com/ns/cisco-xe-ietf-ospf-deviation?module=cisco-xe-ietf-ospf-deviation&amp;revision=2018-02-09</capability>

------ Output omitted for brevity ------

    </capabilities>
    <session-id>468</session-id>
</hello>]]>]]>

Example 1 – Hello message from the router (NETCONF server)

Before getting into XML, note that the hello message contains a list of capabilities. These capabilities list three things about the device sending the hello message:

◉ The version(s) of NETCONF supported by the device (1.0 or 1.1)
◉ The optional NETCONF capabilities supported by the device (such as rollback-on-error)
◉ The YANG data models supported by the device

To respond to the server hello, all you need to do is copy and paste the hello message in Example 2 into your terminal.

<?xml version="1.0" encoding="UTF-8"?>
<hello
    xmlns="urn:ietf:params:xml:ns:netconf:base:1.0">
    <capabilities>
        <capability>urn:ietf:params:netconf:base:1.0</capability>
    </capabilities>
</hello>]]>]]>

Example 2 – Hello message from the client (your machine) back to the server

We will break down these messages in a minute – hold your breath!

Example 3 shows an rpc message to retrieve the configuration of interface GigabitEthernet1.

<rpc xmlns="urn:ietf:params:xml:ns:netconf:base:1.0" message-id="101">
    <get-config>
        <source>
            <running />
        </source>
        <filter>
            <native xmlns="http://cisco.com/ns/yang/Cisco-IOS-XE-native">
                <interface>
                    <GigabitEthernet>
                        <name>1</name>
                    </GigabitEthernet>
                </interface>
            </native>
        </filter>
    </get-config>
</rpc>]]>]]>

Example 3 – rpc message to retrieve the configuration of interface GigabitEthernet1

When you copy and paste this message into your terminal (right after the hello), you will receive the rpc-reply message in Example 4.

<?xml version="1.0" encoding="UTF-8"?>
<rpc-reply xmlns="urn:ietf:params:xml:ns:netconf:base:1.0" message-id="101">
    <data>
        <native xmlns="http://cisco.com/ns/yang/Cisco-IOS-XE-native">
            <interface>
                <GigabitEthernet>
                    <name>1</name>
                    <description>MANAGEMENT INTERFACE - DON'T TOUCH ME</description>
                    <ip>
                        <address>
                            <primary>
                                <address>10.10.20.48</address>
                                <mask>255.255.255.0</mask>
                            </primary>
                        </address>
                        <nat
                            xmlns="http://cisco.com/ns/yang/Cisco-IOS-XE-nat">
                            <outside/>
                        </nat>
                    </ip>
                    <mop>
                        <enabled>false</enabled>
                        <sysid>false</sysid>
                    </mop>
                    <negotiation
                        xmlns="http://cisco.com/ns/yang/Cisco-IOS-XE-ethernet">
                        <auto>true</auto>
                    </negotiation>
                </GigabitEthernet>
            </interface>
        </native>
    </data>
</rpc-reply>]]>]]>

Example 4 – rpc-reply message containing the configuration of interface GigabitEthernet1

Note that that the rpc message in Example 3 contains the XML elements rpc and get-config (highlighted in the example). The first indicates the message type and the second is the operation.

The rpc-reply message in Example 4 contains the XML elements rpc-reply and data (highlighted in the example). Again, the first is the message type and the second is the element that will contain all the data retrieved in case the operation in the rpc message is get or get-config.

The above examples are intended to give you a taste of NETCONF. Now let’s get into XML so we can dissect and decipher the 3 types of NETCONF messages.

eXtensible Markup Language (XML) – an interlude

Markup is information that you include in a document in the form of annotations. This information is not part of the original document content and is included only to provide information describing the sections of the document. A packaging of sorts. This markup is done in XML using elements.

Elements in XML are sections of the document identified by start and end tags. Take for example the following element in Example 4:

<description>MANAGEMENT INTERFACE - DON'T TOUCH ME</description>

This element name is description and is identified by the start tag <description> and end tag </description>. Notice the front slash (/) at the beginning of the end tag identifying it as an end tag. The tags are the markup and the content or data is the text between the tags. Not to state the obvious, but the start and end tags must have identical names, including the case. Having different start and end tags defies the whole purpose of the tag.

Elements may be nested under other elements. As a matter of fact, one of the purposes of markup in general and XML in particular is to define hierarchy. Child elements nested under parent elements are included within the start and end tags of the parent element. The description element is included inside the start and end tags of the GigabitEthernet element, which in turn is included inside the tag pair of its parent element interface.

A start and end tag with nothing in-between is an empty element. So an empty description element would look like:

<description></description>

But an alternative, shorter, representation of an empty element uses a single tag with a slash at the end of the tag:

<description/>

The top-most element is called the document or root element. All other elements in the document are children to the root element. In the case of NETCONF messages, the root element is always one of three options: hello, rpc or rpc-reply.

You may have noticed the very first line above the root element:

<?xml version="1.0" encoding="UTF-8"?>

This line is called the XML declaration. Very simply put, it tells the program (parser) that will read the XML document what version of XML and encoding are used. In this case, we are using XML version 1.0 and UTF-8 encoding, which is the encoding mandated by the NETCONF RFC.

The final piece of the puzzle are the attributes. Notice the root element start tag in Examples 3 and 4:

Example 3: <rpc xmlns="urn:ietf:params:xml:ns:netconf:base:1.0" message-id="101">
Example 4: <rpc-reply xmlns="urn:ietf:params:xml:ns:netconf:base:1.0" message-id="101">

The words xmlns and message-id are called attributes. Attributes are used to provide information related to the element in which they are defined.

In the case of the rpc and rpc-reply elements, the attribute xmlns defines the namespace in which this root element is defined. XML namespaces are like VLANs or VRFs: they define a logical space in which an element exists, more formally referred to in programming as the scope. The NETCONF standard mandates that the all NETCONF protocol elements be defined in the namespace urn:ietf:params:xml:ns:netconf:base:1.0. This is why you will find that the xmlns attribute is assigned this value in every single NETCONF message.

Sometimes the attribute is used for elements other than the root element. Take for example the native element in both Examples 3 and 4:

<native xmlns="http://cisco.com/ns/yang/Cisco-IOS-XE-native">

The xmlns attribute, also referring to a namespace, takes the value of the YANG model referenced by this element and all child elements under it, in this case the YANG model named Cisco-IOS-XE-native.

The other attribute is the message-id. This is an arbitrary string that is sent in the rpc message and mirrored back in the rpc-reply message unchanged, so that the client can match each rpc-reply message to its corresponding rpc message. You will notice that in both Examples 3 and 4 the message-id is equal to 101.

An XML declaration along with a root element (along with all the child elements under the root element) comprise an XML document. When an XML document follows the rules discussed so far (and a few more), it is referred to as a well-formed XML document. Rules here refer to the simple syntax and semantics governing XML documents, such as:

◉ For every start tag there has to be a matching end tag

◉ Tags start with a left bracket (<) and end with a right bracket (>)

◉ End tags must start with a left bracket followed by a slash then the tag name. Alternatively, empty elements may have a single tag ending in a slash and right bracket

◉ Do not include reserved characters (<,>,&,”) as element data without escaping them

◉ Make sure nesting is done properly: when a child element is nested under a parent element, make sure to close the child element using its end tag before closing the parent element

All NETCONF messages must be well-formed XML documents.

I wish I could say that we just scratched the surface of XML, but we didn’t even get this far. XML is so extensive and has a phenomenal number of applications that I would need several pages to just list the number of books and publications written on XML. For now, the few pointers mentioned here will suffice for a very basic understanding of NETCONF.

NETCONF


Cisco Prep, Cisco Tutorial and Material, Cisco Learning, Cisco Certification, Cisco Guides
Now that you have seen NETCONF in action and have an idea on what each component of the XML document means, let’s dig a little deeper into the rpc message.

The rpc message in Example 3 contains an rpc root element indicating the message type, followed by the get-config element, indicating the operation. NETCONF supports a number of operations that allow for the full lifecycle of device management, some of which are:

◉ Operations for retrieving state data and configuration: get, get-config

◉ Operations for changing configuration: edit-config, copy-config, delete-config

◉ Datastore operations: lock, unlock

◉ Session operations: close-session, terminate-session

◉ Candidate configuration operations: commit, discard-changes

The elements that will follow the operations element will depend on which operation you are calling. 
For example, you will almost always specify the source or destination datastore on which the operation is to take place.

Which brings us to a very important concept supported by NETCONF: datastores. NETCONF supports the idea of a device having multiple, separate, datastores, such as the running, startup and/or candidate configurations. Based on the capabilities announces by the device in the hello message, this device may or may not support a specific datastore. The only mandatory datastore to have on a device is the running-configuration datastore.

Capabilities not only advertise what datastores are supported by the device, but also whether some of these datastores (such as the startup configuration datastore) are directly writable, or the client needs to write to the candidate datastore, and then commit the changes so that the configuration changes are reflected to the running and/or the startup datastores. Engineers working on IOX-XR based routers will be familiar with this concept.

When working with a candidate datastore, the typical workflow will involve the client implementing the configuration changes on the candidate configuration first, and then either issuing a commit operation to copy the candidate configuration to the running-configuration, or a discard-changes operation to discard the changes.

And before working on a datastore, whether the candidate configuration or another, the client should use the lock operation before starting the changes and the unlock operation after the changes are completed (or discarded) since more than one session can have access to a datastore. Without locking the datastore for your changes, several sessions may apply changes simultaneously.

To actually change the configuration, the edit-config operation introduces changes to the configuration in a target datastore, using new configuration in the rpc message body, in addition to a (sub-)operation that specifies how to integrate this new configuration with the existing configuration in the datastore (merge, replace, create or delete). The copy-config operation is used to create or replace an entire configuration datastore. The delete-config operation is used to delete an entire datastore.

NETCONF also supports the segregation between configuration data and state data. The get operation will retrieve both types of data from the router, while the get-config operation will only retrieve the configuration on the device (in the datastore specified in the source element).

In order to limit the information retrieved from the device, whether state or configuration, NETCONF supports two types of filters: Subtree filters and XPath filters. The first type is the default and works exactly as you see in Example 3. You specify a filter element under the operation and include only the branches of the hierarchy in the referenced data model that you want to retrieve. XPath filters use XPath expressions for filtering. XPath filters are part of XML and existed before the advent of NETCONF.

NETCONF and Python

Up till this point we have been sending and receiving NETCONF messages “manually”, which is a necessary evil to observe and study the intricacies of the protocol. However, in a real-life scenario, copying and pasting a hello or rpc message into the terminal, and reading through the data in the rpc-reply message kinda defies the purpose. We are, after all, discussing network programmability for the ultimate purpose of automation ! And an API is a software-to-software interface and not really designed for human consumption. Right ?

So let’s discuss a very popular Python library that emulates a NETCONF client: ncclient. The ncclient library provides a good deal of abstraction by masking a lot of the details of NETCONF, so you, the programmer, would not have to deal directly with most of the protocol specifics. Ncclient supports all the functions of NETCONF covered in the older RFC 4741.

Assuming you are on a Linux machine, before installing the ncclient library, make sure to install the following list of dependencies (using yum if you are on a CentOS or RHEL box):

◉ setuptools 0.6+
◉ Paramiko 1.7+
◉ lxml 3.3.0+
◉ libxml2
◉ libxslt
◉ libxml2-dev
◉ libxslt1-dev

Then Download the Python Script setup.py from the GitHub repo https://github.com/ncclient/ncclient and run it:

[kabuelenain@localhost ~]$ sudo python setup.py install

Or just use pip:

[kabuelenain@localhost ~]$ sudo pip install ncclient

The ncclient library operates by defining a handler object called manager which represents the NETCONF server. The manager object has different methods defined to it, each performing a different protocol operation. Example 5 shows how to retrieve the configuration of interface GigabitEthernet1 using ncclient.

from ncclient import manager
     filter_loopback_Gig1='''
        <native xmlns="http://cisco.com/ns/yang/Cisco-IOS-XE-native">
            <interface>
                <GigabitEthernet>
                    <name>1</name>
                </GigabitEthernet>
            </interface>
        </native>
       '''
with manager.connect(host='ios-xe-mgmt-latest.cisco.com',
                     port=10000,
                     username='developer',
                     password='C1sco12345',
                     hostkey_verify=False
                     ) as m:
     rpc_reply = m.get_config(source="running",filter=("subtree",filter_loopback_Gig1))
     print(rpc_reply) print(rpc_reply)

Example 5 – An rpc message containing a <get-config> operation using ncclient to retrieve the running configuration of interface GigabitEthernet1

In the Python script in the example, the manager module is first imported from ncclient. A subtree filter is defined as a multiline string named filter_loopback_Gig1 to extract the configuration of interface GigabitEthernet1 from the router.

A connection to the router is then initiated using the manager.connect method. The parameters passed to the method in this particular example use values specific to the Cisco IOS-XE sandbox. The parameters are the host address (which may also be an ip address), the port configured for NETCONF access, the username and password and finally the hostkey_verify, which when set to False, the server SSH keys on the client are not verified.

Then the get_config method, using the defined subtree filter, and parameter source equal to running, retrieves the required configuration from the running configuration datastore.

Finally the rpc-reply message received from the router is assigned to string rpc_reply and printed out. The output resulting from running this Python program is identical to the output seen previously in Example 4.

The manager.connect and get_config methods have a few more parameters that may be used for more granular control of the functionality. Only the basic parameters are covered here.

Similarly, the edit_config method can be used to edit the configuration on the routers. In this next example, the edit_config method is used to change the ip address on interface GigabitEthernet1 to 10.0.0.1/24.

from ncclient import manager
     config_data='''
       <config>
         <native xmlns="http://cisco.com/ns/yang/Cisco-IOS-XE-native">
           <interface>
             <GigabitEthernet>
               <name>1</name>
               <ip>
                 <address>
                   <primary>
                     <address>10.0.0.1</address>
                     <mask>255.255.255.0</mask>
                   </primary>
                 </address>
               </ip>
             </GigabitEthernet >
           </interface>
         </native>
       </config>
       '''
with manager.connect(host='ios-xe-mgmt-latest.cisco.com',
                     port=10000,
                     username='developer',
                     password='C1sco12345',
                     hostkey_verify=False
                     ) as m:
     rpc_reply = m.edit_config(target="running",config=config_data)
     print(rpc_reply)

Example 6 – An rpc message containing an <edit-config> operation using ncclient to change the IP address on interface GigabitEthernet1

The difference between the get_config and edit_config methods is that the latter requires a config parameter instead of a filter, represented by the config_data string, and requires a target datastore instead of a source.

Example 7 shows the output after running the script in the previous example, which is basically an rpc-reply message with an ok element. The show run interface GigabitEthernet1 command output from the router shows the new interface configuration.

### Output from the NETCONF Session ###
<?xml version="1.0" encoding="UTF-8"?>
<rpc-reply xmlns="urn:ietf:params:xml:ns:netconf:base:1.0" message-id="urn:uuid:7da14672-68c4-4d7e-9378-ad8c3957f6c1" xmlns:nc="urn:ietf:params:xml:ns:netconf:base:1.0">
    <ok />
</rpc-reply>

### Output from the router via the CLI showing the new interface configuration ###
csr1000v-1#show run interface Gig1
Building configuration...

Current configuration : 99 bytes
!
interface GigabitEthernet1
 description Testing the ncclient library
 ip address 10.0.0.1 255.255.255.0
end

Example 7 – The rpc-reply message after running the program in Example 6 and the new interface configuration

NETCONF is much more involved than what has been briefly described in this post. I urge you to check out RFCs 6241, 6242, 6243 and 6244 and my book “Network Programmability and Automation Fundamentals” from Cisco Press for a more extensive discussion of the protocol.

Sunday 27 September 2020

Introduction to Programmability – Part 1

Are you a network engineer and have had to repeat the same boring task at work, every day? Do you feel that there must be a way for you to do a task once, and then “automate” it? Theoretically, an infinite number of times? Or, have you been spending more time cleaning up and correcting configuration mistakes than you spend implementing those configurations? Or maybe you have been hearing a lot about this hot new “thing” called network programmability, but in the middle of the hype, could not figure out what exactly it is?

If any of those cases (and many others) apply to you, then you are in the right place. The fact that you are here, reading this now, means you know that there is probably a solution to your problem(s) in the realm of automation and/or programmability. In this case, buckle up because you are in for a ride!

If you are a network engineer and browsed to this page by mistake, I still urge you to read on. Netflix, Youtube, Facebook and Twitter will still be there when you are done. (Or not.) This is more fun. Trust me!

A Few Definitions For The Road

Before we dive into the nuances of network programmability and automation, let’s clear up some confusion. I hate nothing in the world more than definitions – well, maybe greasy pizza – but this is a necessary evil! In order to start clean, you must understand each of the following: network management, automation, orchestration, modeling, programmability and APIs.

Network Management is an umbrella term that covers the processes, tools, technologies, and job roles, among other things, required to manage a network and the lifecycle of the services offered by that network.

Many standards and frameworks exist today to define the different components of network management. One of them is FCAPS, where the acronym stands for Fault, Configuration, Accounting, Performance and Security Management. FCAPS is geared towards managing the systems that constitute the network.

Another is ITIL. The acronym stands for Information Technology Infrastructure Library and covers an extensive number of practices for IT Services Management (ITSM), which is basically the lifecycle of the services provided by the network. ITIL is divided into 5 major practices: Service Strategy, Service Design, Service Transition, Service Operation, and Continual Service Improvement. Each practice is divided into smaller sub-practices. For example, Service Design includes Capacity Management, Availability Management and Service Catalogue Management while Service Operation includes Incident Management, Problem Management and Request Fulfilment. Some people make a career being ITIL practitioners.

The Merriam-Webster dictionary defines Automation as “the technique of making an apparatus, a process, or a system operate automatically”. In other words, having a system of some sort do the work for you, work that you would otherwise do manually. However, you will have to tell this system what is it that you want to get done, and sometimes, how to do it.

So, configuring a network of routers with dynamic routing protocols, so that these routers speak with each other and figure out the shortest path per destination, is a form of automation. The alternative would be having someone do the calculations manually on a piece of paper, and then configuring static routes on each router. And so is writing a program that configures a VLAN on your switch – or your 500 switches – without someone having to log in to each switch individually and configuring the VLAN via the CLI.

As you have already guessed, the power of automation is not intrinsically in the automation itself. Logging into one switch manually and configuring one VLAN is probably much faster than writing a Python program to do that for you. So why automate? Obviously, the importance of automation is its application to repetitive tasks.

Automation will not only save the time you will spend repeating a task, it also maintains consistency and accuracy of performing that task, over all its iterations. It does not matter if you have 10 or 500 switches. The program you wrote will always go through the exact same steps for eachevery switch, with the exact same result. Every time. Of course, the assumption here is that no errors will happen because of factors external to your program, such as an unreachable switch, wrong credentials configured on a switch, or a switch with a corrupted IOS. Although, you can write a program to detect and mitigate these error conditions!

When you have several systems working together to get a job done, there is typically a need for a system, or a function, to coordinate the execution of the tasks performed by the different systems towards getting this job completed. This coordination function is called Orchestration.

For example, a private or public cloud that provides virtual machines to its users will include different systems to provision the network, compute, virtualization, operating systems, and maybe the applications, for those VMs. Orchestration will provide the function of coordination between all the different systems and applications to get the VM up and running.

Automation and orchestration work well in tandem. Automation covers single tasks. Using software to configure a VLAN on a switch is automation, and so is provisioning a VM over ESXi, or installing Linux on that VM. Orchestration, on the other hand, is the function of coordinating the execution of these automated tasks, in a specific sequence, each task using its own software and each on its respective system. The scope of automation involves single tasks. The scope of orchestration involves a workflow of tasks.

The concept of Modeling Data is not a new concept and is not exclusive to networks or even automation. Data modeling is very involved and is a major branch of data science. For the humble purpose of this blog, let’s use an example to demonstrate what a model is. In Example 1, you can see a configuration snippet of BGP on an IOS-XR router in the left column. In the right column, the specific values for this particular device were removed and replaced with a description of what should be there. A template of sorts.

Cisco Prep, Cisco Learning, Cisco Guides, Cisco Exam Prep, Cisco Learning, Cisco Tutorial and Material
Example 1 – BGP configuration snippet on IOS-XR and the corresponding data model in tree notation

As you can see, a model is a little more than just a template.

A model describes data types. An IP address is composed of four octets separated by the “.” character and each octet has a value between 0 and 255. An ASN is an integer between 1 and 65535. These two objects, an IP address and ASN, are leaf objects, each having a specific type and each instance of that leaf has a value.

As you have already guessed, a model also describes the data hierarchy. Address families are child objects to the main BGP process. Then the networks injected for a particular address family are children objects to that address family. And the same applies to neighbors: there are global neighbors that are children to the BGP process, and then there are neighbors defined under the different VRFs. You get the point.

So, in order to reflect hierarchy, other object types may exist in a model besides a leaf, such as leaf lists, lists and containers. A leaf-list is a list of leafs. For example, a snmp server configured on router is a leaf object. A list of snmp servers make up a leaf list. All leafs under a leaf list are of the same type.

A list is a group of other objects and has many instances. For example, the VRF in Example 1 is a list. It has children objects of different types (some of which are themselves lists), and at the same time you may have more than one VRF configured under the BGP process. A container is a group of objects of different types, but a container will only have a single instance. An example of a container is the BGP process itself. This is an over simplification of what a data model is just to elaborate on the concept.

Data models used in the arena of network programmability are described using a language called YANG. A “YANG model” is nothing more than a data model described using YANG.

Defining Programmability is not as easy as the previous terms. The reason for this is that the term is used across a very wide spectrum, and means different things depending on what context it is used in. Programming a device or a system basically means giving it instructions to do what you want it to do. A programmable device is a device that can execute different tasks based on the instructions it is given. In the world of electronics, an ASIC (Application Specific Integrated Circuit) is a chip that does one specific function. If this ASIC is built to accept two numbers as input and add those two numbers, it will always do that. A Microprocessor, on the other hand, accepts instructions describing what you want it to do with the input it is given. You can program it to add two numbers, multiply them, or subtract one from the other. A microprocessor is a programmable device while an ASIC is not.

But doesn’t this equate programming to configuration? Configuring a network device is basically telling that device what to do … right? Well, that is tricky question, and it is here that we discuss programmability as used today in the context of network automation.

Programmability for the purpose of network automation is basically the capability to retrieve data, whether configuration or operational data, from a system, or push configuration to a system, using an Application Programming Interface, or API for short. An API is an interface to a system that is designed for software interaction with this system. Contrast this to a router CLI. A CLI requires human interaction to be useful. An API on that same router would be designed so that a Python program, for example, can interact with the router without any human intervention.

But what really is an API?

An API is software running on a system. This software provides a particular function to other software, while not exposing this other software to how this function is performed. An API will typically have a predefined way to reach it, for example, over a specific TCP port. The API will also define the format of the data that it accepts, as well as the data it sends back. It may also define different message types and specific syntax and semantics to avail the services provided by the API. A device that implements an API is said to expose an API to be consumed by other software.
Now to connect the dots. Orchestration coordinates a number of automated tasks in a workflow to implement one of the disciplines of network management. Automation may leverage an API exposed by a device in order to manage this device programmatically. When a data model is used as a reference during programmatic access, the device is said to leverage model-driven programmability.

Quite a mouthful!

Network Programmability: The Details


Network Programmability as a practice is best summarized by the Programmability Stack in Figure 1 below. The stack defines six layers:

1. Application
2. Model
3. Protocol
4. Encoding
5. Transport
6. Infrastructure

Cisco Prep, Cisco Learning, Cisco Guides, Cisco Exam Prep, Cisco Learning, Cisco Tutorial and Material
Figure 1 – The Network Programmability Stack

(Disclaimer: The Programmability Stack has not been standardized by any industry-recognized entity such as the OSI 7-Layer Model. Therefore, you will probably run into a number of variations of this stack as you progress in your studies of programmability. I found that the one I have drawn here is the best version for the sake of getting the point across. Feel free to contrast it to other version you find elsewhere and tell me what you think in the comments below.)

At the top of the stack is an application that may be a simple python script or a sophisticated network management system such as Cisco Prime. At the bottom of the stack is the device exposing an API. In order for the application to programmatically speak with the device’s API, it will leverage a choice of components at the different layers of the stack.

The application will choose a model. Different types of models exist, the majority today described in YANG. A model may be vendor-specific or standards-based. In either case, the model will define the structure of the data that the application sends to or receives from the device (through the API).

The application will have to choose a protocol that defines the message types as well as the syntax and semantics used in those messages. There are three primary protocols used today for network programmability: NETCONF, RESTCONF and gRPC.

NETCONF, for example, defines three message types: hello, rpc and rpc-reply. It also defines specific operations that may be used in the rpc message to perform tasks such retrieving operational data from a device or pushing configuration to a device. The messages will use specific, well-defined syntax.

The protocols themselves are sometimes described as the APIs. Don’t get confused just yet ! When a device exposes a NETCONF API, then the application will have no choice but to use the NETCONF protocol to speak with the device. The same applies to the other protocols.

A protocol will have a choice of a data format, typically referred to as the data encoding. The most common data encodings in use today are XML, JSON, YAML and GPB. For example, NETCONF will send and receive data only in the form of XML documents. RESTCONF supports both, XML and JSON.

Then this data will be transported back and forth between the application and the device that is exposing the API using a transport protocol. For example, NETCONF uses SSH while RESTCONF uses HTTP.

This is network programmability in a nutshell!

Saturday 26 September 2020

Automated response with Cisco Stealthwatch

Cisco Stealthwatch provides enterprise-wide visibility by collecting telemetry from all corners of your environment and applying best in class security analytics by leveraging multiple engines including behavioral modeling and machine learning to pinpoint anomalies and detect threats in real-time. Once threats are detected, events and alarms are generated and displayed within the user interface. The system also provides the ability to automatically respond to, or share alarms by using the Response Manager. In release 7.3 of the solution, the Response Management module has been modernized and is now available from the web-based user interface to facilitate data-sharing with third party event gathering and ticketing systems. Additional enhancements include a range of customizable action and rule configurations that offer numerous new ways to share and respond to alarms to improve operational efficiencies by accelerating incident investigation efforts. In this post, I’ll provide an overview of new enhancements to this capability.

Benefits: 

◉ The new modernized Response Management module facilitates data-sharing with third party event gathering and ticketing systems through a range of action options.

◉ Save time and reduce noise by specifying which alarms are shared with SecureX threat response.

◉ Automate responses with pre-built workflows through SecureX orchestration capabilities.

Cisco Prep, Cisco Learning, Cisco Tutorial and Material, Cisco Certification
The Response Management module allows you to configure how Stealthwatch responds to alarms. The Response Manager uses two main functions:

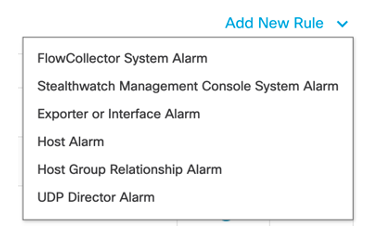
◉ Rules: A set of one or multiple nested condition types that define when one or multiple response actions should be triggered.

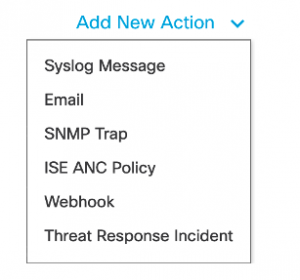
◉ Actions: Response actions that are associated with specific rules and are used to perform specific types of actions when triggered.

Cisco Prep, Cisco Learning, Cisco Tutorial and Material, Cisco Certification
Response Management module Rule types consist of the six alarms depicted above.

Alarms generally fall into two categories:


Threat response-related alarms:

◉ Host: Alarms associated with core and custom detections for hosts or host groups such as C&C alarms, data hoarding alarms, port scan alarms, data exfiltration alarms, etc.

◉ Host Group Relationship: Alarms associated with relationship policies or network map-related policies such as, high traffic, SYN flood, round rip time, and more.

Stealthwatch appliance management-related alarms:

◉ Flow Collector System: Alarms associated with the Flow Collector component of the solution such as database alarms, raid alarms, management channel alarms, etc.

◉ Stealthwatch Management Console (SMC) System: Alarms associated with the SMC component of the solution such as Raid alarms, Cisco Identity Services Engine (ISE) connection and license status alarms.

◉ Exporter or Interface: Alarms associated with exporters and their interfaces such as interface utilization alarms, Flow Sensor alarms, flow data exporter alarms, and longest duration alarms.

◉ UDP Director: Alarms associated with the UDP Collector component of the solution such as Raid alarms, management channel alarms, high availability Alarms, etc.

Cisco Prep, Cisco Learning, Cisco Tutorial and Material, Cisco Certification
Choose from the above Response Management module Action options.
 
Available types of response actions consist of the following:

◉ Syslog Message: Allows you to configure your own customized formats based off of alarm variables such as alarm type, source, destination, category, and more for Syslog messages to be sent to third party solutions such as SIEMs and management systems.

◉ Email: Sends email messages with configurable formats including alarm variables such as alarm type, source, destination, category, and more.

◉ SNMP Trap: Sends SNMP Traps messages with configurable formats including alarm variables such as alarm type, source, destination, category, etc.
ISE ANC Policy: Triggers Adaptive Network Control (ANC) policy changes to modify or limit an endpoint’s level of access to the network when Stealthwatch is integrated with ISE.

◉ Webhook: Uses webhooks exposed by other solutions which could vary from an API call to a web triggered script to enhance data sharing with third-party tools.

◉ Threat Response Incident: Sends Stealthwatch alarms to SecureX threat response with the ability to specify incident confidence levels and host information.

The combination of rules and actions gives numerous possibilities on how to share or respond to alarms generated from Cisco Stealthwatch. Below is an example of a usage combination that triggers a response for employees connected locally or remotely in case their devices triggers a remote access breach alarm or a botnet infected host alarm. The response actions include isolating the device via ISE, sharing the incident to SecureX threat response and opening up a ticket with webhooks.

Cisco Prep, Cisco Learning, Cisco Tutorial and Material, Cisco Certification
1) Set up rules to trigger when an alarm fires, and 2) Configure specific actions or responses that will take place once the above rule is triggered.

The ongoing growth of critical security and network operations continues to increase the need to reduce complexity and automate response capabilities. Cisco Stealthwatch release 7.3.0’s modernized Response Management module helps to cut down on noise by eliminating repetitive tasks, accelerate incident investigations, and streamline remediation operations through its industry leading high fidelity and easy to configure automated response rules and actions.

Friday 25 September 2020

New Technology for Cable Operators to Consider

Cisco Prep, Cisco Tutorial and Material, Cisco Learning, Cisco Exam Prep, Cisco Guides

In the last several years, the role of compute resources has increased the demands upon modern cable regional and access networks. Computation has quickly become part of network infrastructure itself, beyond just supporting services, over-the-top applications, and management tasks. At the same time, advancements in silicon and optical technology allow for a re-examination of cable network topology and service placement. This blog examines some key decision points the cable industry needs to consider as we work together to build the next generation of a Modern Cable Network.

The Growing Role of Compute

Computing has always played an important role in Internet systems. Network services such as DNS and SMTP, as well as applications such as web services, video cache, and the control planes of routers themselves, all depend on general-purpose compute systems being distributed in the network. Some of these compute resources are discrete servers, some are in large cloud computing environments, and still others are co-resident in routing devices. But they all share the same fundamental trait – they keep and maintain application and/or network state, they run generally available operating systems, and today, all use common x86-based CPU’s.

Cisco Prep, Cisco Tutorial and Material, Cisco Learning, Cisco Exam Prep, Cisco Guides

As computational power has grown, the ability for compute resource to perform stateful transformation of data has highly useful applications. In other words, the ability for a resource to take input from an app or the network, transform that input in some way, and return it in a more useful state. Examples of this could be real-time face recognition, such as identifying individuals in video streams. Raw video is fed into a resource, software analyzes the raw video, and returns a structured set of data. Or real-time speech to text, such as that present on modern smartphones. Raw audio is fed into an application, software deciphers the language present, and returns ordered text to be fed into additional applications.

The key is that as computation is used for more real-time, stateful transformation of data, the ability to access those resources quickly and reliably becomes paramount. And this directly translates into the latency, or the amount of time on a wire, between the end-user and that, compute resource. Ultimately, we’re talking about the speed of light.

Cisco Prep, Cisco Tutorial and Material, Cisco Learning, Cisco Exam Prep, Cisco Guides

Low latent access to real-time computation is among the most lucrative, and untapped, resources present on cable networks. Network technology is advancing to make the placement of computation in cable networks much more advantageous to this new opportunity.

Advent of New Network Technology


While demand for low latent computing starts to grow, the cable industry faces some decision points to make. New network technology is permitting a massive disaggregation, and re-architecture, of cable access and metro networks.

Distributed Access Architecture (DAA) systems, such as Remote PHY, enable the pervasive use of IP and Ethernet transport in the access layer, where the previous legacy HFC analog transmission was used.

Virtualized CCAP, such as Cisco’s Cloud Native Broadband Router (cnBR), leverages Remote PHY technology to build a scale-out, software-oriented, microservices-based analogy to a contemporary CMTS. A key point of the cloud native software architecture of the cnBR is the use of the network to place all, or parts, of the system’s functionality to anywhere the network topology extends.

Next-generation silicon, optics, software. New routing platforms, such as the Cisco 8000 series, leverage next-generation forwarding ASIC technology to deliver unprecedented capacity and systems simplicity, all in a power and space-efficient package. Coupled with emerging Digital Coherent Optic (DCO) technology such as 400G-ZR and ZR+ pluggables, it is possible to build a cable metro topology that is much more interconnected, with traffic patterns that follow the value of a dollar and not strictly the path of a wavelength. What this means is, compute can be placed in arbitrary locations, to where packet latency to it is optimal for the application.

Cisco Prep, Cisco Tutorial and Material, Cisco Learning, Cisco Exam Prep, Cisco Guides

A key compute resource that needs consideration for placement is the cnNR or Virtualized CCAP itself. A centralized vCCAP gains efficiency in software economies of scale. But a distributed vCCAP permits the opportunity to offload routable traffic closer to subscribers, which means closer to an edge compute or low latent access to compute architecture. Careful thought needs to be applied when designing the cnBR or vCCAP as a portion of overall network design and goals.

DOCSIS 4.0 also plays a role in a Modern Cable Network.  To learn the latest with this standard, attend our webinar:  DOCSIS 4.0 Evolution in the Cable Plant, Are You Ready.  If you would like to chat more about architecting and designing the next generation of a Modern Cable Network, stop by our virtual exhibit at SCTE-IBSE Cable Tec Virtual Expo.

Thursday 24 September 2020

Detecting and Mitigating Loops in VXLAN Networks

The Problem with Looping

First-generation Layer-2 Ethernet networks could not natively detect or mitigate looped topologies, while modern Layer-2 Overlays implicitly build loop-free topologies. Overlays do not have any need for loop detection and mitigation as long as no first-gen Layer-2 network is attached, which is common in complex data center networks. When loops occur, data frames can exist indefinitely, disrupting network stability and degrading performance. Loops introduce broadcast radiation, increasing utilization of CPU and network bandwidth, which results in a degradation of user application access experience. In multi-site networks a loop can span multiple data centers, causing disruptions that are difficult to pinpoint. In other words, loops are bad news. Before we look at how a modern network fabric minimizes looping, let’s examine previous attempts at preventing loops in topologies.

Spanning Tree Protocols (STP) counteract the loop problem in first-gen Layer-2 Ethernet network. Over time, other approaches evolved by moving networks from “looped topologies” to “loop-free topologies”. This evolution reduced the dependence on Loop Prevention protocols, so they are now employed mostly as a failsafe mechanism. Today with Network Virtualization Overlays, the dependency on Loop Prevention protocols is almost entirely eliminated. However, even though virtualized overlay networks such as VXLAN EVPN are loop free, having a failsafe loop detection and mitigation method is still desirable because loops can be introduced by topologies connected to the overlay network.

Cisco Prep, Cisco Tutorial and Material, Cisco Learning, Cisco Networks, Cisco Guides

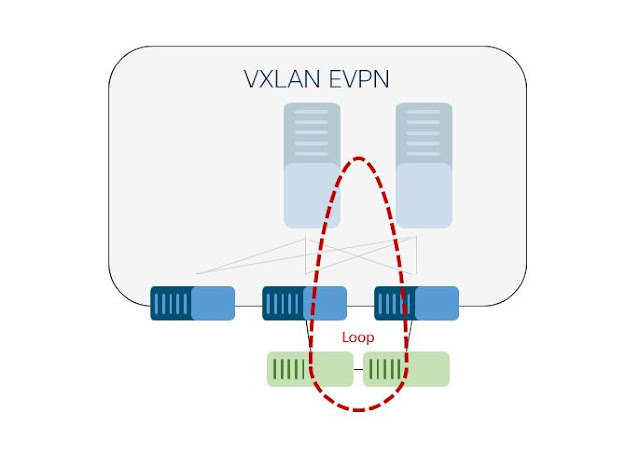
Loop-free VXLAN overlays may be connected to an Ethernet segment that can result in network loops, requiring detection and mitigation in conjunction with the overlay.

Many Solutions to Loop Prevention, But Which is the Best?


The Spanning Tree Protocol enables network designs that include redundant links to provide fault tolerance but avoid the presence of bridging loops. STP builds a single tree that calculates the relationship of network nodes and bridges within a layer 2 network to avoid creating loops.

An alternate approach to prevent loops in layer 2 networks uses link bundles between two neighboring bridges. This technique improves performance (Link Aggregation – LAG) and provides link redundancy (member link failure in a LAG). When multiple bridges exist, link bundles are extended to provide peering between multiple bridges (Multi-Chassis Link Aggregation – MLAG), increasing bridge node resiliency along with link redundancy and performance. In both of these cases, the link bundles are treated by STP as a single logical link and the creation of a loop is prevented (loop free). In each of these cases, STP acts as a failsafe.

While LAG and MLAG were in use for many years, other approaches for building loop free topologies arose by using ECMP (Equal Cost Multi-Path), either at the MAC layer or IP layer. FabricPath or TRILL (Transparent Interconnect of Lots of Links) are MAC layer ECMP approaches that emerged in the last decade. More recently, Network Virtualization Overlays that build loop free topologies on top of IP layer ECMP became the state-of-the-art. VXLAN is the most prevalent network virtualization protocol in use today that builds loop free topologies.

Cisco Prep, Cisco Tutorial and Material, Cisco Learning, Cisco Networks, Cisco Guides

A loop-free VXLAN overlay network.

While a VXLAN Overlay provides a loop free layer 2 service over IP ECMP, a layer 2 loop may still be introduced by connecting an L2 Ethernet network. VXLAN Edge-Devices act as bridges between VXLAN and Ethernet, known as Layer 2 Gateways (L2GW). A loop on the Ethernet network side can still introduce harmful broadcast radiation to the loop-free overlay network. If a loop is accidentally configured, physically or logically, the absence of a Loop Prevention protocol in VXLAN could allow the existence of a loop. While the layer 2 service in the VXLAN overlay network does not participate in the Spanning Tree Protocol, even if it could, blocking of a link in a loop-free overlay network would not prevent a loop but might cause additional harm, such as loss of service.

While proposals exist to integrate the overlay network with STP, these proposals are considering all Edge-Devices representing a single STP root bridge – Layer 2 Gateway STP (L2G-STP). While this approach is valid, it introduces rigidity into the deployment of modern overlay networks, reducing flexibility. With L2G-STP or similar approaches, the location of the STP root is predefined and hence can’t adjust to network designs that require a different location for this function. While L2G-STP can be used as a separate feature, the same functionality can be configured with a common STP root priority on the Edge-Device and the use of STP Root Guard.

In order to maintain the flexibility of overlay network deployments with VXLAN but have the ability to detect and protect against potential loops, Cisco provides an innovation: VXLAN EVPN Southbound Loop Detection and Mitigation.

Southbound Loop Detection and Mitigation


Let’s look at a VXLAN network in a spine/leaf topology to define “southbound looping”. The leaf is acting as Network Virtualization Edge-Device that is hosting the VXLAN Tunnel Endpoint (VTEP) function. In this topology, the VXLAN network represents the “northbound” portion of the network. The network from the leaf or Edge-Device to the “south” is most commonly the Ethernet network. As loops are potentially formed in this “southbound” network, the goal is to detect and mitigate loops that are introduced by the “southbound” network.

Cisco Prep, Cisco Tutorial and Material, Cisco Learning, Cisco Networks, Cisco Guides

North and south network topology.

Operations, Administration, and Maintenance (OAM) provides a framework for Connectivity Fault Management (CFM) defined in IEEE 802.1ag. Within this protocol framework and specifications, a continuous check message traverses intermediate bridges. This is a key criteria for enabling uninterrupted transfer of signaling across north-south borders. Based on well-defined triggers that span from initial port up to duplicate MAC detection (RFC7432 Section 15.1), check message probes are sent in a focused manner to detect if and where loops exist.

Loop detection is provided exclusively by the Edge-Devices that form the “northbound” VXLAN and bridge to the “southbound” Ethernet network. If the probe is not returned to the sending Edge-Devices, then no southbound Loop exists. If a southbound probe is returned, the existence of a loop is validated. As Edge-Devices become aware of a detected loop, notifications are shared with network operators and mitigation actions initiated.  

Cisco Prep, Cisco Tutorial and Material, Cisco Learning, Cisco Networks, Cisco Guides

A probe uncovers a loop in a southbound Ethernet network.

Loop Mitigation and Recovery


As part of the mitigation, the “southbound” Ethernet interfaces that participate in a loop are identified. As loops can exist in some VLANs but not in others, the granularity of control on a Port, VLAN basis is significant. In the action of mitigation, only the specific offending combination of VLAN and port is suppressed to break the detected loop and stop traffic radiation without disrupting other traffic on the port. Breaking the loop updates the topology which can affect the accuracy of the MAC address table. Therefore, a MAC-flush is initiated in the VLAN with the detected loop to enable proper re-learning and forwarding subsequent to the loop mitigation.

Once a loop has been mitigated, it can be difficult to know if the recovery—the unsuspending of a Port,VLAN combination—will reintroduce the loop. In order to prevent a false-recovery and loop reintroduction, a probe is sent prior to initiating the recovery while the Port,VLAN combination stays suspended (doesn’t forward traffic). If the probe still reports an indication of an existing southbound loop, the recovery process is stopped and the Port,VLAN stays suspended. After a given interval, loop detection is reinitiated. The recovery process continues until no loop is detected. Appropriate configuration, notification, and override commands are available to the Network Operator.

VXLAN EVPN with Built-In Southbound Loop Detection and Mitigation


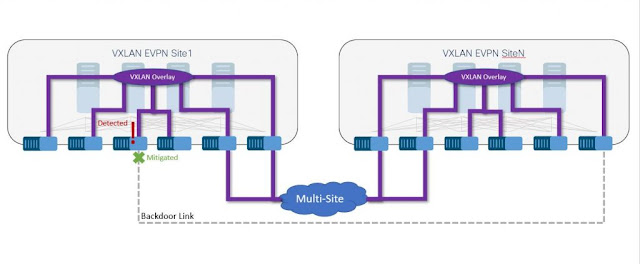
Cisco NX-OS 9.3(5) provides native southbound loop detection and mitigation for VXLAN EVPN fabrics. The functionality extends the loop-free behavior of VXLAN EVPN’s Network Virtualization Overlay with existing Ethernet networks. While there are many use-cases that require loop detection and mitigation in a single fabric, the same functionality is available for VXLAN EVPN Multi-Site deployments. For these Multi-Site deployments, loop detection and mitigation supports the detection of backdoor links, the most prevalent cause of multi-site outages during extension or migrations.  

While many loop protection solutions support detecting the existence of loops in the overall topology and shutting down the offending ports, VXLAN EVPN Loop Detection and Mitigation defines the topology at the “VLAN-level”. Similar to Per-VLAN Spanning Tree variations (PVST+ and PVRST/802.1w) the functionality of VXLAN EVPN Loop Detection and Mitigation acts with comparable granularity. Differing from Spanning Tree, no pro-active calculation of a forwarding tree is built, but precautions are made to avoid the existence of loops and introducing them into the Overlay. VXLAN EVPN southbound loop detection and mitigation aims to ensure network uptime and avoid unnecessary risks due to loop creation, whether it is within a single fabric or across multiple fabrics with VXLAN EVPN Multi-Site.

Cisco Prep, Cisco Tutorial and Material, Cisco Learning, Cisco Networks, Cisco Guides

Looping can be accidentally introduced into multi-site fabrics through backdoor links.

Innovative Solutions for Increasing Data Center Resiliency


Increasing the stability of data center fabrics is key to supporting business resiliency — whether for a single on-premise brownfield fabric or when adding new multi-site greenfield fabrics. In order to optimize application performance and network stability, modern networks need to build upon a consistent, up-to-date platform instead of relying on a patchwork of technologies that can cause more conflicts than resolutions.

Even though modern VXLAN EVPN overlays prevent most looping scenarios natively, combining them with older network topologies can still introduce the risk of corrosive loops. Even carefully designed multi-site VXLAN EVPN data center fabrics can still accidentally create backdoor links, leading to looping-related performance issues. Cisco Nexus 9000 Series based NX-OS VXLAN implementation addresses the most prevalent loop scenarios within and among multi-site data centers to build and maintain a stable and resilient network architecture for your organization.

Wednesday 23 September 2020

Why SOAR Is the Future of Your IT Security

Cisco Prep, Cisco Tutorial and Material, Cisco Learning, Cisco Guides

The threat landscape evolves constantly, with new and increasingly sophisticated cyberattacks launching with growing frequency across network, cloud, and software-as-a-service environments.

As threats continue to stack up against organizations, IT teams face the challenge of managing heterogeneous end-user device environments composed of various network-connected devices, operating systems, and applications. They must ensure that consistent, organizationally-sanctioned controls are applied across these environments.

While this is achievable with the right security expertise, there is also a global cybersecurity skills shortage. In fact, 3.5 million cybersecurity positions are expected to remain unfulfilled by 2021.

These challenges are not insurmountable. They can be conquered with the security operations and incident response approach called SOAR.

What is SOAR?

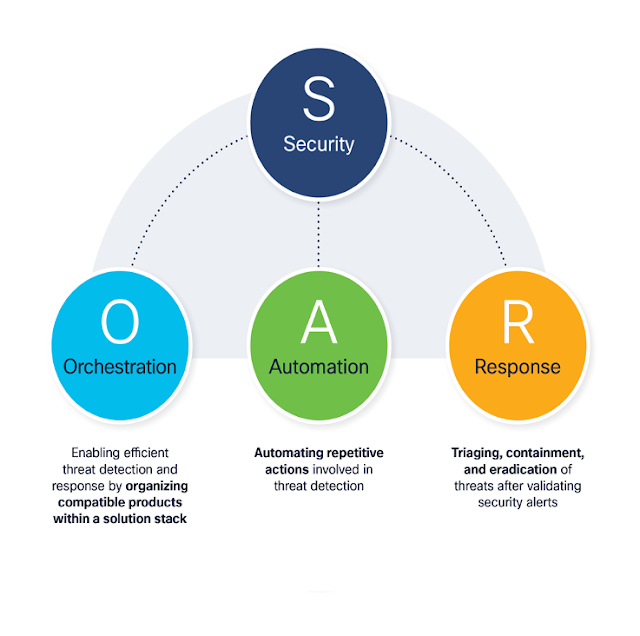
SOAR refers to a solution stack of compatible software that allows organizations to orchestrate and automate different parts of security management and operations to improve the accuracy, consistency, and efficiency of security processes and workflows with automated responses to threats.

How does SOAR work?

Security orchestration

The first component of SOAR, security orchestration, involves leveraging the different, compatible products for use within a solution stack to orchestrate the management and operations activities through standardized workflows. These security solutions automatically aggregate data from multiple sources, add context to that data to identify potential weaknesses, and use risk modeling scenarios to enable automated threat detection.  Recognizing this, more and more organizations are prioritizing the need for effective integration between security technologies to enable rapid threat detection and response.

Security automation

The second component is security automation, which involves automating many of the repetitive actions involved in the threat detection process.

Traditionally, security analysts within an organization would handle threat alerts manually, usually multi-tasking to size up alerts from numerous point solutions. This increases the likelihood of human error, inconsistent threat response, and high severity threats being overlooked.

SOAR, on the other hand, automates gathering enrichment and intelligence data on an event, can perform common investigative steps on behalf of the analyst to help triage events, and consistently delivers on the orchestration and response of the incident response lifecycle.

Security response

The third component, security response, involves triage, containment, and eradication of threats.

Response methods depend on the type and scope of the threat. Some threat responses can be automated for faster results, such as quarantining files, blocking file hashes across the organization, isolating a host or disabling access to compromised accounts.

However, sophisticated cyber-attacks require sophisticated responses. This is where security playbooks come in.

With Cisco Managed Detection and Response (MDR), automation is supported by defined investigation and response playbooks, containing overviews of known threat scenarios and best practices for responding to different types of threats. The role of automation is to rapidly execute these playbooks.

Cisco Prep, Cisco Tutorial and Material, Cisco Learning, Cisco Guides

What does a threat detection and response process look like with SOAR?

Let’s start with an example based on AMP for Endpoints identifying a file as potentially malicious. SOAR would be able to begin the investigation process, start answering questions, and performing tasks automatically such as:

◉ Was the file quarantined?
◉ Was the file executed?
◉ Where else has this file been seen in the network?
◉ Detonate the file in a Cisco Threat Grid sandboxing environment
◉ Investigate using available context related to connection, file, and source at relevant technologies, such as Umbrella and Stealthwatch Cloud
◉ Retrieve any available threat intelligence information on the file and check for occurrences of known indicators of compromise (IOCs)
◉ Collect identification information on the host and username

The answers to these questions provide contextual information to the investigator to aid in determining the legitimacy, impact, urgency, and scope of the incident. This information in turn determines appropriate response actions, which may include:

◉ Quarantining the host on the network
◉ Blocking the file hash across the network
◉ Blocking IOCs
◉ Scanning and cleaning any devices with occurrences of IOCs

Betting on SOAR

The cybersecurity skills shortage, tight IT budgets, the dynamic nature of the threat landscape, and the need to optimize security operations make SOAR a compelling proposition.

With Cisco MDR, security alerts, correlation, and enrichment are automated; blocked items are propagated for instant containment; and indicators of compromise are reported near-instantly for blocking, hunting, and follow-up.

The result is streamlined security operations and a stronger security posture without breaking the IT budget or having to recruit a team of security analysts.

Tuesday 22 September 2020

Threat Landscape Trends: Endpoint Security, Part 1

Part 1: Critical severity threats and MITRE ATT&CK tactics

In the ongoing battle to defend your organization, deciding where to dedicate resources is vital. To do so efficiently, you need to have a solid understanding of your local network topology, cloud implementations, software and hardware assets, and the security policies in place. On top of that, you need to have an understanding of what’s traveling through and residing in your environment, and how to respond when something is found that shouldn’t be there.

This is why threat intelligence is so vital. Not only can threat intelligence help to defend what you have, it can tell you where you’re potentially vulnerable, as well as where you’ve been attacked in the past. It can ultimately help inform where to dedicate your security resources.

What threat intelligence can’t tell you is exactly where you’ll be attacked next. The fact is that  there’s no perfect way to predict an attacker’s next move. The closest you can come is knowing what’s happening out in the larger threat landscape—how attackers are targeting organizations across the board. From there it’s possible to make those critical, informed decisions based on the data at hand.

This is the purpose of this new blog series, Threat Landscape Trends. In it, we’ll be taking a look at activity in the threat landscape and sharing the latest trends we see. By doing so, we hope to shed light on areas where you can quickly have an impact defending your assets, especially if dealing with limited security resources.

To do this, we’ll dive into various Cisco Security technologies that monitor, alert, and block suspected malicious activity. Each release will focus on a different product, given the unique view of activity each can provide, informing you on different aspects of the threat landscape.

Beginning at the endpoint

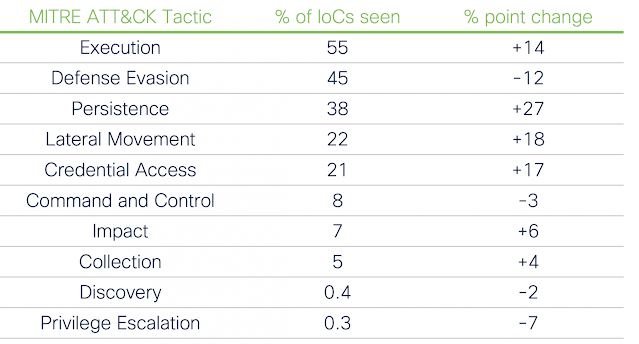
To kick off the series, we’ll begin with Cisco’s Endpoint Security solution. Over the course of two blog posts we’ll examine what sort of activity we’ve seen on the endpoint in the first half of 2020. In the first, we’ll look at critical severity threats and the MITRE ATT&CK framework. In part two, to be published in the coming weeks, we’ll dive deeper into the data, providing more technical detail on threat types and the tools used by attackers.

To protect an endpoint, Cisco’s Endpoint Security solution leverages a protection lattice comprised of several technologies that work together. We’ll drill down into telemetry from one of these technologies here: the Cloud Indication of Compromise (IoC) feature, which can detect suspicious behaviors observed on endpoints and look for patterns related to malicious activity.

In terms of methodology for the analysis that follows, the data is similar to alerts you would see within the dashboard of Cisco’s Endpoint Security solution, only aggregated across organizations to get the percentage of organizations that have encountered particular IoCs as a baseline. The data set covers the first half of 2020, from January 1st through June 30th. We’ll cover this in more detail in the Methodology section at the end of this post, but for now, let’s dive into the data.

Threat severity

When using Cisco’s Endpoint Security solution, one of the first things you’ll notice in the dashboards is that alerts are sorted into four threat severity categories: low, medium, high, and critical. Here is a breakdown of these severity categories in terms of the frequency that organizations encountered IoC alerts:

Cisco Tutorial and Materials, Cisco Learning, Cisco Guides, Cisco Exam Prep, Cisco Prep

Percentage of low, medium, high, and critical severity IoCs

As you might expect, the vast majority of alerts fall into the low and medium categories. There’s a wide variety of IoCs within these severities. How serious a threat the activity leading to these alerts pose depends on a number of factors, which we’ll look at more broadly in part two of this blog series.

For now, let’s start with the most serious IoCs that Cisco’s Endpoint Security solution will alert on: the critical severity IoCs. While these make up a small portion of the overall IoC alerts, they’re arguably the most destructive, requiring immediate attention if seen.

Cisco Tutorial and Materials, Cisco Learning, Cisco Guides, Cisco Exam Prep, Cisco Prep

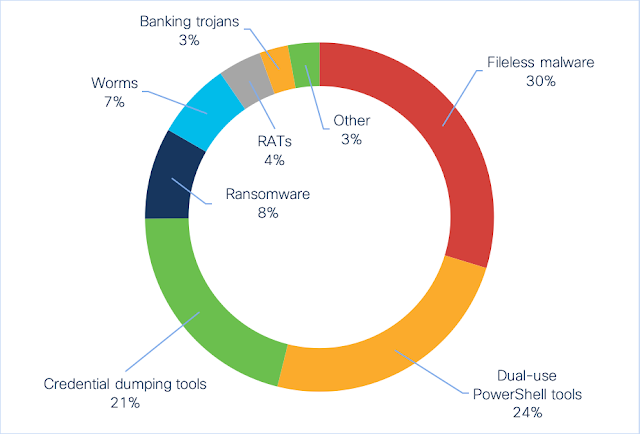
Critical severity IoCs

Sorting the critical IoCs into similar groups, the most common threat category seen was fileless malware. These IoCs indicate the presence of fileless threats—malicious code that runs in memory after initial infection, rather than through files stored on the hard drive. Here, Cisco’s Endpoint Security solution detects activity such as suspicious process injections and registry activity. Some threats often seen here include Kovter, Poweliks, Divergent, and LemonDuck.

Coming in second are dual-use tools leveraged for both exploitation and post-exploitation tasks. PowerShell Empire, CobaltStrike, Powersploit, and Metasploit are four such tools currently seen here. While these tools can very well be used for non-malicious activity, such as penetration testing, bad actors frequently utilize them. If you receive such an alert, and do not have any such active cybersecurity exercises in play, an immediate investigation is in order.

The third–most frequently seen IoC group is another category of dual-used tools. Credential dumping is the process used by malicious actors to scrape login credentials from a compromised computer. The most commonly seen of these tools in the first half of 2020 is Mimikatz, which Cisco’s Endpoint Security solution caught dumping credentials from memory.

All told, these first three categories comprise 75 percent of the critical severity IoCs seen. The remaining 25 percent contains a mix of behaviors known to be carried out by well-known threat types:
  • Ransomware threats like Ryuk, Maze, BitPaymer, and others
  • Worms such as Ramnit and Qakbot
  • Remote access trojans like Corebot and Glupteba
  • Banking trojans like Cridex, Dyre, Astaroth, and Azorult
  • …and finally, a mix of downloaders, wipers, and rootkits

MITRE ATT&CK tactics


Another way to look at the IoC data is by using the tactic categories laid out in the MITRE ATT&CK framework. Within Cisco’s Endpoint Security solution, each IoC includes information about the MITRE ATT&CK tactics employed. These tactics can provide context on the objectives of different parts of an attack, such as moving laterally through a network or exfiltrating confidential information.

Multiple tactics can also apply to a single IoC. For example, an IoC that covers a dual-use tool such as PowerShell Empire covers three tactics:
  • Defense Evasion: It can hide its activities from being detected.
  • Execution: It can run further modules to carry out malicious tasks.
  • Credential Access: It can load modules that steal credentials.
With this overlap in mind, let’s look at each tactic as a percentage of all IoCs seen:

Cisco Tutorial and Materials, Cisco Learning, Cisco Guides, Cisco Exam Prep, Cisco Prep

IoCs grouped by MITRE ATT&CK tactics

By far the most common tactic, Defensive Evasion appears in 57 percent of IoC alerts seen. This isn’t surprising, as actively attempting to avoid detection is a key component of most modern attacks.

Execution also appears frequently, at 41 percent, as bad actors often launch further malicious code during multi-stage attacks. For example, an attacker that has established persistence using a dual-use tool may follow up by downloading and executing a credential dumping tool or ransomware on the compromised computer.

Two tactics commonly used to gain a foothold, Initial Access and Persistence, come in third and fourth, showing up 11 and 12 percent of the time, respectively. Communication through Command and Control rounds out the top 5 tactics, appearing in 10 percent of the IoCs seen.

Critical tactics

While this paints an interesting picture of the threat landscape, things become even more interesting when combining MITRE ATT&CK tactics with IoCs of a critical severity.

Cisco Tutorial and Materials, Cisco Learning, Cisco Guides, Cisco Exam Prep, Cisco Prep

Critical severity IoCs grouped by MITRE ATT&CK tactics

For starters, two of the tactics were not seen in the critical severity IoCs at all, and two more registered less than one percent. This effectively removes a third of the tactics from focus.

What’s also interesting is how the frequency has been shuffled around. The top three remains the same, but Execution is more common amongst critical severity IoCs than Defense Evasion. Other significant moves when filtering by critical severity include:

  • Persistence appears in 38 percent of critical IoCs, as opposed to 12 percent of IoCs overall.
  • Lateral Movement jumps from 4 percent of IoCs seen to 22 percent.
  • Credential Access moves up three spots, increasing from 4 percent to 21 percent.
  • The Impact and Collections tactics both see modest increases.
  • Privilege Escalation plummets from 8 percent to 0.3 percent.
  • Initial Access drops off the list entirely, previously appearing fourth.

Defending against the critical


This wraps up our high-level rundown of the IoC data. So armed with this information about the common threat categories and tactics, what can you do to defend your endpoints? Here are a few suggestions about things to look at:

Limit execution of unknown files

If malicious files can’t be executed, they can’t carry out malicious activity. Use group policies and/or “allow lists” for applications that are permitted to run on endpoints in your environment. That’s not to say that every control available should be leveraged in order to completely lock an endpoint down—limiting end-user permissions too severely can create entirely different usability problems.

If your organization utilizes dual-use tools for activities like remote management, do severely limit the number of accounts that are permitted to run the tools, only granting temporary access when the tools are needed.

Monitor processes and the registry

Registry modification and process injection are two primary techniques used by fileless malware to hide its activity. Monitoring the registry for unusual changes and looking for strange process injection attempts will go a long way towards preventing such threats from gaining a foothold.

Monitor connections between endpoints

Keep an eye on the connections between different endpoints, as well as connections to servers within the environment. Investigate if two machines are connecting that shouldn’t, or an endpoint is talking to a server in a way that it doesn’t normally. This could be a sign that bad actors are attempting to move laterally across a network.