Tuesday, 21 January 2020

CLEUR Preview! Source of Truth Driven Network Automation

It’s a new year and a new decade, so it’s time for a NEW BLOG about network automation. I am getting ready for Cisco Live Europe 2020 and want to give everyone a preview of some of what I’ll be talking about in my session How DevNet Sandbox Built an Automated Data Center Network in Less than 6 Months – DEVNET-1488. If you’ll be in Barcelona, please register and join me for a look at how we approached this project with a goal to “innovate up to the point of panic” and brought in a lot of new NetDevOps and network automation processes.  But don’t worry if you’re reading this from far off in the future, or aren’t attending CLEUR, this blog will still be wildly entertaining and useful!

Today’s blog I want to build on those by showing where the details that provide the INPUT to the automation comes from – something often called the Source of Truth.

Cisco Study Materials, Cisco Online Exam, Cisco Learning, Cisco Tutorial and Material, Cisco Exam Prep

What is a Source of Truth?


If you’ve been kicking around the network automation space for awhile, you may have run across this term… or maybe you haven’t, so let me break it down for you.

Let’s say you are diving into a project to automate the interface configuration for your routers.  You’re going to need 2 things (well likely more than 2, but for this argument we’ll tackle 2).

First, you’ll need to develop the “code” that applies your desired standards for interface configuration.  This often includes building some configuration template and logic to apply that template to a device.  This code might be Python, Ansible, or some other tool/language.

Second, you need to know what interfaces need to be configured, and the specifics for each interface.  This often includes the interface name (ie Ethernet1/1), IP address info, descriptions, speed/duplex, switch port mode, and so on.  This information could be stored in a YAML file (a common case for Ansible), a CSV file, dictionaries and lists in Python, or somewhere else.

Then your code from the “first” will read in the details from the “second” to complete the project.

The “Source of Truth” is that second thing.  It is simply the details that are the desired state of the network.  Every project has a “Source of Truth”, even if you don’t think of it that way.  There are many different tools/formats that your source of truth might take.

Simple Sources of Truth include YAML and CSV files and are great for small projects and when you are first getting started with automation.  However, many engineers and organizations often find themselves reaching a point in their automation journey where these simple options are no longer meeting their needs.  It could be because of the sheer amount of data becomes unwieldy.  Or maybe it’s the relationships between different types of data.  Or it could be that the entire team just isn’t comfortable working in raw text for their information.

When text based options aren’t meeting the needs anymore, organizations might turn to more feature rich applications to act as their Source of Truth.  Applications like Data Center Infrastructure Management (DCIM) and IP Address Management (IPAM) can definitely fill the role of the Source of Truth.  But there is a key difference in using a DCIM/IPAM tool as an automation Source of Truth from how we’ve traditionally used them.

How a DCIM or IPAM becomes a Source of Truth


In the past (before automation), the data and information in these tools was often entered after a network was designed, built, and configured.  The DCIM and IPAM data was a “best effort” representation of the network typically done begrudgingly by engineers who were eager to move onto the next project.  And if we are honest with ourselves, we likely never trusted the data in there anyway.  The only real “Source of Truth” for how the network was configured was the actual network itself.  Want to know what the desired configuration for a particular switch was?  Well go log into it and look.

With Source of Truth driven network automation, we spin the old way on its head.  The first place details about the network are entered isn’t at the CLI for a router, but rather into the IPAM/DCIM tool.  Planning the IP addresses for each router interface – go update the Source of Truth.  Creating the list of VLANs for a particular site – go update the Source of Truth.  Adding a new network to an existing site – go update the Source of Truth.

The reason for the change is that the code you run to build the network configuration will read in the data for each specific device from the Source of Truth at execution time.  If the data isn’t in your DCIM/IPAM tool, then the automation can’t work.  Or if the data isn’t correct in the DCIM/IPAM tool, then the automation will generate incorrect configuration.

It’s also worth noting now that a Source of Truth can be used as part of network validation and health tests as well as for configuration.  Writing a network test case with pyATS and Genie to verify all your interfaces are configured correctly?  Well how do you know what is “correct”?  You’d read it from your Source of Truth.  I call that “Source of Truth driven Network Validation” and I’ll tackle it more specifically in a future blog post.

Source of Truth Driven Automation in Action!


Enough exposition, let’s see this in action.

The Source of Truth that we use in DevNet Sandbox for most information is Netbox.  Netbox is an open source DCIM/IPAM tool originally developed by the network automation team at Digital Ocean for their own needs, and has been popular with many engineers and enterprises looking for a tool of their own.

Let’s suppose we need to add a new network to our main internal admin environment in the Sandbox with the following basic information.

◉ The name of the network will be demo-sourceoftruth
◉ It will need an IP prefix assigned to it from the appropriate IP space
◉ Ethernet 1/3 on the switch sjcpp-leaf01-1 needs to be configured as an access port for this network

The automation to do the actual configuration of the VLAN, SVI, interface config, etc is already done, what I need to do is update the Source of Truth that will drive the automation. This involves the following steps:

1. Creating a new VLAN object

2. Allocating an available prefix and assigning to the new VLAN

3. Updating the details for port Ethernet 1/33 to be an access port on this VLAN

Note: You can click on the screen images that follow to enlarge for easier viewing.

Step 1: Creating a new VLAN object


I start in Netbox at the Tenant view for our Admin environment. From here I can easily view all the DCIM and IPAM details for this environment.

Cisco Study Materials, Cisco Online Exam, Cisco Learning, Cisco Tutorial and Material, Cisco Exam Prep

I click on VLANs to see the current list of VLANs.

Cisco Study Materials, Cisco Online Exam, Cisco Learning, Cisco Tutorial and Material, Cisco Exam Prep

The “Group” column represents the VLAN Group in Netbox – which is a way to organize VLANs that are part of the same switching domain where a particular VLAN id has significance.  This new network will be in the “Internal” group.  I click on “Internal” on any of the VLANs to quickly jump to that part of Netbox so I can find an available VLAN id to use.

Cisco Study Materials, Cisco Online Exam, Cisco Learning, Cisco Tutorial and Material, Cisco Exam Prep

I see that there are 4 VLANs available between 25 and 30, and I click on the green box to add a new on in that space.

Cisco Study Materials, Cisco Online Exam, Cisco Learning, Cisco Tutorial and Material, Cisco Exam Prep

I provide the new name for this network, and indicate it’s role will be for “Sandbox Systems”.  As this new network will be part of the Admin Tenant, I select the proper Group and Tenant from the drop downs.  Netbox supports creating custom fields for data that you need, and we’ve created a field called “Layer3 Enabled on Switched Fabric” to indicate whether SVIs should be setup for a network.  In this case that is True.  After providing the details, I click “Create” to create this new VLAN.

Step 2: Allocating an available prefix and assigning to the new VLAN


Netbox is a full featured IPAM, so let’s walkthrough allocating a prefix for the VLAN.

I start at the Supernet for admin networks at this site, 10.101.0.0/21 to find an available prefix.

Cisco Study Materials, Cisco Online Exam, Cisco Learning, Cisco Tutorial and Material, Cisco Exam Prep

I click on the Available range, to jump to the “Add a New Prefix” interface.

Cisco Study Materials, Cisco Online Exam, Cisco Learning, Cisco Tutorial and Material, Cisco Exam Prep

I start by updating the Prefix to be the proper size I want, picking the Role (this matches the VLAN role), providing a good description so folks know what this is for.  I then choose the new VLAN we just created to associate this prefix to using the drop downs and search options provided in the UI.  Lastly I pick the Admin tenant and click “Create”

Now if I go back and look at the VLANs associated with the Admin Tenant, I can see our new VLAN in the list with the Prefix allocated.

Cisco Study Materials, Cisco Online Exam, Cisco Learning, Cisco Tutorial and Material, Cisco Exam Prep

Step 3: Updating the details for port Ethernet 1/3 to be an access port on this VLAN


The final step in Netbox is to indicate the physical switch interfaces that will have devices connected to this new VLAN.

I navigate in Netbox to the device details page for the relevant switch.  At the bottom of the page are all the interfaces on the device.  I find interface Ethernet 1/3 and click the “Edit” button.

Cisco Study Materials, Cisco Online Exam, Cisco Learning, Cisco Tutorial and Material, Cisco Exam Prep

I update the interface configuration with an appropriate Description, set the 802.1Q Mode to Access, and select our new VLAN as the Untagged VLAN for the port.  Then click “Update” to save the changes.

Cisco Study Materials, Cisco Online Exam, Cisco Learning, Cisco Tutorial and Material, Cisco Exam Prep

Applying the New Network Configuration


With our Source of Truth now updated with the new network information, we simply need our network automation to read this data in and configure the network.  There are many ways this could be done, including a fully automated option where a webhook from Netbox kicks off the automation.  In our environment we are adopting network automation in stages as we build experience and confidence.  Our current status is that we execute the automation to process the data from the Source of Truth to update the network configuration manually.

When I run the automation to update the network configuration with the new Source of Truth info, here are the changes to the vlan-tenant configuration for our admin environment.

hapresto@nso1-preprod(config)# load merge nso_generated_configs/vlan-tenant_admin.xml
Loading.
1.78 KiB parsed in 0.00 sec (297.66 KiB/sec)

hapresto@nso1-preprod(config)# show configuration
vlan-tenant admin
  network demo-sourceoftruth
    vlanid 26
    network 10.101.1.0/28
    layer3-on-fabric true
    connections switch-pair sjcpp-leaf01
      interface 1/3
      description "Demonstration VLAN for Blog - Interface Config"
      mode access

Here you can see the new network being created, along with the VLAN id, prefix, and even the physical interface configurations.  All this detail was pulled directly from Netbox by our automation process.

And if you’d like to see the final network configuration that will be applied to the network after processing the templates in our network service by NSO, here it is.

    device {
        name sjcpp-leaf01-1
        data vlan 26
              name demo-sourceoftruth
             !
             interface Vlan26
              no shutdown
              vrf member admin
              ip address 10.101.1.2/28
              no ip redirects
              ip router ospf 1 area 0.0.0.0
              no ipv6 redirects
              hsrp version 2
              hsrp 1 ipv4
               ip 10.101.1.1
               preempt
               priority 110
              exit
             exit
             interface Ethernet1/3
              switchport mode access
              switchport access vlan 26
              no shutdown
              description Demonstration VLAN for Blog - Interface Config
              mtu 9216
             exit
    }
    device {
        name sjcpp-spine01-1
        data vlan 26
              name demo-sourceoftruth
             !
    }

Note: The service also updates vCenter to create a new port-group for the vlan, as well as Cisco UCS, but I’m only showing the typical network configuration here.

Finishing Up!


Hopefully this gives you a better idea about how a Source of Truth fits into network automation projects, and how a tool like Netbox provides this important feature for enterprises.

Monday, 20 January 2020

Spinning up an NVMe over Fibre Channel Strategy

Every so often there comes a time when we witness a major shift in the networking industry that fundamentally changes the landscape, including product portfolios and investment strategies. Storage Area Networking (SAN) is undergoing one such paradigm shift that opens up a huge opportunity for those looking to refresh their SAN investments and take advantage of the latest and greatest developments in this particular space. We can think of it as a “trifecta effect.”

Cisco Study Materials, Cisco Certifications, Cisco Online Exam, Cisco Guides, Cisco Prep

In this blog, we’ll discuss the latest and greatest innovations driving the SAN industry and try to paint a picture of how the SAN landscape will look five to seven years down the road, while focusing on asking the right questions prior to that critical investment. Following this, we will be posting additional blogs that will dig deeper into each of the technological advancements; but it helps to understand the bigger picture and the Cisco point of view, which we will cover here.

Why Now?


Modern enterprise applications are exerting tremendous pressure on your SAN infrastructure. Keeping up with the trends, customers are looking to invest in higher performing storage and storage networking. Combining the economic viability of All Flash Arrays and the technological advancements with NVMe over FC, there has never been a more compelling opportunity to upgrade your SAN infrastructure with investment protection and support for 64G Fibre Channel Performance.

But before we think about refreshing our SAN, we have to ask few questions ourselves:

◉ Does it support NVMe?
◉ Is it 64Gb FC ready?
◉ Do we get any sort of deep packet visibility, a.k.a SAN analytics, for monitoring, diagnostics, and troubleshooting?
◉ Do we really need to “RIPlace” our existing infrastructure?

We will elaborate more on above questions one by one in a this series of blogs.

Today, we’re going to talk about NVMe array support over FC using Cisco MDS 9000 series switches, and get to the bottom of why NVMe is so important, why there is so much excitement around NVMe, and why everyone is (storage vendors and customers) eager to implement NVMe.

NVMe has superseeded rotating/spinning disks. So with no more rotating motors or moving heads, everything is in the form of Non-Volatime Memory (NVM) based storage. This results in extremely high reads and writes. Using built-in multi-core, multi-threaded CPUs, and PCI 3.0 bus provides extreme high, low latency thoughput.

Does Cisco’s SAN solution have support for NVMe/FC?

This is a very common and top-of-mind question from customers during conversations on roadmap, feature set, or for that matter any discussion involving SAN. The good news on Cisco MDS SAN solution is – yes, we do support NVMe/FC. We support it transparently – no additional hardware/commands needed to enable it. Any current 16G/32G Cisco MDS 9700 module or any current selling 16G/32G FC fabric switch using new NX-OS 8.x release supports it. There is no additional license needed, no additional features to enable identification of NVMe commands. Cisco MDS 9000 can unleash the performance of NVMe arrays over FC or FCoE transport, connected to SCSI or NVMe initiators or targets, concurrently, across the same SAN.

Vendor Certification

From the Ecosystem support perspective, we have certified Broadcom, Emulex, Cavium and Qlogic HBAs, along with Cisco UCS C-Series servers. We have also published a Cisco validated design guide with NVMe solution which are listed at the end of the blog.

Cisco Study Materials, Cisco Certifications, Cisco Online Exam, Cisco Guides, Cisco Prep

We can run SCSI and NVMe flows together through the same hardware, through the same ISL (Inter Switch Link) and Cisco MDS switches will transparently allow successful registrations and logins with NVMe Name Servers as well as I/O exchanges between SCSI and NVMe initiators and targets, together.

This way, NVMe/FC, along with Cisco MDS SAN solution provides the best possible performance across the SAN with seamless insertion of NVMe storage arrays in the existing ecosystem of MDS hardware.

NVMe/FC Support Matrix with MDS 

If you are looking for NVMe/FC and MDS integration within CVDs, here are some of the documents for you to start with:

1. Unleash the power of flash storage using Cisco UCS, Nexus, and MDS
2. FlashStack Virtual Server Infrastructure Design Guide for VMware vSphere 6.0 U2
3. Cisco UCS Integrated Infrastructure for SAP HANA
4. FlashStack Data Center with Oracle RAC 12cR2 Database
5. Cisco and Hitachi Adaptive Solutions for Converged Infrastructure Design Guide
6. VersaStack with VMware vSphere 6.7, Cisco UCS 4th Generation Fabric, and IBM FS9100 NVMe-accelerated Storage Design Guide

So, what are we waiting for? Probably nothing. The roads are ready, just get the drivers and cars on this road to make it Formula one racing track…

Saturday, 18 January 2020

Business Architects at Cisco Live: Innovating with Impact, Speed and Scale

This year at Cisco Live Barcelona, Business Architecture (BA) will feature in many places and times throughout the event, but the center of gravity will no doubt be the BA booth, located right in the middle of the Hub !

Cisco Online Exam, Cisco Tutorials and Materials, Cisco Study Materials, Cisco Prep

Please come and visit us to better understand how Cisco Business Architects and our Ecosystem Partners can accelerate and improve your digital transformation initiatives. To get a sneak preview, read on.

Cisco Business Architects have the know-how, skills and tools to drive innovation with the highest impact to your business:

◉ BAs make technology investments relevant to your key business stakeholders and users through collaborative workshops powered by Design Thinking & visual tools

◉ BAs bridge the gap between business and IT by addressing the hard People/Process/ Technology challenges.

◉ BAs capture new budgets allocated to digital transformation by shaping and telling a story that all your stakeholders understand/support.

◉ BAs look at the big picture, increase the pace of innovation, sharpen your business impact.

◉ BAs skip theory, paper work and the reports no one reads: we focus on tangible outcomes for users and the business. Pilot, fail fast, iterate.

◉ BAs build a trusted relationship between you, Cisco and our ecosystem partners, orchestrating the best resources and experts, delivering ongoing innovation, solving key challenges and positively impacting business, society, and the planet.

Our digital transformation toolbox is simple, powerful and unique in the market:

1. Digital Journey Dashboard (DJD): we create a 1-page strategy to clarify priorities and connect the strategic business drivers with the innovation roadmap. We identify the most business-impactful use cases.

2. Business Innovation Sprint (BIS): we run hackathons and Design Thinking workshops with key stakeholders from Business & IT to develop innovative solutions addressing the toughest business challenges.

3. SCIPAB Storyboard: we write & tell the story which will convince business executives to invest in new technology solutions that accelerate business innovation.

4. Innovation Lab: we bring it all together, collaborating with our customers and our Ecosystem Partners to operationalize innovation, continuously turning ideas into technology solutions that solve industry pain points.

For more details, you can download the 1-pager here below, which Cisco Business Architects affectionally refer to as our “BA Poppy”.

Cisco Online Exam, Cisco Tutorials and Materials, Cisco Study Materials, Cisco Prep

Business Architecture Clinics at Cisco Live


If you happen to be in Barcelona for Cisco Live 2020, we’d be happy to host you in a 60-/90-minute BA Clinic, which takes place in a private meeting room, away from the hustle and bustle of the BA booth.

A BA Clinic is a highly interactive and practical discussion structured around the “Art of the Possible” for Digital Transformation in your organization. We analyze the innovation trends relevant to your industry (with our “Industry Portfolio Explorer”), and cycle through the Business Drivers (“Why“), the IT Operating Model (“How“), and the Technology Platform (“What“). Finally, we will select the “Business Innovation Sprints” that will yield most impact.

Cisco Online Exam, Cisco Tutorials and Materials, Cisco Study Materials, Cisco Prep

During the BA clinic, Cisco’s seasoned Business Architects will capture the information required to build a draft Digital Journey Dashboard (similar to the one presented below), which we will send you after Cisco Live. From there and if you are interested to do more with us, we can organize a 1-day workshop with Lines of Business and IT stakeholders in your organization, and complete the DJD version 1.0 – which you can proudly hang in your office.

Cisco Online Exam, Cisco Tutorials and Materials, Cisco Study Materials, Cisco Prep
Digital Journey Dashboard (DJD)

Whether you decide to schedule a BA Clinic or simply to pay us a short visit at the BA Booth, please make sure you pick up a couple of California White Poppy seeds, hoping we can create together a fertile ground for innovation to blossom in your organisation!

Cisco Online Exam, Cisco Tutorials and Materials, Cisco Study Materials, Cisco Prep

Friday, 17 January 2020

Three IoT trends to watch this month

Cisco Prep, Cisco Tutorials and Material, Cisco Learning, Cisco Certification, Cisco Online Exam

The world of IoT continues to grow as our more than 70,000 customers take their deployments to the next level. Whether or not you are attending Cisco Live in Barcelona on January 27th – 30th, you will want to tune in. Cisco will be making a lot of announcements, and addressing these three IoT trends.

1. The network is the foundation for both IT and OT environments, but a multi-domain architecture is key


While the network has always been the backbone for IT, it has quickly become the foundation for operational technology (OT) environments as well. OT needs data to help them improve customer experiences, enhance safety, increase efficiencies, and reduce costs. There is no better way to achieve these results than by mining data from key assets such as a machine on a factory floor, a fleet of service vehicles, or a remote pipe line. And this is where the importance of the network expands from IT into OT environments. To get the data that OT needs, assets must securely connect to a reliable network.  And with the amount of devices being connected, not just any network will do. Only Cisco is providing a true multi-domain architecture bringing common visibility and management across all domains – including the OT domain – making IoT projects easier to scale.  Look for how we are bringing bigger value to this network in the upcoming weeks.

2. Edge compute and getting the most value out of your data


Edge compute is creating a new set of use cases and business models by allowing data to be accessed and processed at the edge – without ever traversing the WAN. It allows organizations to deploy real-time applications anywhere – even on the side of the road where every second counts to ensure pedestrian and driver safety. Edge is a critical part of our IoT strategy as we work to bring the power of the enterprise to edge environments. It is integrated with our network so applications are easier to manage and deploy. As 5G and other innovation accelerators enter the market, Cisco is ready with edge computing solutions wherever they are needed, even harsh and remote environments.

Cisco Prep, Cisco Tutorials and Material, Cisco Learning, Cisco Certification, Cisco Online Exam

As part of this, we will talk about the challenges around harnessing the data that will bring your business to the next level.  Does your organization have data deluge? Or a data drought? Do you know who has access to your data and who doesn’t? Getting the right data to the right person at the right time can be critical to saving lives, edging out the competition, or reducing downtime. The key to doing this is Cisco IoT solutions. We will discuss how Cisco can help organizations tackle the data challenge including its collection, transformation and delivery so that you can make sense of it all.

3. Security at the edge is more critical than ever, and IT and OT need to work together for its success


As millions of devices come online in operational environments, the cyber security risks grow exponentially. So, as the network becomes more distributed to connect these industrial environments, the security must become distributed too. In factories, for example, machine controllers are now smarter. They have their own software and CPU helping create more agile manufacturing environments. But, the combination of their intelligence and their network connectivity, is also making them more vulnerable to attacks. We will address how organizations can more easily secure these OT environments at scale.

Also, we touch on the importance of IT and OT working together. In order to implement security properly, a very diverse skillset is required – a skillset that only IT and OT together, can provide. IT understands how to secure networks, while OT are experts at optimizing their processes. Bringing together the knowledge of the network and security with the knowledge of the business and its process is critical for success. In the upcoming weeks, stay tuned as to how organizations can do this all successfully with Cisco.

Thursday, 16 January 2020

Disk Image Deception

Cisco’s Computer Security Incident Response Team (CSIRT) detected a large and ongoing malspam campaign leveraging the .IMG file extension to bypass automated malware analysis tools and infect machines with a variety of Remote Access Trojans. During our investigation, we observed multiple tactics, techniques, and procedures (TTPs) that defenders can monitor for in their environments. Our incident response and security monitoring team’s analysis on a suspicious phishing attack uncovered some helpful improvements in our detection capabilities and timing.

In this case, none of our intelligence sources had identified this particular campaign yet. Instead, we detected this attack with one of our more exploratory plays looking for evidence of persistence in the Windows Autoruns data. This play was successful in detecting an attack against a handful of endpoints using email as the initial access vector and was able to evade our defenses at the time. Less than a week after the incident, we received alerts from our retrospective plays for this same campaign once our integrated threat intelligence sources delivered the indicators of compromise (IOC). This blog is a high level write-up of how we adapted to a potentially successful attack campaign and our tactical analysis to help prevent and detect future campaigns.

Incident Response Techniques and Strategy


The Cisco Computer Security and Incident Response Team (CSIRT) monitors Cisco for threats and attacks against our systems, networks, and data. The team provides around the globe threat detection, incident response, and security investigations. Staying relevant as an IR team means continuously developing and adapting the best ways to defend the network, data, and infrastructure. We’re constantly experimenting with how to improve the efficiency of our data-centric playbook approach in the hope it will free up more time for threat hunting and more in-depth analysis and investigations. Part of our approach has been that as we discover new methods for detecting risky activity, we try to codify those methods and techniques into our incident response monitoring playbook to keep an eye on any potential future attacks.

Although some malware campaigns can slip past the defenses with updated techniques, we preventatively block the well-known, or historical indicators and leverage broad, exploratory analysis playbooks that spotlight more on how attackers operate and infiltrate. In other words, there is value in monitoring for the basic atomic indicators of compromised like IP addresses, domain names, file hashes, etc. but to go further you really have to look broadly at more generic attack techniques. These playbooks, or plays, help us find out about new attack campaigns that are possibly targeted and potentially more serious. While some might label this activity “threat hunting”, this data exploration process allows us to discover, track, and potentially share new indicators that get exposed during a deeper analysis.

Defense in depth demands that we utilize additional data sources in case attackers successfully evade one or more of our defenses, or if they were able to obscure their malicious activities enough to avoid detection. Recently we discovered a malicious spam campaign that almost succeeded due to a missed early detection. In one of our exploratory plays, we use daily diffs for all the Microsoft Windows registry autorun key changes since the last boot. Known as “Autoruns“, this data source ultimately helped us discover an ongoing attack that was attempting to deliver a remote access trojan (RAT). Along with the more mundane Windows event logs, we pieced together the attack from the moment it arrived and made some interesting discoveries on the way — most notably how the malware seemingly slipped past our front line filters. Not only did we uncover many technical details about the campaign, but we also used it as an opportunity to refine our incident response detection techniques and some of our monitoring processes.

IMG File Format Analysis


.IMG files are traditionally used by disk image files to store raw dumps of either a magnetic disk or of an optical disc. Other disk image file formats include ISO and BIN. Previously, mounting disk image file files on Windows required the user to install third-party software. However Windows 8 and later automatically mount IMG files on open. Upon mounting, Windows File Explorer displays the data inside the .IMG file to the end user. Although disk image files are traditionally utilized for storing raw binary data, or bit-by-bit copies of a disk, any data could be stored inside them. Because of the newly added functionality to the Windows core operating system, attackers are abusing disk image formats to “smuggle” data past antivirus engines, network perimeter defenses, and other auto mitigation security tooling. Attackers have also used the capability to obscure malicious second stage files hidden within a filesystem by using ISO and DMG (to a lesser extent). Perhaps the IMG extension also fools victims into considering the attachment as an image instead of a binary pandora’s box.

Know Where You’re Coming From


As phishing as an attack vector continues to grow in popularity, we have recently focused on several of our email incident response plays around detecting malicious attachments, business email compromise techniques like header tampering or DNS typosquatting, and preventative controls with inline malware prevention and malicious URL rewriting.

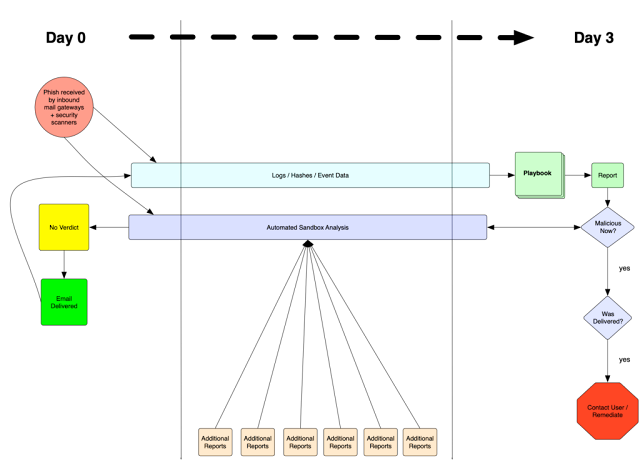
Any security tool that has even temporarily outdated definitions of threats or IOCs will be unable to detect a very recent event or an event with a recent, and therefore unknown, indicator. To ensure that these missed detections are not overlooked, we take a retrospective look back to see if any newly observed indicators are present in any previously delivered email. So when a malicious attachment is delivered to a mailbox, if the email scanners and sandboxes do not catch it the first time, our retrospective plays look back to see if the updated indicators are triggered. Over time sandboxes update their detection abilities and previously “clean” files could change status. The goal is to detect this changing status and if we have any exposure, then we reach out and remediate the host.

This process flow shows our method for detecting and responding to updated verdicts from sandbox scanners. During this process we collect logs throughout to ensure we can match against hashes or any other indicator or metadata we collect:

Cisco Tutorials and Materials, Cisco Learning, Cisco Certifications, Cisco Guides, Cisco Online Exam, Cisco Prep

Figure 1: Flow chart for Retrospective alerting

This process in combination with several other threat hunting style plays helped lead us to this particular campaign. The IMG file isn’t unique by any means but was rare and stood out to our analysts immediately when combined with the file name as a fake delivery invoice – one of the more tantalizing and effective types of phishing lures.

Incident Response and Analysis


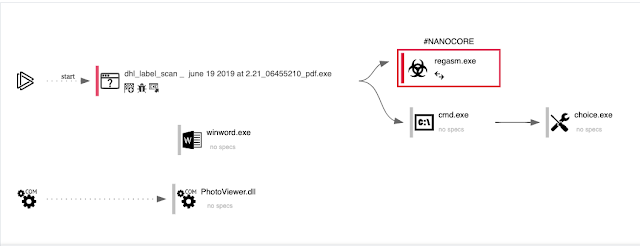
We needed to pull apart as much of the malicious components as possible to understand how this campaign worked and how it might have slipped our defenses temporarily. The process tree below shows how the executable file dropped from the original IMG file attachment after mounting led to a Nanocore installation:

Cisco Tutorials and Materials, Cisco Learning, Cisco Certifications, Cisco Guides, Cisco Online Exam, Cisco Prep

Figure 2: Visualization of the malicious process tree.

Autoruns


As part of our daily incident response playbook operations, we recently detected a suspicious Autoruns event on an endpoint. This log (Figure 2) indicated that an unsigned binary with multiple detections on the malware analysis site, VirusTotal, had established persistence using the ‘Run’ registry key. Anytime the user logged in, the binary referenced in the “run key” would automatically execute – in this case the binary called itself “filename.exe” and dropped in the typical Windows “%SYSTEMROOT%\%USERNAME%\AppData\Roaming” directory:

{

    "enabled": "enabled",

    "entry": "startupname",

    "entryLocation": "HKCU\\SOFTWARE\\Microsoft\\Windows\\CurrentVersion\\Run",

    "file_size": "491008",

    "hostname": "[REDACTED]",

    "imagePath": "c:\\users\\[REDACTED]\\appdata\\roaming\\filename.exe",

    "launchString": "C:\\Users\\[REDACTED]\\AppData\\Roaming\\filename.exe",

    "md5": "667D890D3C84585E0DFE61FF02F5E83D",

    "peTime": "5/13/2019 12:48 PM",

    "sha256": "42CCA17BC868ADB03668AADA7CF54B128E44A596E910CFF8C13083269AE61FF1",

    "signer": "",

    "vt_link": "https://www.virustotal.com/file/42cca17bc868adb03668aada7cf54b128e44a596e910cff8c13083269ae61ff1/analysis/1561620694/",

    "vt_ratio": "46/73",

    "sourcetype": "autoruns",

}

Figure 3: Snippet of the event showing an unknown file attempting to persist on the victim host

Many of the anti-virus engines on VirusTotal detected the binary as the NanoCore Remote Access Trojan (RAT), a well known malware kit sold on underground markets which enables complete control of the infected computer: recording keystrokes, enabling the webcam, stealing files, and much more. Since this malware poses a huge risk and the fact that it was able to achieve persistence without getting blocked by our endpoint security, we prioritized investigating this alert further and initiated an incident. 

Once we identified this infected host using one of our exploratory Autoruns plays, the immediate concern was containing the threat to mitigate as much potential loss as possible. We download a copy of the dropper malware from the infected host and performed additional analysis. Initially we wanted to confirm if other online sandbox services agreed with the findings on VirusTotal. Other services including app.any.run also detected Nanocore based on a file called run.dat being written to the %APPDATA%\Roaming\{GUID} folder as shown in Figure 3: 

Cisco Tutorials and Materials, Cisco Learning, Cisco Certifications, Cisco Guides, Cisco Online Exam, Cisco Prep

Figure 4: app.any.run analysis showing Nanocore infection

The sandbox report also alerted us to an unusual outbound network connection from RegAsm.exe to 185.101.94.172 over port 8166.

Now that we were confident this was not a false positive, we needed to find the root cause of this infection, to determine if any other users are at risk of being victims of this campaign. To begin answering this question, we pulled the Windows Security Event Logs from the host using our asset management tool to gain a better understanding of what occurred on the host at the time of the incident. Immediately, a suspicious event that was occurring every second  jumped out due to the unusual and unexpected activity of a file named “DHL_Label_Scan _ June 19 2019 at 2.21_06455210_PDF.exe” spawning the Windows Assembly Registration tool RegAsm.exe. 

Process Information:

 New Process ID:  0x4128

 New Process Name: C:\Windows\Microsoft.NET\Framework\v2.0.50727\RegAsm.exe

 Token Elevation Type: %%1938

 Mandatory Label:  Mandatory Label\Medium Mandatory Level

 Creator Process ID: 0x2ba0

 Creator Process Name: \Device\CdRom0\DHL_Label_Scan _  June 19 2019 at 2.21_06455210_PDF.exe

 Process Command Line: "C:\WINDOWS\Microsoft.NET\Framework\v2.0.50727\RegAsm.exe"

Figure 5: New process spawned from a ‘CdRom0’ device (the fake .img) calling the Windows Assembly Registration tool

This event stands out for several reasons.

◉ The filename:

1. Attempts to social engineer the user into thinking they are executing a PDF by appending “_PDF”

2. “DHL_Label_Scan” Shipping services are commonly spoofed by adversaries in emails to spread malware.

◉ The file path:

1. \Device\CdRom0\ is a special directory associated with a CD-ROM that has been inserted into the disk drive.

2. A fake DHL label is a strange thing to have on a CD-ROM and even stranger to insert it to a work machine and execute that file.

◉ The process relationship:

1. Adversaries abuse the Assembly Registration tool “RegAsm.exe” for bypassing process whitelisting and anti-malware protection.

2. MITRE tracks this common technique as T1121 indicating, “Adversaries can use Regsvcs and Regasm to proxy execution of code through a trusted Windows utility. Both utilities may be used to bypass process whitelisting through use of attributes within the binary to specify code that should be run before registration or unregistration”

3. We saw this technique in the app.any.run sandbox report.

◉ The frequency of the event:

1. The event was occurring every second, indicating some sort of command and control or heartbeat activity.

Mount Up and Drop Out


At this point in the investigation, we have now uncovered a previously unseen suspicious file: “DHL_Label_Scan _  June 19 2019 at 2.21_06455210_PDF.exe”, which is strangely located in the \Device\CdRom0\ directory, and the original “filename.exe” used to establish persistence.

The first event in this process chain shows explorer.exe spawning the malware from the D: drive.

Process Information:

New Process ID:  0x2ba0

New Process Name: \Device\CdRom0\DHL_Label_Scan _  June 19 2019 at 2.21_06455210_PDF.exe

Token Elevation Type: %%1938

Mandatory Label:  Mandatory Label\Medium Mandatory Level

Creator Process ID: 0x28e8

Creator Process Name: C:\Windows\explorer.exe

Process Command Line: "D:\DHL_Label_Scan _  June 19 2019 at 2.21_06455210_PDF.exe"

Figure 6: Additional processes spawned by the fake PDF

The following event is the same one that originally caught our attention, which shows the malware spawning RegAsm.exe (eventually revealed to be Nanocore) to establish communication with the command and control server:

Process Information:

New Process ID:  0x4128

New Process Name: C:\Windows\Microsoft.NET\Framework\v2.0.50727\RegAsm.exe

Token Elevation Type: %%1938

Mandatory Label:  Mandatory Label\Medium Mandatory Level

Creator Process ID: 0x2ba0

Creator Process Name: \Device\CdRom0\DHL_Label_Scan _  June 19 2019 at 2.21_06455210_PDF.exe

Process Command Line: "C:\WINDOWS\Microsoft.NET\Framework\v2.0.50727\RegAsm.exe"

Figure 7: RegAsm reaching out to command and control servers

Finally, the malware spawns cmd.exe and deletes the original binary using the built-in choice command: 

Process Information:

New Process ID:  0x2900

New Process Name: C:\Windows\SysWOW64\cmd.exe

Token Elevation Type: %%1938

Mandatory Label:  Mandatory Label\Medium Mandatory Level

Creator Process ID: 0x2ba0

Creator Process Name: \Device\CdRom0\DHL_Label_Scan _  June 19 2019 at 2.21_06455210_PDF.exe

 Process Command Line: "C:\Windows\System32\cmd.exe" /C choice /C Y /N /D Y /T 3 & Del "D:\DHL_Label_Scan _  June 19 2019 at 2.21_06455210_PDF.exe"

Figure 8: Evidence of deleting the original dropper.

At this point in the investigation of the original dropper and the subsequent suspicious files, we still could not answer how the malware ended up on this user’s computer in the first place. However with the filename of the original dropper to pivot with, a quick web search for the filename turned up a thread on Symantec.com from a user asking for assistance with the file in question. In this post, they write that they recognize the filename from a malspam email they received. Based on the Symantec thread and other clues, such as the use of the shipping service DHL in the filename, we now know the delivery method is likely via email.

Delivery Method Techniques


We used the following Splunk query to search our Email Security Appliance logs for the beginning of the filename we found executing RegAsm.exe in the Windows Event Logs.

index=esa earliest=-30d

[search index=esa "DHL*.img" earliest=-30d

| where isnotnull(cscoMID)

| fields + cscoMID,host

| format]

| transaction cscoMID,host

| eval wasdelivered=if(like(_raw, "%queued for delivery%"), "yes", "no")

| table esaTo, esaFrom, wasdelivered, esaSubject, esaAttachment, Size, cscoMID, esaICID, esaDCID, host

Figure 9: Splunk query looking for original DHL files.

As expected, the emails all came from the spoofed sender address noreply@dhl.com with some variation of the subject “Re: DHL Notification / DHL_AWB_0011179303/ ETD”. In total, CSIRT identified a total of 459 emails from this campaign sent to our users. Of those 459 emails, 396 were successfully delivered and contained 18 different Nanocore samples.

396 malicious emails making it past our well-tuned and automated email mitigation tools is no easy feat. While the lure the attacker used to social engineer their victims was common and unsophisticated, the technique they employed to evade defenses was successful – for a time.

Detecting the Techniques


During the lessons learned phase after this campaign, CSIRT developed numerous incident response detection rules to alert on newly observed techniques discovered while analyzing this incident. The first and most obvious being, detecting malicious disk image files successfully delivered to a user’s inbox. The false-positive rate for this specific type of attack is low in our environment, with a few exceptions here and there – easily tuned out based on the sender. This play could be tuned to look only for disk image files with a small file size if they are more prevalent in your environment.

Another valuable detection rule we developed after this incident is monitoring for suspicious usage (network connections) of the registry assembly executable on our endpoints, which is ultimately the process Nanocore injected itself into and was using to facilitate C2 communication. Also, it is pretty unlikely to ever see legitimate use of the choice command to create a self-destructing binary of sorts, so monitoring for execution of choice with the command-line arguments we saw in the Windows Event above should be a high fidelity alert.

Some additional, universal takeaways from this incident:

1. Auto-mitigation tools should not be treated as a silver bullet – Effective security monitoring, rapid incident response, and defense in depth/layers is more important.

2. Obvious solutions such as blocking extensions at email gateway are not always realistic in large, multifunction enterprises – .IMG files were legitimately being used by support engineers and could not be blocked.

3. Malware campaigns can slip right past defenders on occasion, so a wide playbook that focuses on how attackers operate and infiltrate (TTPs) is key for finding new and unknown malware campaigns in large enterprises (as opposed to relying exclusively on indicators of compromise.)

Indicators Of Compromise (IOCS)


2b6f19fac64c847258fe776a2ea6444cc469ac6a348e714fcab23cc6cb2c5b74

327c646431a644192aae8a0d0ebe75f7a2b98d7afa7a446afa97e2a004ca64b0

3718957d7f0da489935ce35b6587a6c93f25cff69d233381131b757778826da3

3873ef89a74a9c03ba363727b20429a45f29a525532d0ef9027fce2221f64f60

3a7c23a01a06c257b2f5b59647461ebf8f58209a598390c2910d20a9c5757c62

4eb2af63e121c22df7945258991168be4a70aa32669db173743701aab94383fb

5d14e5959c05589978680e46bffd586e10c1fcabc21ddd94c713520cd0037640

6a2af44e186531d07c53122d42280bc18929d059b98f0449c1a646d66a778ffb

80ab695da86e97861b294b72ba1ef2e8e2f322e7ec0d0834e71f92497515b63d

a34aa05710cf0afb111181c23468c2dcc3a2c2d6aa496c9dffe45dde11e2c4d1

abf41ea1909a39c644e5b480b176ef8a3c4a80e2ee8b447d4320e777384392cf

af5d9ca1ed166a8d378c5b5ed7e187035f374b4376bdd632c3a2ee156613fd29

afb87da69c9ad418ac29af27602a450a7eae63132443c7bc56ab17785dd3bbfd

d871704baad496b47b15da54e7766c0a468ac66337d99032908ad7d4732ecffb

da79495b8b75c9b122a1116494f68661ec45a1fdfb8fd39c000f1f691b39bc13

deb805ce329f17a48165328879b854674eb34abd704eeb575e643574f31d3e83

eaee0577806861c23bef8737e5ba2d315e9c6bfa38bf409dda9a2a13599615b4

fc0cf381e433cd578128be91dfd7567d2294a6d3ff4d2ce0e3f4046442b1f5f0

185.101.94.172:8166

Wednesday, 15 January 2020

How AppDynamics helps improve IT applications

Choosing which application enhancements will best serve the most users can be a difficult decision for any development team, and it certainly is for mine. It can also be difficult for teams to identify the right sources of issues in application performance. Now, many of those decisions are easier for my team because of the detailed information we get from the AppDynamics Application Performance Management solution.

Cisco Study Materials, Cisco Prep, Cisco Guides, Cisco Learning, Cisco Certification

We develop and maintain Cisco SalesConnect, our digital sales enablement automation platform that empowers our sellers and partners with sales collateral, training and customer insights needed to deliver exceptional customer experiences.

Available globally, SalesConnect has over 9 million hits per quarter, with 140,000+ unique users accessing nearly 40,000 content assets on over 100 microsites.  SalesConnect is popular among our target users: over 80 percent of Cisco salespeople use the platform along with 34 percent of Cisco customer experience and service employees, and more than 88,000 unique partner users worldwide.

Data to Improve a Sales Enablement Platform


Cisco Study Materials, Cisco Prep, Cisco Guides, Cisco Learning, Cisco Certification
We release a new version of SalesConnect every three weeks, giving us many opportunities to improve the platform’s functionality, performance, and user experience. In the past, it was hard to know which of these improvements should receive priority, especially for making the best use of our limited development resources and budget.

For example, if we develop a new feature, should we make it available for all browsers or just the most popular ones? We couldn’t easily answer this question because we didn’t have the right information. We would make educated guesses, but we never had detailed visibility into which browsers and devices were used to access SalesConnect.

We implemented the AppDynamics solution to gain this visibility as well as in-depth application monitoring for our platform. When planning development priorities, AppDynamics gives us detailed data on the usage levels of specific browsers and devices, which allows us to make informed decisions. The data also helps us ensure we are developing and testing code only for the browsers and devices preferred by our users. In a similar way, we can identify the needs of different countries or regions based on AppDynamics data about the geographic origins of page requests.

The AppDynamics data was a big help when my team needed to develop a new SalesConnect mobile beta app in a very short timeframe. We knew we wouldn’t have time to develop separate apps for both iOS and Android devices, but which one should we choose?

In just a few minutes, I was able to find the device usage data we needed in AppDynamics and it clearly showed that iOS devices are the choice for most of our users. This information simplified our beta development decision and allowed us to postpone the expense and effort of developing an Android app until feedback from the beta was analyzed.

When planning new releases, the knowledge we gain from AppDynamics data gives us more confidence that we are aligning our development resources on the capabilities that will deliver the most impact for our users.

Powerful Insights for Application Availability and Response


AppDynamics serves a powerful function by helping us maintain SalesConnect application uptime and responsiveness, reduce resolution time when problems occur, and avoid issues through proactive alerts. Specifically, the AppDynamics data helps us identify issues in the IT services used by the SalesConnect platform and in our integrations with other applications and databases.

In one case, AppDynamics data indicated that the source of brief but recurring outage was in one IT service used by SalesConnect.  Our IT team was able to go directly to that team and obtain a resolution within a few hours, not the days that might have been needed before.

This ability to rapidly diagnose and solve application problems has a tremendous payoff in time, effort, and cost savings for Cisco IT. When SalesConnect experiences problems, we no longer need to set up a “war room” and involve people from multiple teams to diagnose a cause that might be unrelated to their application or service. And because we can give users specific information about a problem and how we are working to resolve it, they have greater confidence about the platform’s reliability.

AppDynamics delivers continuous benefits to my team in maintaining the SalesConnect platform and planning new application capabilities. What types of data would be helpful to you for maintaining application availability or prioritizing application development?

Tuesday, 14 January 2020

Cisco Releases Terraform Support for ACI

Cisco Tutorial and Material, Cisco Guides, Cisco Learning, Cisco Certifications, Cisco Online Exam, Cisco Prep

Customers have embraced or are on the path to embrace the DevOps model to accelerate application deployment and achieve higher efficiency in operating their data centers as well as public cloud deployments. This arises from the fact that infrastructure needs to change and respond faster than ever to business needs.

The business needs of customers can extend beyond having infrastructure respond faster, they may also require considerations around performance, cost, resiliency and security. This has led to customers adopting multi-cloud architectures. One of the key requirements of multi-cloud architectures is to have network connectivity between application workloads running in different environments. This is where Cisco Application Centric Infrastructure (ACI) comes in.

Cisco ACI allows application requirements to define the network using a common policy-based operational model across the entire ACI-ready infrastructure. This architecture simplifies, automates, optimizes, and accelerates the entire application deployment life cycle across data center, WAN, access, and cloud.

The ability to interact with “infrastructure” in a programmable way, has made it possible to treat Infrastructure-as-Code. The term Infrastructure-as-Code, defines a comprehensive automation approach. This is where Hashicorp Terraform comes in.

Hashicorp Terraform is a provisioning tool for building, changing, and versioning infrastructure safely and efficiently. Terraform manages both existing, popular services and custom in-house solutions, offering over 100 providers. Terraform can manage low-level components such as compute instances, storage, and networking, as well as high-level components such as DNS entries, SaaS features, etc. All users have to do is describe, in code, the components and resources needed to run a single application or the entire datacenter.

With a vision to address some of the challenges listed above, especially in multi-cloud networking, using Terraform’s plugin based extensibility, Cisco and HashiCorp have worked together to deliver the ACI Provider for Terraform.

This integrated solution supports more than 90 resources and datasources, combined, which cover all aspects of bringing up and configuring the ACI infrastructure across on-prem, WAN, access, and cloud. Terraform ACI Provider also helps customers optimize network compliance, operations and maintain consistent state across the entire multi-cloud infrastructure. The combined solution also provides customers a path to faster adoption of multi-cloud, automation across their entire infrastructure and support for other ecosystem tools in their environments.

One of the key barriers to entry for network teams to get started with automation is setting up the automation tool and defining the intent of the network through the tool. Terraform addresses these concerns by providing its users a simple workflow to install and get started with. Here are the steps to started with Terraform.

With Terraform installed, let’s dive right into it and start creating some configuration intent on Cisco ACI.

If you don’t have an APIC, you can start by installing the cloud APIC (Application Policy Infrastructure Controller) on AWS and Azure or use Cisco DevNet’s always-on Sandbox for ACI.

Configuration


The set of files used to describe infrastructure in Terraform is simply known as a Terraform configuration. We’re going to write our first configuration now to create a Tenant, VRF, BD (Bridge Domain), Subnet, Application Profile and EPG (Endpoint Groups) on APIC.

The configuration is shown below. You can save the contents to a file named example.tf. Verify that there are no other *.tf files in your directory, since Terraform loads all of them.

Cisco Tutorial and Material, Cisco Guides, Cisco Learning, Cisco Certifications, Cisco Online Exam, Cisco Prep
(Note: This is not a complete policy configuration on APIC)

Provider


The provider block is used to configure the named provider, in our case “aci”. A provider is responsible for creating and managing resources. A provider is a plugin that Terraform uses to translate the API interactions with the service. A provider is responsible for understanding API interactions and exposing resources. Multiple provider blocks can exist if a Terraform configuration is composed of multiple providers, which is a common situation.

Cisco ACI Terraform Provider works for both on-prem and cloud APIC. In addition, it supports both X509 cert based and Password based authentication.

Resources


The resource block defines a resource that exists within the infrastructure.

The resource block has two strings before opening the block: the resource type and the resource name. In our example, the resource type is an ACI object like tenant “aci_tenant” and resource name is “cisco_it_tenant”.

Cisco ACI Provider supports more than 90+ resources and datasources.