Thursday, 23 September 2021

Cisco teams up with Meshtech and launches Application Hosting for brand-new Asset Tracking IoT portfolio

Application Hosting on the Catalyst 9100 series access points allows organizations of all sizes to run IoT applications from the edge. As organizations integrate and deploy IoT services across their networks, the ability to optimize workflows, streamline IoT application changes, and simplify critical processes right out of the box, is essential. This includes having the ability to monitor IoT deployments end-to-end, as well as ongoing device and IoT network management. This is precisely why Cisco is developing integrations with vendors like Meshtech.

Cisco and Meshtech deliver seamless integration

Meshtech, based in Norway, develops IoT solutions that are used in smart buildings, healthcare, transportation, manufacturing, and more. Its portfolio includes a suite of sensors, asset monitoring, and control systems that are used for environmental monitoring, asset tracking, and usage analytics.

Read More: 300-715: Implementing and Configuring Cisco Identity Services Engine (SISE)

With Cisco’s Application Hosting capabilities, Meshtech devices communicate directly with the Cisco Catalyst access point. Application Hosting doesn’t replace the Meshtech application but rather it eliminates the need for additional hardware while adding additional device management features.

IT teams retain the same visibility into key performance indicators across Meshtech sensors including humidity levels, movement, and temperature. With Application Hosting, they gain additional visibility and control on the Cisco platform. This includes the status of IoT devices, placement of sensors, as well as the ability to push application updates. Together, the integrated solution provides advanced visibility, control, and support across the application lifecycle.

Cisco Teams, Cisco Prep, Cisco Tutorial and Materials, Cisco Guides, Cisco Learning, Cisco Career, Cisco Preparation
Meshtech dashboard

How it works


As with all Application Hosting solutions on the Catalyst platform, the solution takes advantage of Docker-style containers to host the application directly on the access point. Further simplifying the solution is its use of industrial Bluetooth Low Energy (BLE). Meshtech’s BLE module makes use of the integrated USB port in the Cisco Catalyst access points to control and manage any of Meshtech’s IoT devices.

Cisco Teams, Cisco Prep, Cisco Tutorial and Materials, Cisco Guides, Cisco Learning, Cisco Career, Cisco Preparation

On the Meshtech side, a containerized version of its management application is hosted on the Cisco Catalyst access point. This allows Meshtech IoT devices communicate and share valuable data while also allowing IT Teams to control actions directly from the Cisco wireless network.

The below diagram showcases the breadth of Meshtech IoT devices supported with Application Hosting on Catalyst Access Points.

Cisco Teams, Cisco Prep, Cisco Tutorial and Materials, Cisco Guides, Cisco Learning, Cisco Career, Cisco Preparation
Meshtech solutions

Easy deployment and management


To summarize, Application Hosting enables the elimination of IoT overlay networks, which simplifies deployments and management while reducing costs. The Cisco Catalyst Access Point does all the heavy lifting by driving the application at the edge. With Application Hosting, there’s no need for additional IoT hardware, installation, or maintenance, everything is integrated.

Tuesday, 21 September 2021

Building a Custom SecureX Orchestration Workflow for Umbrella

Improving efficiency for the Cisco team in the Black Hat USA NOC

As a proud partner of the Black Hat USA NOC, Cisco deployed multiple technologies along with the other Black Hat NOC partners to build a stable and secure network for the conference. We used Cisco Secure Malware Analytics to analyze files and monitor any potential PII leaks. We also used Meraki SM to manage over 300 iPads used around the venue for registration, as well as sales lead generation. Last but not least, we used Umbrella to add DNS level visibility, threat intelligence and protection to the entire network.

Read More: 300-620: Implementing Cisco Application Centric Infrastructure (DCACI)

Lets go over an example scenario which many customers may find themselves in. While we were in the Black Hat USA NOC, we were constantly keeping our eyes on the Umbrella security activity report, in order to recognize, investigate and work with other teams to respond to the threats.

Cisco Prep, Cisco Tutorial and Materials, Cisco Guides, Cisco Learning, Cisco Tutorial and Materials, Cisco Career, Cisco Preparation

Continuously monitoring the activity report can be taxing, especially in our case with two Umbrella organizations – one for the conference iPad deployment and another for the conference attendee network. In comes SecureX to help make our lives simpler. Using SecureX orchestration we were able to import a pre-built Umbrella workflow and easily customize it to suite our needs. This workflow pulls the activity report for a configurable list of categories, creates an incident in SecureX, notifies the team in Webex Teams and updates a SecureX dashboard tile. Let’s jump into SecureX orchestration and take a look at the workflow.

A plethora of SecureX orchestration content is available on our GitHub repo to help you find value in our automation engine in no time. At the link above, you’ll find fully built workflows, as well as building blocks to craft your own use cases. Here is what the 0023 Umbrella: Excessive Requests To Incidents workflow looks like upon importing it (shoutout to @mavander for authoring the workflow).

Cisco Prep, Cisco Tutorial and Materials, Cisco Guides, Cisco Learning, Cisco Tutorial and Materials, Cisco Career, Cisco Preparation

You can see in the variable section there are four variables, three strings and one integer. “Categories to Alert On” is a comma separated list of categories we want to be notified about, which makes it very easy to add or remove categories on the fly. In our case, we want to be notified if there is even one DNS request for any of the Security Categories, which is why we have set the “request threshold” to one.

Cisco Prep, Cisco Tutorial and Materials, Cisco Guides, Cisco Learning, Cisco Tutorial and Materials, Cisco Career, Cisco Preparation

Now that our variables are set, let’s dig into the first web service call that is made to the Umbrella API. Umbrella has three API’s:

◉ The management API
◉ The Investigate API
◉ The reporting API (which is the one we need to use to pull the activity report)

There are often minute differences when authenticating to various API’s, but luckily for us, authenticating to the Umbrella API is built into the workflow. It’s as simple as copying and pasting an API key from Umbrella into orchestration and that its. You’ll notice the Umbrella API key and secret are stored as ‘Account Keys’ in orchestration this way you can reuse the same credentials in other workflows or other API calls to Umbrella.

Cisco Prep, Cisco Tutorial and Materials, Cisco Guides, Cisco Learning, Cisco Tutorial and Materials, Cisco Career, Cisco Preparation

Cisco Prep, Cisco Tutorial and Materials, Cisco Guides, Cisco Learning, Cisco Tutorial and Materials, Cisco Career, Cisco Preparation

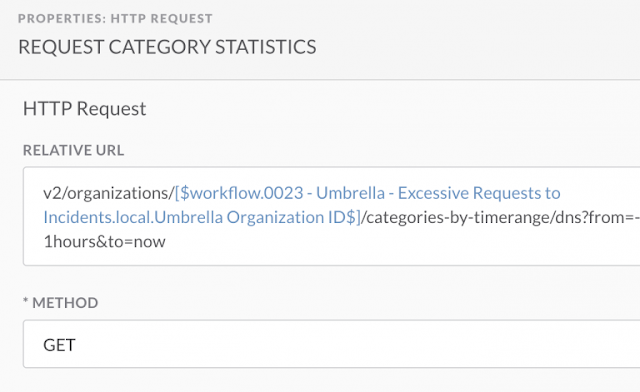
In this case, we are dynamically crafting the URL of /v2/organizations/<umbrella_org_id>/categories-by-timerange/dns?from=-1hours&to=now by using the Umbrella org ID from the variables above. Notice the API call is going to GET an activity report for the past hour, but it could be modified to be more or less frequently.

Cisco Prep, Cisco Tutorial and Materials, Cisco Guides, Cisco Learning, Cisco Tutorial and Materials, Cisco Career, Cisco Preparation

Now that we have a JSON formatted version of the activity report, we can use JSON path query to parse the report and construct a table with the category names and the number of requests. Using this dictionary, we can easily determine if Umbrella has seen one or more requests for a category which we want to alert on.

Cisco Prep, Cisco Tutorial and Materials, Cisco Guides, Cisco Learning, Cisco Tutorial and Materials, Cisco Career, Cisco Preparation

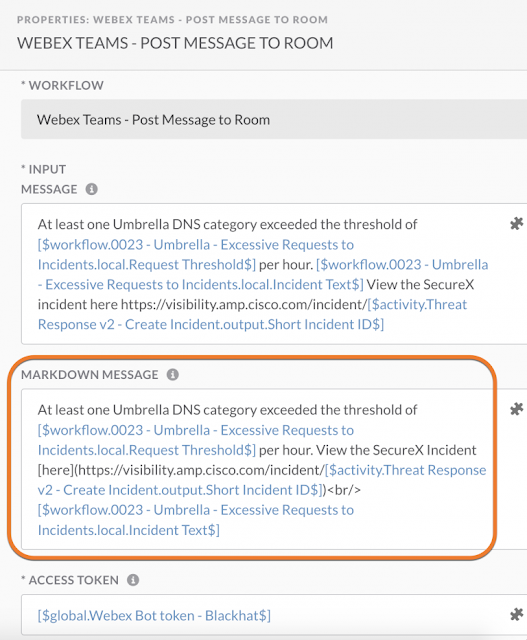
If the conditions are met, and there was activity in Umbrella, the workflow will automatically create a SecureX incident. This incident can be assigned to a team member and investigated in SecureX threat response, to gain additional context from various intelligence sources. However, our team decided that simply creating the SecureX incident was not enough and that a more active form of notification was necessary to ensure nothing got overlooked. Using the pre-built code blocks in SecureX orchestration, we customized the workflow to print a message in Webex teams this way the whole team can be notified and nothing will go unseen.

Cisco Prep, Cisco Tutorial and Materials, Cisco Guides, Cisco Learning, Cisco Tutorial and Materials, Cisco Career, Cisco Preparation

Cisco Prep, Cisco Tutorial and Materials, Cisco Guides, Cisco Learning, Cisco Tutorial and Materials, Cisco Career, Cisco Preparation

Here is what the message looks like in Webex teams. It includes includes the name of the category and how many requests in said category were seen in the past one hour. We scheduled the workflow to run once an hour, so this way even if we needed to step away to walk the Black Hat floor or meet with a NOC partner, we can still stay abreast to the latest Umbrella detections.

Cisco Prep, Cisco Tutorial and Materials, Cisco Guides, Cisco Learning, Cisco Tutorial and Materials, Cisco Career, Cisco Preparation

It also includes a hyperlink to the SecureX incident to make the next step of conducting an investigation easier. Using SecureX threat response we can investigate any domains detected by umbrella to get reputational data from multiple intelligence sources. In this particular example www.tqlkg[.]com showed up as ‘potentially harmful’ in the Umbrella activity report. The results of the threat response investigation show dispositions from 5 different sources including a suspicious disposition from both Talos and Cyberprotect. We can also see that the domain resolves to 6 other suspicious URLs. In a future version of this workflow this step could be automated using the SecureX API’s.

Cisco Prep, Cisco Tutorial and Materials, Cisco Guides, Cisco Learning, Cisco Tutorial and Materials, Cisco Career, Cisco Preparation

In addition to the Webex teams alert, we created a tile for notification the SecureX dashboard, which is on display for the entire NOC floor to view.

Cisco Prep, Cisco Tutorial and Materials, Cisco Guides, Cisco Learning, Cisco Tutorial and Materials, Cisco Career, Cisco Preparation

You can see in the dashboard high level statistics, which are provided from Secure Malware Analytics (Threat Grid) including “top behavioral indicators”, “submissions by threat score” “submissions by file type” as well as the “request summary” from Umbrella.

Also notice the “private intelligence” tile – this is where you can see if there were any new incidents created by the orchestration workflow. The SecureX dashboard keeps the entire Black Hat NOC well-informed as to how Cisco Secure’s portfolio is operating in the network. Adding tiles to create a custom dashboard can be done in just a few clicks. In the customize menu you will see all the integrated technologies that provide tiles to the dashboard.  Under the “private intelligence” section you can see the option to add the ‘Incident statuses and assignees’ tile to the dashboard – it’s that easy to create a customized dashboard!

Cisco Prep, Cisco Tutorial and Materials, Cisco Guides, Cisco Learning, Cisco Tutorial and Materials, Cisco Career, Cisco Preparation

I hope you enjoyed this edition of SecureX at Black Hat; and stay tuned for the next version of the workflow on GitHub, that will automatically conduct an investigation of suspicious domains and provide intelligence context directly in the Webex teams message.

Thursday, 16 September 2021

Wireless Catalyst 9800 troubleshooting features and improvements

The adoption of new Catalyst 9800 not only brought new ways to configure Wireless Controllers, but also several new mechanisms to troubleshoot them. It has some awesome troubleshooting features that will help to identify root causes faster spending less time and effort.

There are several new key troubleshooting differentiators compared to previous WLC models:

◉ Trace-on-failure: Summary of detected failures

◉ Always-on-tracing: Events continuously stored without having to enable debugging

◉ Radioactive-traces: More detailed debugging logs filtered per mac, or IP address

◉ Embedded Packet capture: Perform filtered packet captures in the device itself

◉ Archive logs: Collect stored logs from all processes

Let me present you the different features through a real reported wireless problem: a typical “client connectivity issue”, showing how to use them to do root cause analysis, while following a systematic approach.

Let’s start by a user reporting wireless client connectivity issue. He was kind to provide the client mac address and timestamp for the problem, so scope starts already partially delimited.

First feature that I would use to troubleshoot is the Trace-on-failure. The Catalyst 9800 can keep track of predefined failure conditions and show the number of events per each one, with details about failed events. This feature allows to be proactive and detect issues that could be occurring in our network even without clients reporting them. There is nothing required for this feature to work, it is continuously working in the background without the need of any debug command.

How to collect Trace-on-failure:

◉ show wireless stats trace-on-failure.

Show different failure conditions detected and number of events.

◉ show logging profile wireless start last 2 days trace-on-failure

Show failure conditions detected and details about event. Example:

     9800wlc# show logging profile wireless start last 2 days trace-on-failure 

     Load for five secs: 0%/0%; one minute: 1%; five minutes: 1%

     Time source is NTP, 20:50:30.872 CEST Wed Aug 4 2021

     Logging display requested on 2021/08/04 20:50:30 (CEST) for Hostname: [eWLC], Model: [C9800-CL-K9], Version: [17.03.03], SN: [9IKUJETLDLY], MD_SN: [9IKUJETLDLY]

     Displaying logs from the last 2 days, 0 hours, 0 minutes, 0 seconds

     executing cmd on chassis 1 ...

     Large message of size [32273]. Tracelog will be suppressed.

     Large message of size [32258]. Tracelog will be suppressed.

     Time                           UUID                 Log

     ----------------------------------------------------------------------------------------------------

      2021/08/04 06:32:45.763075     0x1000000e37c92     f018.985d.3d67 CLIENT_STAGE_TIMEOUT State = WEBAUTH_REQUIRED, WLAN profile = CWA-TEST2, Policy profile = flex_vlan4_cwa, AP name = ap3800i-r3-sw2-Gi1-0-35

Tip: To just focus on failures impacting our setup we can filter output by removing failures that have no events. We also can monitor statistics to check failures increasing and its pace. Following command can be used:

◉ show wireless stats trace-on-failure | ex  : 0$

With those commands we can identify which are the failure events detected in the last few day by the controller, and check if there is any reported event for client mac and timestamp provided by the user.

In case that there is no event for user reported issue or we need more details I would use the next feature, Always-on-tracing.

The Catalyst 9800 is continuously logging control plane events per process into a memory buffer, copying them to disk regularly. Each process logs can span several days, even in the case of a fully controller.

This feature allows to check events that have occurred in the past even without having any debugs enabled. This can be very useful to get context and actions that caused a client or AP disconnections, to check client roaming patterns, or the SSIDs where client had connected. This is a huge advantage if we compare with previous platforms where we had to enable “debug client” command after issue occurred and wait for next occurrence.

Always-on-tracing can be used to check past events for clients, APs or any wireless related process. We can collect all events for wireless profile or filter by concrete client or AP mac address. By default, command is showing last 10 minutes, and output is displayed in the terminal, but we can specify start/end time selecting date from where we want to have logs and we can store them into a file.

How to collect Always-on-tracing:

◉ show logging profile wireless

Show last 10minutes of all wireless involved process in WLC terminal

◉ show logging profile wireless start last 24 hours filter mac MAC-ADDRESS to-file bootflash:CLIENT_LOG.txt

Show events for specific client/AP mac address in the last 24 hours and stores results into a file.

With these commands and since we know the client mac address and timestamp for the issue, we can collect logs for the corresponding point in the past. I always try to get logs starting sometime before the issue so I can find what client was doing before problem occurred.

The Catalyst 9800 has several logging levels details. Always-on-tracing is storing at “info” level events. We can enable higher logging levels if required, like notice, debugging, or even verbose per process or for group of processes. Higher levels will generate more events and reduce the total overall period of time that can be logged for that process.

In case we couldn’t identify root cause with previously collected data and need more in-depth information of all processes and actions I would use the next feature Radioactive-traces.

This feature avoids the need to manually increase logging level per process and will increase level of logging per different processes involved when a concrete set of specified mac or ip addresses transverses the system. It will return logging level back to “info” once it is finished.

Radioactive-traces needs to be enabled before issue occur and will require we wait for next event to collect the data, behaving like the old “debug client” present in legacy controllers. This will be one “One Stop Shop” to do in-depth troubleshooting for multiple issues, like client related problems, APs, mobility, radius, etc, and avoid having to enable a list of different debug commands for each scenario. By default, it will provide logging level “notice” but the keyword “internal” can be added to provide additional logging level details intended for development to troubleshoot.

How to collect Radioactive-traces:

◉ CLI Method 1:

     show platform condition

     clear platform condition all

     debug platform condition feature wireless mac dead.beaf.dead

     debug platform condition start

Reproduce issue

     debug platform condition stop

     show logging profile wireless filter mac dead.beaf.dead to-file File.log

If needed more details for engineering

     show logging profile wireless internal filter mac dead.beaf.dead to-file File.log

◉ CLI Method 2: Script doing same steps as Method 1, automatically starting traces for next 30 minutes. Time is configurable.

      debug wireless mac MAC@ [internal]

Reproduce issue

     no debug wireless mac MAC@ [internal]

It will generate ra_trace file in bootflash with date and mac address.

     dir bootflash: | i ra_trace

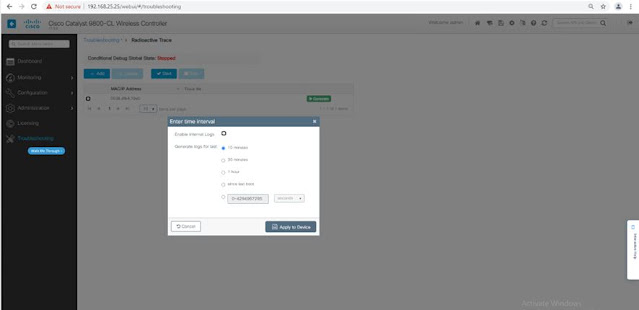
◉ This can also be enabled through GUI, in the troubleshooting section:

Cisco Prep, Cisco Tutorial and Material, Cisco Learning, Cisco Preparation, Cisco Career, Cisco Study Materials

Or, directly from the client monitoring:

Cisco Prep, Cisco Tutorial and Material, Cisco Learning, Cisco Preparation, Cisco Career, Cisco Study Materials

Tip1: When I need to enable Radioactive-traces I follow these rules:

◉ If issue is consistently reproducible, I use CLI Method 2 since it is faster to type and easy to remember.

◉ If issue is not consistently reproducible, I use CLI Method 1 since it allows to start debugging and wait until issue occurs to stop and collect data.

◉ If I suspect that issue is a bug and will need to involve developers, or issue is infrequently observed I collect logs with internal keyword.

Tip2: We can have “realtime” logs in WLC terminal, similar to “debug client” in previous platforms by enabling Radioactive-traces, and using following command to print outputs in terminal:

◉ monitor log profile wireless level notice filter mac MAC-ADDRESS

The current controller terminal would be just showing outputs, and will not allow to type or execute any command until we exit from monitoring logs by executing “Control+C”.

With the information collected in Radioactive-traces it should be possible to identify root cause for most of the scenarios. Generally, we will stop at this point for our user reporting client connectivity issues.

For complex issues I usually combine Radioactive-traces with the next feature, Embedded Packet captures. This is a feature that as a “geek” I really love. It can not only be used for troubleshooting, but also to understand how a feature works, or which kind of traffic is transmitted and received by client, AP or WLC. Since I am familiar with packet capture analysis I prefer to first check packet capture, identify point where failure occurs, and then focus on that point in the logs.

The Catalyst 9800 controller can collect packet captures from itself and is able to filter by client mac address, ACL, interface, or type of traffic. Embedded Packet captures allows to capture packets in data-plane, or in control-plane allowing to check if packet is received by device but not punted to the CPU. We can easily collect and download filtered packet captures from the controller and get all details about packets transmitted and received by it for a concrete client or AP.

How to collect Embedded Packet captures:

◉ CLI Method:
    
     monitor capture MYCAP clear

     monitor capture MYCAP interface Po1 both

     monitor capture MYCAP buffer size 100

     monitor capture MYCAP match any

     monitor capture MYCAP inner mac MAC-ADDRESS

Inner filter available after 17.1.1s

     monitor capture MYCAP access-list CAP-FILTER

Apply ACL filter in case is needed

     monitor capture MYCAP start

Reproduce

     monitor capture MYCAP stop

     monitor capture export flash:|tftp:|http:…/filename.pcap

◉ This can also be enabled through GUI, in the troubleshooting section:
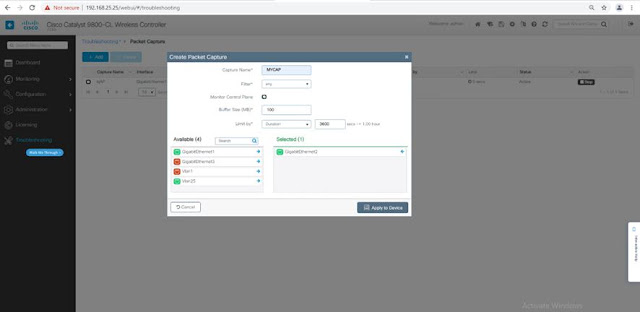
Cisco Prep, Cisco Tutorial and Material, Cisco Learning, Cisco Preparation, Cisco Career, Cisco Study Materials

Tip: If we don’t have any ftp/tftp/scp/sftp server to copy the capture it can be saved into harddisk or bootflash and retrieve it from WLC GUI using File Manager.

Cisco Prep, Cisco Tutorial and Material, Cisco Learning, Cisco Preparation, Cisco Career, Cisco Study Materials

For our client connectivity issue collecting the packet captures with radioactive-traces will help us to recognize if any of the fields in headers/payloads of packets collected is causing the issue, identify delays in transmission or reception of packets, or to focus in the phase where issue is seen: association, authentication, ip learning, …

In case issue could be related to interaction of different process, or different clients we can collect logs for profile wireless instead of filtering by mac address. Another available option is to collect logs for a concrete process we suspect could be causing the issue. Since 9800 is storing the logs for all processes we can gather and view the different logs saved in the WLC until they rotate. Log files are stored as binary files and WLC will decode those logs and display them on terminal or copy them into a file. Getting logs from concrete process can be done with command:

◉ show logging process PROCESS_NAME start last boot

The Catalyst 9800 has a feature called Archived logs that will archive every stored log for different processes providing details of what happened to each of the device’s processes. File generated by Archived logs has binary log files and needs to be decoded using tool to convert binary to text once exported, this is intended to be used by Cisco’s support personnel.

How to collect Archived logs:

◉ request platform software trace archive last 10 days target bootflash:DeviceLogsfrom02082021

This will generate a binary file with all logs from last 10 days.

Archived logs are last resource and intended for engineering use due to the amount of data generated. Usually is requested when complete data is needed to identify root cause, and it is used to troubleshoot issues related to WLC itself, and not to a particular client or AP.

In our case regarding client connectivity issues, I would collect profile wireless logs to check if other clients could be impacted at the same time, and if we could see error logs in a concrete process. And only collect Archived logs if requested by development.

Tuesday, 14 September 2021

Cisco 64G Module: Enabling The Most Power Efficient SANs

Cisco 64G Module, Cisco Prep, Cisco Preparation, Cisco Guides, Cisco Learning, Cisco Exam Prep

The need for speed and sustainability

With the ever growing amount of data every organization manages, there is an associated need for a higher data retrieval speed, as demanded by Business Intelligence and Artificial Intelligence applications. Hence, the introduction of 64G Fibre Channel support on storage networking devices appears as a no brainer, especially when used in combination with the performance-optimized NVMe/FC protocol.

Read More: 352-001: CCDE Design Written Exam (CCDE)

At the same time, we are living in a context where sustainability efforts are mounting and pressing for power efficient solutions that can deliver more bandwidth at a reduced wattage.

Designing a power efficient SAN

Eight years ago Cisco launched the MDS 9700 family of mission critical directors with 16G switching modules. In 2017, green initiatives and power saving efforts became front and center, as reflected in the design of the 32G switching module and its major step forward in that direction. Continuing on the same path, the recently introduced 48 ports 64G switching module can really be described as a breakthrough technological epiphany. It provides 4 times the bandwidth of the original 16G switching module and shaves power consumption by approximately 40%, making it about 7 times more power efficient than its predecessor.

Cisco 64G Module, Cisco Prep, Cisco Preparation, Cisco Guides, Cisco Learning, Cisco Exam Prep

In combination with the highly efficient 80Plus platinum certified power supplies and the power-reduced chassis infrastructure elements, namely supervisor Sup-4 and crossbar fabric unit Fab-3, the new 64G switching module makes Cisco MDS 9700 directors the ideal choice for designing the most power efficient SANs.

New ASIC, new capabilities


This achievement is the result of a painstaking work to optimize both the physical footprint and power envelope of the new F64 switching ASIC, sitting inside the 64G switching module. This dual-die chipset can switch traffic for all the 48 ports at full line rate, freeing up space on the module motherboard.

The F64 ASIC incorporates numerous port counters and an efficient rate limiter, offering a combination of advanced congestion detection and mitigation techniques. This way the high-speed ports do not go underutilized due to roadblocks in the fabric.

Also, the entire switching module design was revisited to minimize latency, accommodate low energy components, and facilitate cooling.

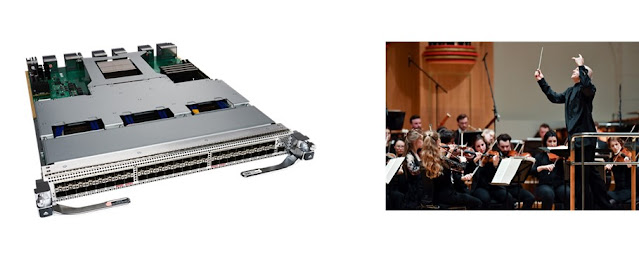
Experiencing the full symphony


It is not unusual that the front-face of a high port count Fibre Channel switching module resembles an extra-long mouth-organ, but it is when you slide it inside an MDS 9700 chassis that you can appreciate the full symphony. Full line rate switching at 64G on all ports with no oversubscription, massive allocation of buffer to buffer credits for longer distances, traffic encryption for secure data transfer over ISLs, popular enterprise-class features like VSANs and PortChannels, hardware-assisted congestion prevention and mitigation solutions, including Dynamic Ingress Rate Limiting (DIRL) and Fabric Performance Impact Notification (FPIN) and Congestion Signals. All of that with a typical power consumption of only 300 Watts or 240W when operated at 64G or 32G respectively.

Cisco 64G Module, Cisco Prep, Cisco Preparation, Cisco Guides, Cisco Learning, Cisco Exam Prep

SAN Analytics on steroids


The low power consumption appears even more impressive when you consider that the 64G switching module comes with a dedicated onboard Network Processing Unit (NPU). It complements the ASIC-assisted metric computation and adds flexibility to the widely popular SAN Analytics capability of MDS 9000 switches.

The new 64G switching module raises the bar once again in terms of deep and granular traffic visibility. It uses an improved lens for frame headers inspection. It offers the capability to recognize VM-level identifiers. It provides a more refined analysis and correlation engine.

The presence of a dedicated 1G port on the switching module for streaming the telemetry data makes sure the scalability of the SAN Analytics feature can go beyond what is possible on the 32G modules. This is unrivalled, both in terms of self-discovered I/O Fibre Channel flows and computed metrics. Specific optimizations for a better handling of NVMe/FC traffic will also see the light when the SAN Analytics feature becomes available on this linecard.

Investment Protection


Investment protection is always good news for customers and the new 64G switching module excels in this area. It is supported inside Cisco MDS 9706, MDS 9710 and MDS 9718 mission critical directors. It can coexist and interoperate with previous generation of linecards, in any of these chassis. Existing MDS 9700 customers can decide to upgrade their install base to 64G speed without any service interruption. They can even migrate old SFPs to the new switching module, for those ports that do not need to be operated at 64G. This is what we call real investment protection.

At Cisco we are very proud of what our talented engineering team has been able to realize with this new 64G switching module. We hope you will feel the same when turning up the traffic volume in your SAN.

Sunday, 12 September 2021

Multi-tier automation and orchestration with Cisco ACI, F5 BIG-IP and Red Hat Ansible

It was 2015 when F5 released its first modules to automate tasks related to their BIG-IP Platform. F5 supported Ansible collections, leveraging their IMPERATIVE REST API, consisting of more than 170 modules today. As with almost every major IT initiative today, the Data Center infrastructure automation landscape has changed where alignment between IT and business needs is required faster than ever before. Infrastructure teams are expected to work closely with their business stakeholders to empower them and decrease time to market. These requirements come with its own set of challenges. Cisco and F5 have been working closely to help their joint BIG-IP & ACI customers in their digital transformation, with the help of Ansible and F5’s BIG-IP Automation Toolchain (ATC). These capabilities, incorporated in our jointly announced solution F5 ACI ServiceCenter App, have made it easier to consume F5 BIG-IP application services while decreasing the dependency on L4-L7 domain operations skillset. There is solid evidence for this. We’re continually working to make it easier for non-automation experts to leverage both BIG-IP and ACI.

It’s simple to realize that lowering the barriers to use of technology, fosters much broader adoption. The two aspects namely, complexity and adoption are inextricably linked but often overlooked by many product managers and development teams to achieve functionality goals. In an increasingly DevOps oriented world, there are true benefits of Ansible based automation to avail, when it’s able to augment operational knowledge that was mostly the precinct of NetOps personnel.

Automating an end-to-end workflow

Our goal in context of Cisco ACI is to use Ansible to automate an end-to-end workflow which can be broken down into following tasks: (a) performing L2-L3 stitching between the Cisco ACI fabric and F5’s BIG-IP; (b) configuring the network on the BIG-IP; (c) deploying an application on BIG-IP and (d) automating elastic workload commission/decommission. In our joint solution, we’ve used Red Hat® Ansible® Tower to execute all these tasks. Ansible Tower helps scale IT automation, manage complex deployments and speed productivity, and so it’s well suited and effective. By centralizing control of IT infrastructure with a visual dashboard, role-based access control, job scheduling, integrated notifications, and graphical inventory management, it’s easy to see why we choose to embed Ansible into our approach and suggest its value-props to our joint BIG-IP & ACI customers.

Cisco Preparation, Cisco Learning, Cisco Guides, Cisco Tutorial and Materials, Cisco Career, Cisco Prep
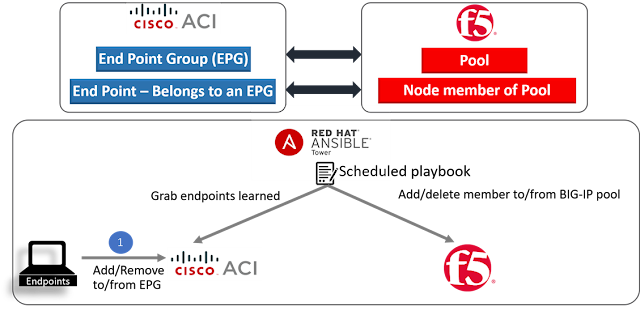
Figure-1: Automating an end-to-end workflow

Specifically, the Ansible Tower workflow template we’ve created allows ACI and BIG-IP configuration automation playbooks for L4-7 constructs without VLAN information passed. The APIC L4-L7 constructs can configure Service Graph in applied state. In our digital age, the need to increase an application workload has become much more frequent in handling increases and decreases in traffic to that application.

A real-world example of a service provider who wants to run a website will help illustrate the point. At the start of the day, let’s say, the website is unpopular, and a single machine (most commonly a virtual machine) is sufficient to serve all web users. A hosted client has event tickets go on sale at mid-morning, the website suddenly becomes VERY popular, and a single machine is no longer sufficient to serve all users. Based on the number of web users simultaneously accessing the site and the resource requirements of the web server, requirements may go up such that ten or, so machines are needed. At this point, nine additional machines (virtual machines) are bought online to serve all web users responsively. These additional nine web servers also need to be added to the BIG-IP pool so that the traffic can be load balanced

By late evening, the website traffic slows. The ten machines that are currently allocated to the website are mostly idle and a single machine would be sufficient to serve the fewer users who access the website. The additional nine machines can be deprovisioned and repurposed for some other need. In the ACI world when an application workload is added, it is learned by the ACI fabric and becomes a part of an Endpoint Group on the ACI fabric. In the BIG-IP world that workload corresponds to the members of the load balanced pool. In other words, Endpoint group on APIC = Pool on the BIG-IP and Endpoints in an endpoint group = Pool members on the BIG-IP (application servers handling traffic). When workload is commissioned/decommissioned it needs to also be added/deleted to a pool member on the BIG-IP. We can easily use Ansible to automate the process, as it excels at configuration management, adjusts to address components, and optimize the environment through automating Virtual-Servers, Pools, Monitors, and other configuration objects to achieve such a service provider’s operational goals.

Cisco Preparation, Cisco Learning, Cisco Guides, Cisco Tutorial and Materials, Cisco Career, Cisco Prep
Figure-2: Automating Dynamic end points
 

Using Ansible to automate a BIG-IP and Cisco ACI environment


With applications transitioning into the cloud, and organizations embracing application agility, automating infrastructure and application deployment are essential to ensure that businesses stay ahead. It’s a shared goal of F5 and Cisco, to address our customer’s pressing need to make programmability and automation inherent parts of their operational IT processes. Ansible provides BIG-IP and ACI users a simple, yet powerful, multi-tier automation and orchestration platform. It can help organizations like yours, centralize and accelerate policy driven, application deployment lifecycles, while decreasing the amount of domain knowledge required.

Take a closer look at how to use Ansible to automate a BIG-IP and Cisco ACI environment by using the lab we built with Cisco on their dCloud platform. More that 4000 of our ‘hands on’ labs have been run since we built it 14 months ago. We’re sure you’ll find value in it too because it’s really all about automation…. really!

Source: cisco.com

Saturday, 11 September 2021

Introducing Success Track for Data Center Network

Cisco Prep, Cisco Preparation, Cisco Tutorial and Material, Cisco Learning, Cisco Guides, Cisco Career, Cisco Data Network

The pace of digital transformation has accelerated. In the past year and a half, business models have changed, and there is a need for enterprises to quickly improve the time taken to launch new products or services. The economic uncertainty has forced enterprises to reduce their overall spending and focus more on improving their operational efficiencies. As the pandemic has changed the way the world does business, organizations have been quick to pivot to digital mediums, as their survival depends on it. The results of a Gartner survey published in November 2020, highlights this rapid shift. 76% of CIOs reported increased demand for new digital products and services and 83% expected that to increase further in 2021, according to the Gartner CIO Agenda 2021.

Today, more than ever, IT operations are being asked to manage complex IT infrastructure. This when coupled with rising volumes of data, makes the task of IT teams more difficult to manage today’s dynamic, constantly changing data center environments. Automation is clearly the need of the hour and automation enabled by AI will play a huge role. Hyperscalers are leading the way in using AI for IT operations and are increasingly setting the trend that will see AI being embedded in every component of IT. Powered by AI, hyperscalers are quickly defining the future of IT– from self-healing infrastructure to databases that can recover quickly in the event of a failure or networks that can automatically configure and re-configure without any human intervention.

Cisco Application Centric Infrastructure (ACI) is a software-defined networking (SDN) solution designed for data centers. Cisco ACI allows network infrastructure to be defined based upon network policies and facilitates automated network provisioning – simplifying, optimizing, and accelerating the application deployment lifecycle.

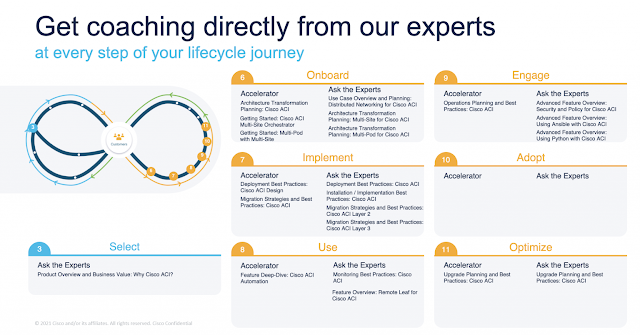
To minimize the effort of managing your data center networks, Cisco has created Success Track for Data Center Network, a new innovative service offering. We want to help you simplify and remove roadblocks. Success Tracks provides coaching and insights at every step of your lifecycle journey.

Cisco Prep, Cisco Preparation, Cisco Tutorial and Material, Cisco Learning, Cisco Guides, Cisco Career, Cisco Data Network

Success Track for Data Center Network provides a one stop digital platform called CX Cloud.

The CX Cloud is your digital connection to access Cisco specialists and customized resources to help you simplify solution adoption and resolve issues faster. This is a new way of engaging with us, bringing together connected services—expertise, insights, learning, and support all in one place with a personalized, use-case driven solutions approach.

CX Cloud gives you contextual guidance for three data center networking (ACI) use cases: Network provisioning and operations, Network automation and programmability and Distributed networking.

The number one issue that we have heard about is that most next generation data centers (based on SDN) are complex and difficult to deploy. All three Success Track use cases will help simplify your network management and operations so you can serve the business more efficiently.

Take network provisioning and operations for example. A box by box, element by element management approach does not scale nor give the confidence for consistency required in today’s fast moving IT organizations.

By using the embedded tools built into the Application Policy Infrastructure Controller (or APIC) we demonstrate how to get a single point of automation, orchestration, and troubleshooting that will simplify data center network management and operations for Days 0, 1, and beyond.

To achieve these benefits, it is critical that a strong foundation be built on such a simple management infrastructure such as ACI’s single pane of glass tools.

Success Track for Data Center Network is a suite of use case guided service solutions designed to help you realize the full value of your ACI deployment, faster. This holistic service digitally connects you through CX Cloud to the right expertise, learning and insights at the right time to accelerate success.

Cisco Prep, Cisco Preparation, Cisco Tutorial and Material, Cisco Learning, Cisco Guides, Cisco Career, Cisco Data Network
Get access to experts, on-demand learning, Cisco community, and product documentation on our CX Cloud Portal.

Customers can simplify data center network deployment and operations through access to experts, embedded tools, and a unified digital platform. This results in greater efficiencies, cost savings and a reduction of errors.

If you are looking for a consistent onboarding of network infrastructure, expedited workload provisioning to network fabric, and improved monitoring and insights, Cisco Success Track for Data Center Network will help you get there.

Thursday, 9 September 2021

Simplified Insertion of Cisco Secure Firewall with AWS Route Table Enhancement

Cisco Secure Firewall provides industry-leading firewall capabilities for Amazon Virtual Private Cloud (VPC)and resources deployed inside. Customers use these firewalls to protect north-south and east-west traffic.

Typically, we provide north-south traffic inspection in AWS infrastructure by deploying a load balancer and adding firewalls behind it. Another approach uses Amazon VPC Ingress Routing to steer traffic to Cisco Secure Firewalls.

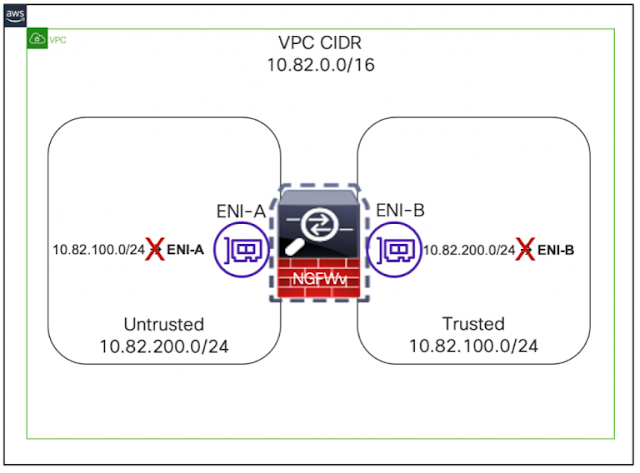
Since the AWS VPC Ingress Routing feature launched, we’ve waited for a similar feature for east-west traffic inspection, as a route in a routing table couldn’t be more specific than the default local route. Figure 1 below illustrates when the VPC range is 10.82.0.0/16, it is impossible to add a more specific route for 10.82.100.0/24 & 10.82.200.0/24.

Cisco Secure Firewall, Cisco Security, Cisco Learning, Cisco Career, Cisco Guides, Cisco Learning, Cisco Preparation, Cisco Study Material
Figure 1 – Cisco Secure Firewall in Amazon VPC (more specific route not allowed)

However, as of today, AWS launched a new feature that enables adding a more specific route in the Amazon Route Table. This feature provides functionality to send and inspect traffic between subnets in a VPC, as shown in Figure 2 below.

Cisco Secure Firewall, Cisco Security, Cisco Learning, Cisco Career, Cisco Guides, Cisco Learning, Cisco Preparation, Cisco Study Material
Figure 2 – Cisco Secure Firewall in Amazon VPC (more specific route allowed)
 
The route table in Figure 3 is associated with a trusted subnet and has a route for an untrusted subnet pointing to the trusted interface (Elastic Network Interface – ENI-B) of the Cisco Secure Firewall.

Cisco Secure Firewall, Cisco Security, Cisco Learning, Cisco Career, Cisco Guides, Cisco Learning, Cisco Preparation, Cisco Study Material
Figure 3- AWS Route Table Associated with Trusted Subnet

The route table in Figure 4 is associated with an untrusted subnet and it has a route for trusted subnet pointing to the untrusted interface (ENI-A) of the Cisco Secure Firewall.

Cisco Secure Firewall, Cisco Security, Cisco Learning, Cisco Career, Cisco Guides, Cisco Learning, Cisco Preparation, Cisco Study Material
Figure 4- AWS Route Table Associated with Untrusted Subnet