Tuesday, 30 January 2024

How Life-Cycle Services Can Help Drive Business Outcomes

How Life-Cycle Services Can Help Drive Business Outcomes

For most organizations, the journey to a digital-first business is not yet complete. While many have implemented new technologies to enable digital capabilities across the business, modernizing IT infrastructure and applications requires ongoing planning and investment. In fact, a recent IDC survey found that 49% of respondents identified their organization as only “somewhat digital,” with many in the process of transforming portions of the business to digital. With so much transformation still required, many CIOs and IT managers are prioritizing projects that will help drive new digital-first business models.

Unfortunately, while technology innovations promise to deliver significant results for business managers, the reality of implementation and adoption is often very different. CIOs and IT managers are increasingly tasked with not just deploying and integrating these complex solutions, but with delivering specific, measurable business outcomes to key stakeholders across the organization. IDC surveys show that most organizations continue to prioritize strategies focused on improved customer and employee experiences, better operational efficiencies, achieving sustainability goals, and expanding products into new markets. Delivering critical insights to business managers to enable real-time data analysis and decision-making is key to driving these strategies. While the specific business outcomes vary by industry and region, they are united by one common thread: they are all driven by technology.

Conversations with CIOs and IT managers reveal that a critical and difficult first step is making sure IT objectives and KPIs can be aligned with measurable, specific business outcomes across the organization. Aligning IT and business strategies has long been a goal, but managing a digital-first business to achieve desired outcomes across the organization has increased its importance. Such alignment is a difficult challenge for IT organizations that often lack the skills and resources for this exercise. Business managers also struggle to understand underlying IT infrastructure, further complicating the process of aligning strategic outcomes across IT and the digital-first business.

To help, services partners are offering comprehensive portfolios of outcomes-driven, life-cycle services designed to help customers align technology, operational, and business outcomes to accelerate value realization. These services are typically featured in packages that include planning and advisory, implementation and deployment, adoption and ongoing optimization, and support and training. IDC believes life-cycle services partners committed to demonstrating the value of technology for a digital business should incorporate the following capabilities:

  • Early emphasis on defining desired technical, operational, and business outcomes with required stakeholders across the organization.
  • Developed methodologies that can help align technology implementations and operational outcomes with business goals by establishing key performance indicators and objective metrics for tracking progress.
  • Highly skilled talent with the right mix of business, technology skills, and certifications on new and emerging technologies across IT and network solutions, with continuous engagement throughout the life cycle.
  • Ongoing monitoring and reporting through dashboards that clearly demonstrate how the IT organization is leveraging technology to meet the needs of business managers.
  • Extensive technology-driven capabilities that can help meet key risk management objectives, both as part of technology implementations and ongoing operations.

In addition, CIOs should ensure that services partners can demonstrate an integrated approach to identifying, measuring, and monitoring key technology, operational, and business KPIs throughout the life cycle. While most organizations focus on implementation and onboarding, the value of most technology solutions is delivered well after the initial project is complete. Life-cycle services partners should be able to identify and track key objectives that demonstrate ongoing adoption and optimization to ensure organizations are realizing the full value of technology solutions.

Not surprisingly, IDC research shows that organizations are seeing a number of benefits by using life-cycle services partners focused on achieving customer success. Respondents in a recent IDC survey highlighted the following:

  • 40% reported improving the overall performance of the solution.
  • 40% were able to deliver more value to business managers.
  • 38% indicated they adopted new implementations faster.
  • 36% reported expanding adoption to improve business results.

For CIOs looking to transform the IT organization from a cost center to an “innovation driver” across the business, these benefits are critical to realizing the promise of complex technology solutions. Life-cycle services partners with proven processes and methodologies connecting technology, operational, and business outcomes can help resource-strapped IT organizations demonstrate the full value of technology innovations and drive direct, tangible business results. IDC believes life-cycle services partners who can demonstrate these capabilities are well-positioned to help organizations seeking to drive faster adoption while delivering the desired outcomes across the business.

Source: cisco.com

Saturday, 27 January 2024

Improving Audience Understanding and Store Operations with EVERYANGLE and Meraki

Understanding how to best serve customers is a primary focus for retailers. However, gaining this understanding can be complex. Retailers need to know what their customers are buying, when they’re buying it, and their feelings while shopping. Stationing staff members in the store to gauge customer reactions is not an efficient solution. This is where Meraki and EVERYANGLE come into play, enhancing the customer-focused daily operations of the Cisco Store.

The MV12 and MV63 are directional cameras. The indoor MV12 offers a choice of a wide or narrow Field of View (FoV) and provides intelligent object and motion detection, analytics, and easy operation via the Meraki dashboard. The outdoor MV63 monitors the entrances and exits of the store.

Meanwhile, the MV32 and MV93 are 360° fish-eye cameras. The indoor MV32 combines an immersive de-warped FoV with intelligent object detection and streamlined operation via the Meraki dashboard, in addition to addressing major security vulnerabilities. The outdoor MV93 offers panoramic wide area coverage, enhancing surveillance capabilities even in low light.

The data from these Meraki cameras is utilized by EVERYANGLE in the Cisco Store in various ways.

Footfall Intelligence and Customer Demographics


A challenge for physical stores is obtaining metrics comparable to online stores, making it difficult to tailor the retail experience effectively. EVERYANGLE’s technology levels the playing field for physical retailers.

EVERYANGLE uses data from the directional cameras MV12 and MV63 to help the Cisco Store better understand its visitors. The Next Generation Footfall App breaks down customer genders and ages, monitors their satisfaction levels post-visit, and tracks the time spent in various store sections. For example, data from a Cisco Live event revealed a 50:50 male to female customer ratio, contrary to the expected 60:40, leading to adjustments in the Store’s product range.

EVERYANGLE determines purchase conversion rates at physical locations by analyzing integrated sales data and foot traffic. Their machine learning and AI algorithms provide 95% accurate customer insights. Staff members are automatically excluded from these insights, ensuring data accuracy. 

EVERYANGLE’s True Customer Identification accurately distinguishes genuine shoppers from non-customers. This empowers retailers with precise customer data, crucial for targeted strategies and store optimization, ensuring decisions reflect real customer activity.

Improving Audience Understanding and Store Operations with EVERYANGLE and Meraki

The Cisco Store can thus easily gauge customer demographics, engagement, and group dynamics without a heavy in-store staff presence, adjusting displays and marketing tactics accordingly. Fortunately, we have seen an increase in positive sentiment from when customers enter the Cisco Store to when they exit!

Footfall Intelligence 

Improving Audience Understanding and Store Operations with EVERYANGLE and Meraki

Customer Demographic Breakdown

Improving Audience Understanding and Store Operations with EVERYANGLE and Meraki

Improving Audience Understanding and Store Operations with EVERYANGLE and Meraki

Queue Counting and Dwell Times


This data is used to maintain smooth store operations and continuously improve performance. The fish-eye cameras MV32 and MV93 are used to monitor the checkout lines: a threshold on the queue count allows for staff adjustment at checkouts as needed. If people spend a comparatively longer time at certain stations, we can begin to understand if that longer dwell time means more sales of those specific products.

Improving Audience Understanding and Store Operations with EVERYANGLE and Meraki

In-Store Security


Meraki’s people detection capabilities, integrated with EVERYANGLE, help the Cisco Store maintain top-notch security. Cameras, integrated with the point of sale (POS) system, anonymously track high-value purchases and returns, aiding in fraud prevention. 

Meraki and EVERYANGLE enable the Cisco Store to better understand its customers and serve them effectively, prioritizing their security and privacy. The analytics and dashboards facilitate customer service improvement, ensuring customers leave with a positive shopping experience.

Source: cisco.com

Thursday, 25 January 2024

Maximizing Operational Efficiency: Introducing our New Smart Agent Management for Cisco AppDynamics

Maximizing Operational Efficiency: Introducing our New Smart Agent Management for Cisco AppDynamics

Application performance monitoring (APM) remains a key pillar of any observability strategy. Overwhelmed IT Infra and Ops teams rely on for the powerful application and business insights they need to deliver flawless digital experiences to their end users. The challenge they face from the scale of an application’s APM deployments can be complex and difficult to maintain — costing teams time that could be better served focusing on business KPIs.

Turn maintenance time to innovation time


Cisco continuously looks at every opportunity to use automation and intelligence to give time back to our customers, with a full commitment to helping our customers reduce the stress and inefficiency caused by the ever-growing complexity of technologists’ IT environments. I’m pleased to share a major innovation in the Cisco Full-Stack Observability portfolio: Smart Agent for Cisco AppDynamics, which enables simplified full-stack application instrumentation and centralized agent lifecycle management.

Simplified agent management – focus on what matters most


An average sized organization may have upward of 40,000 agents in deployment, but I’ve even spoken with some larger organizations with more than one million agents to support massively scalable applications! Keeping all those agents updated to the latest version can be complicated and time consuming and takes away critical manpower from actually managing application performance.

But the business impacts can be even greater. Security risks can occur at any time, and to keep your IT environments safe, it is critical to maintain good agent management and version compliance. Failure to do so can expose teams to unnecessary risks that may have otherwise been resolved in the latest agent releases.

Good agent management also allows you to take advantage of the latest innovations released each month.  New features can provide powerful new insights, but taking advantage of these requires environments to be updated with the latest agents. This isn’t possible unless you have a structured and automated approach to agent management!

Maximizing Operational Efficiency: Introducing our New Smart Agent Management for Cisco AppDynamics
Centralized agent visibility on Cisco AppDynamics

How we made it simple


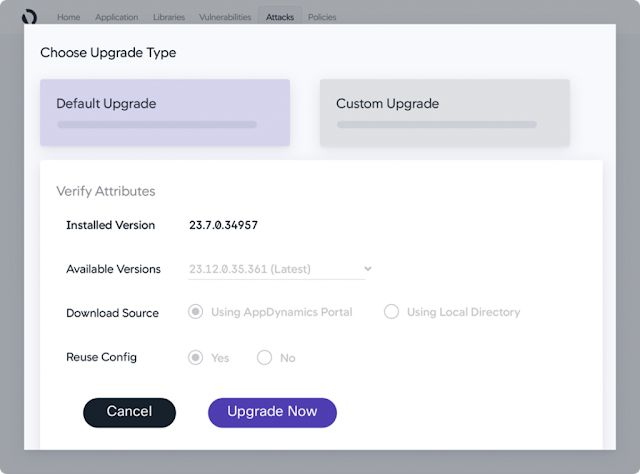
Cisco is making it easier than ever for customers to manage their agent fleets with the introduction of Smart Agent for Cisco AppDynamics with centralized agent lifecycle management, which allows you to onboard new applications faster, quickly identify out-of-date agents, and easily conduct upgrades. What may have once taken many hours of manual instrumentation now just requires a few minutes and clicks.

Smart Agent is deployed on each host, allowing teams to remotely install and upgrade Cisco AppDynamics agents from a centralized agent management console with just a few clicks. The console flags agents that are old and outdated, and easily allows IT teams to select them and push upgrades without coding or scripts. Users can also install new agents directly from the agent management console when instrumenting new applications. There’s no need for manual intervention —teams can now focus on what matters for the business and react quickly to security events or take advantage of new agent-based functionality.

Maximizing Operational Efficiency: Introducing our New Smart Agent Management for Cisco AppDynamics
Upgrade Cisco AppDynamics agents with just a few clicks.

Our dedication to simplification


Agent lifecycle automation is just the first step in our journey toward simplification for our customers. Soon, Smart Agent will be able to automatically instrument new applications with a single-agent installation utilizing intelligent auto-detect and auto-deploy capabilities, guided by Smart Agent policies, to determine which agents are needed, and then automatically download, install, and configure only those agents needed. Smart Agent will reduce instrumentation time from hours/days to minutes.

Source: cisco.com

Tuesday, 23 January 2024

New M6 based CSW-Cluster Hardware

New M6 based CSW-Cluster Hardware

This blog is about Cisco Secure Workload on premises platform hardware updates. The cluster hardware comprises of UCS servers and Nexus switches which are required to be upgraded with the EOL cycles of UCS servers and Nexus Switches. In this blog we will discuss about the new M6 hardware platform and its benefits.

Secure Workload is one of the security solutions from Cisco that offers micro-segmentation and application security across multi-cloud environments, and it is available as SaaS and on prem flavors. There is complete feature parity between both the solutions, and we see that many customers have chosen On-prem cluster over SaaS offerings due to their own requirements driven by their businesses especially in banking and finance, manufacturing verticals. Let us understand Microsegmentation and secure workload hardware cluster role.

Microsegmentation is being adopted by many enterprises as a preventive tool which is based on zero-trust principle. It helps protect applications and data by preventing lateral movements of bad actors and containing the blast radius during active attack. Deploying zero trust microsegmentation is a very hard task and operation intensive activity. The difficult part is the policy life cycle. The application requirements from the network keep on evolving as you upgrade, patch, or add new features to your applications and without microsegmentation it goes unnoticed because workloads can communicate to each other freely. As a principle of zero trust while deploying microsegmentation you are creating a micro-perimeter around each of these workloads and whitelisting the intended traffic while blocking rest all (Allow list model) then all these evolving changes in network requirement gets blocked unless there is a policy lifecycle mechanism available. Application teams will never be able to provide the exact communication requirements as they keep on changing and hence automatic detection of policies and changes is required.

Secure workload on prem cluster is available in two form factors small (8U) and large (39U) appliances. The reason Cisco has appliance based on-prem solution is for predictability and performance. In many cases vendors provide VM (Virtual Machine) based appliances with required specifications, but the challenge in VM appliances is that underlying hardware may be shared with other applications and may compromise the performance. Also, troubleshooting for performance related issues becomes challenging, especially for applications with AI/ML processing of large datasets. These appliances come with prebuilt racks with stacks of servers and nexus 9k switches which are hardened. Hence, we know the capacity and the number of workloads supported and other performance parameters can be predicted accurately.

The release 3.8 software has optimized the appliances performance and supporting 50-100% greater number of workloads on same hardware. This means the existing customers with M5 appliances now can support almost double the number of workloads in the existing investment of their appliances. The TCO (Total Cost of Ownership) for existing customers reduces with the new workload capacity numbers. The new and old numbers of supported workloads are as below.

New M6 based CSW-Cluster Hardware

All the current appliances are based on Cisco UCS C-220 M5 Gen 2 series. The M5 series server end of sale/life announcement has been published in May 2023 and M5 based Secure workload cluster has been announced EOS/EOL on 17th August 2023 (link). Even though the M5 cluster will have support for another few years, there are certain benefits of upgrading the cluster to M6.

Let us understand how the Micro-segmentation policies are detected and enforced in CSW (Cisco Secure Workload). The network telemetry is collected from all agent-based and agentless workloads in CSW. The AI/ML based Application dependency mapping is run on this dataset to detect the policies and changes to policies. The policies per workload are calculated and then pushed to workloads for enforcement leveraging the native OS firewalling capabilities. This is a huge amount of dataset to be handled for policy detection. The AI/ML tools are always CPU intensive and demand high CPU resources for faster processing. The larger the dataset will take longer processing time and require more CPU horsepower in the cluster to get more granular policies. It also needs a fast lane network within the cluster for communication between the nodes as the application is distributed amongst the cluster nodes. All of these performance related requirements of cluster drive the need to have more CPU resources and faster network connectivity. Though the existing hardware configuration is quite sufficient to handle all these requirements, there are going to be new features and functionalities which will be added in future releases and those may also need additional resources. Hence with the new 3.8 release we are launching the support for the new M6 Gen 3 appliance for both 8U and 39U platform. The processing power is based on the latest Cisco C series Gen3 servers with the latest processors from Intel and newer N9k switches. The new Intel processors are powerful with more cores available per processor, hence the total count of processing GHz for cluster is increased, providing more horsepower for AI/ML-based ADM (Application Dependency Mapping) processing. The overall performance of the cluster will be boosted by the additional cores available in the nodes.

We know that any upgrade of hardware is a difficult IT task. So, to simplify the upgrade task, we have made sure that the migration to M6 from M4/M5 is seamless by qualifying and documenting the complete process step wise in the migration guide. The document also mentions the checks to be carried out before and after migration to confirm that all data has been migrated correctly. All the existing configuration of the cluster with flow data will be backed up using DBR (Data Backup and Restore) functionality and will be restored on the new cluster after migration. This ensures that there is no data loss during the migration. The agents can be configured to re-home automatically to new cluster and reinstallation of agents is not needed.

As we know in security that the MTTD/MTTR must be as fast as possible, and I think that M6 upgrade will bring in faster threat and policy detection and response reducing MTTD/MTTR.

Source: cisco.com

Saturday, 20 January 2024

Come Together Right Now, IT Operations Teams

If you have been reading our blog series around the 2023 Global Networking Trends Report, you may have noticed two recurring themes. First, network infrastructure has become more complex, and second, this complexity is calling for a change in the way we operate. We have changed where we run everything, we have changed the locations of the end users, and we have moved to a flexible model that adapts to changing needs.

For one thing, most organizations have more than one cloud. The 2023 Global Networking Trends Report shows that 92% of respondents reported using more than one public cloud, and 69% stated they are using more than five software-as-a-service (SaaS) applications. That does not mean they are using SaaS exclusively, of course; the architecture varies from traditionally developed, on-premises software (you can call it “legacy” or “heritage”) to third-party microservices and full-blown commercial SaaS offerings. The choices of systems are bound to fixed hardware and operating system stacks or abstracted into granular containers and services.

Most organizations still support the older, static technology models, and at the same time have to adapt to newer technologies such as virtualization, microservices, Kubernetes, and heavier API use—which each come with different network support requirements. The “long tail” of old versus new presents a greater challenge to IT operations and security.

Avoid “cylinders of excellence”


Back when I was a system administrator, I would have been considered part of a “full stack” team. We were responsible for setting up and troubleshooting everything—from pulling cables and carrying (heavy) 20-inch CRT monitors to diagnosing application issues together with the developers. But that technology model fragmented over the decades into layer-based areas of specialization (see Figure 1).

Figure 1. Distributed infrastructures and workforce have caused increases in IT complexity (click to enlarge)

If you needed support, you had to pull in people from different domains, like the network engineer, the desktop support tech, the security experts, the Exchange admin, the database wizard, the business-embedded software engineer, and possibly a third-party vendor or two. We still see that problem today with IT operations forming silos. Silos such as cloud, network, and security operations were cited by 40% of our 2023 Global Networking Trends respondents as a top challenge to providing secure access from distributed locations to multiple cloud-based applications. And while some organizations have tried to unite these teams by forming “centers of excellence,” my experience is that with each team having its own agenda, these teams tend to turn into “cylinders of excellence”—further segmenting IT operations, while slowing down IT teams and the business.

Move swiftly and carry a small stick


None of the networking architectural options of the past few years are static. Just because many users went home during the pandemic doesn’t mean they’ll stay there long term. One call for an onsite, all-hands meeting will bring the networking load and access requirements back into the building for a few hours or even a few days. IT operations teams need to plan for a dynamic environment that hides each transition from the user. Implementing a zero-trust framework can help with this, since one of the principles of zero trust is that every access request should be subject to the same authentication and authorization process, no matter the location.

Given the dynamic nature of networking requirements, the IT operations and security teams need to converge—providing more alignment in their tools, processes, and people. This requires understanding how they can work better together to simplify IT and focus on end-to-end use cases. Cloud networking requirements are different from those in the data center. A security executive at a global bank once described to me how they made sure all the networking engineers received cloud training. Not only did that help with operational alignment, but it also opened up more career opportunities for the staff and empowered them to contribute support in more areas.

Another example in simplifying IT is to consider a secure access service edge (SASE) architecture to standardize enforcement, reduce complexity, and stay flexible in the face of a dynamic environment (as shown in Figure 2).

Come Together Right Now, IT Operations Teams
Figure 2. A secure access service edge (SASE) architecture converges people, processes, and technology for the monitoring and management of the software-defined WAN (SD-WAN) and security service edge (SSE) solutions (click to enlarge)

The days of siloed IT operations are over. All IT teams need a seat at the operations table as well as a unified agenda, including IT operations, networking, cloud services, and security professionals. End users should also have a seat at the table to add their business-side experience and desired outcomes to networking solutions.

As you go on your journey to consolidate and simplify your infrastructure, take this opportunity to bring all your IT operations teams together, along with users, so that the knowledge, skills, and processes in your network environment evolve as well. Try to avoid building another “cylinder of excellence” that is dedicated solely to cloud-based technology. While this may look like “plumbing” that doesn’t concern the business side, it is deeply user-facing in terms of performance and experience, and you may well discover important use cases when you include the end-to-end view.

The important message here is that people and processes are every bit as important as technology choices; IT operations should never operate in silos again.

Source: cisco.com

Thursday, 18 January 2024

How to Use Ansible with CML

How can Ansible help people building simulations with Cisco Modeling Labs (CML)?

Similar to Terraform, Ansible is a common, open-source automation tool often used in Continuous Integration/Continuous Deployment (CI/CD) DevOps methodologies. They are both a type of Infrastructure as Code (IaC) or Infrastructure as Data that allow you to render your infrastructure as text files and control it using tools such as Git. The advantage is reproducibility, consistency, speed, and the knowledge that, when you change the code, people approve, and it gets tested before it’s pushed out to your production network. This paradigm allows enterprises to run their network infrastructure in the same way they run their software and cloud practices. Afterall, the infrastructure is there to support the apps, so why manage them differently? 

Although overlaps exist in the capabilities of Terraform and Ansible, they are very complementary. While Terraform is better at the initial deployment and ensuring ongoing consistency of the underlying infrastructure, Ansible is better at the initial configuration and ongoing management of the things that live in that infrastructure, such as systems, network devices, and so on. 

In a common workflow in which an operator wants to make a change to the network, let’s say adding a new network to be advertised via BGP, a network engineer would specify that change in the code or more likely as configuration data in YAML or JSON. In a typical CI workflow, that change would need to be approved by others for correctness or adherence to corporate and security concerns, for instance. In addition to the eyeball tests, a series of automated testing validates the data and then deploys the proposed change in a test network. Those tests can be run in a physical test network, a virtual test network, or a combination of the two. That flow might look like the following:

How to Use Ansible with CML

The advantage of leveraging virtual test networks is profound. The cost is dramatically lower, and the ability to automate testing is increased significantly. For example, a network engineer can spin up and configure a new, complex topology multiple times without the likelihood of old tests messing up the accuracy of the current testing. Cisco Modeling Labs is a great tool for this type of test. 

Here’s where the Ansible CML Collection comes in. Similar to the CML Terraform integration covered in a previous blog, the Ansible CML Collection can automate the deployment of topologies in CML for testing. The Ansible CML Collection has modules to create, start, and stop a topology and the hosts within it, but more importantly, it has a dynamic inventory plugin for getting information about the topology. This is important for automation because topologies can change. Or multiple topologies could exist, depending on the tests being performed. If your topology uses dynamic host configuration protocol (DHCP) and/or CML’s PATty functionality, the information for how Ansible communicates with the nodes needs to be communicated to the playbook. 

Let’s go over some of the features of the Ansible CML Collection’s dynamic inventory plugin. 

First, we need to install the collection: 

ansible-galaxy collection install cisco.cml 

Next, we create a cml.yml in the inventory with the following contents to tell Ansible to use the Ansible CML Collection’s dynamic inventory plugin: 

plugin: cisco.cml.cml_inventory 

group_tags: network, ios, nxos, router

In addition to specifying the plugin name, we can also define tags that, when found on the devices in the topology, add that device to an Ansible group to be used later in the playbook:

How to Use Ansible with CML

In addition to specifying the plugin name, we can also define tags that, when found on the devices in the topology, add that device to an Ansible group to be used later in the playbook:

  • CML_USERNAME: Username for the CML user
  • CML_PASSWORD: Password for the CML user
  • CML_HOST: The CML host
  • CML_LAB: The name of the lab 

Once the plugin knows how to communicate with the CML server and which lab to use, it can return information about the nodes in the lab: 

ok: [hq-rtr1] => { 

    "cml_facts": { 

        "config": "hostname hq-rtr1\nvrf definition Mgmt-intf\n!\naddress-family ipv4\nexit-address-family\n!\naddress-family ipv6\nexit-address-family\n!\nusername admin privilege 15 secret 0 admin\ncdp run\nno aaa new-model\nip domain-name mdd.cisco.com\n!\ninterface GigabitEthernet1\nvrf forwarding Mgmt-intf\nip address dhcp\nnegotiation auto\nno cdp enable\nno shutdown\n!\ninterface GigabitEthernet2\ncdp enable\n!\ninterface GigabitEthernet3\ncdp enable\n!\ninterface GigabitEthernet4\ncdp enable\n!\nip http server\nip http secure-server\nip http max-connections 2\n!\nip ssh time-out 60\nip ssh version 2\nip ssh server algorithm encryption aes128-ctr aes192-ctr aes256-ctr\nip ssh client algorithm encryption aes128-ctr aes192-ctr aes256-ctr\n!\nline vty 0 4\nexec-timeout 30 0\nabsolute-timeout 60\nsession-limit 16\nlogin local\ntransport input ssh\n!\nend", 

        "cpus": 1, 

        "data_volume": null, 

        "image_definition": null, 

        "interfaces": [ 

            { 

                "ipv4_addresses": null, 

                "ipv6_addresses": null, 

                "mac_address": null, 

                "name": "Loopback0", 

                "state": "STARTED" 

            }, 

            { 

                "ipv4_addresses": [ 

                    "192.168.255.199" 

                ], 

                "ipv6_addresses": [], 

                "mac_address": "52:54:00:13:51:66", 

                "name": "GigabitEthernet1", 

                "state": "STARTED" 

            } 

        ], 

        "node_definition": "csr1000v", 

        "ram": 3072, 

        "state": "BOOTED" 

    } 


The first IPv4 address found (in order of the interfaces) is used as `ansible_host` to enable the playbook to connect to the device. We can use the cisco.cml.inventory playbook included in the collection to show the inventory. In this case, we only specify that we want devices that are in the “router” group created by the inventory plugin as informed by the tags on the devices: 

mdd % ansible-playbook cisco.cml.inventory --limit=router 

ok: [hq-rtr1] => { 

    "msg": "Node: hq-rtr1(csr1000v), State: BOOTED, Address: 192.168.255.199:22" 


ok: [hq-rtr2] => { 

    "msg": "Node: hq-rtr2(csr1000v), State: BOOTED, Address: 192.168.255.53:22" 


ok: [site1-rtr1] => { 

    "msg": "Node: site1-rtr1(csr1000v), State: BOOTED, Address: 192.168.255.63:22" 


ok: [site2-rtr1] => { 

    "msg": "Node: site2-rtr1(csr1000v), State: BOOTED, Address: 192.168.255.7:22" 


In addition to group tags, the CML dynamic inventory plugin will also parse tags to pass information from PATty and to create generic inventory facts:

How to Use Ansible with CML

If a CML tag is specified that matches `^pat:(?:tcp|udp)?:?(\d+):(\d+)`, the CML server address (as opposed to the first IPv4 address found) will be used for `ansible_host`. To change `ansible_port` to point to the translated SSH port, the tag `ansible:ansible_port=2020` can be set. These two tags tell the Ansible playbook to connect to port 2020 of the CML server to automate the specified host in the topology. The `ansible:` tag can also be used to specify other host facts. For example, the tag `ansible:nso_api_port=2021` can be used to tell the playbook the port to use to reach the Cisco NSO API. Any arbitrary fact can be set in this way. 

Getting started 

Trying out the CML Ansible Collection is easy. You can use the playbooks provided in the collection to load and start a topology in your CML server. To start, define the environment variable that tells the collection how to access your CML server: 

% export CML_HOST=my-cml-server.my-domain.com 

% export CML_USERNAME=my-cml-username 

% export CML_PASSWORD=my-cml-password 

The next step is to define your topology file. This is a standard topology file you can export from CML. There are two ways to define the topology file. First, you can use an environment variable: 

% export CML_LAB=my-cml-labfile 

Alternatively, you can specify the topology file when you run the playbook as an extra–var. For example, to spin up a topology using the built in cisco.cml.build playbook: 

% ansible-playbook cisco.cml.build -e wait='yes' -e cml_lab_file=topology.yaml 

This command loads and starts the topology; then it waits until all nodes are running to complete. If -e startup=’host’ is specified, the playbook will start each host individually as opposed to starting them all at once. This allows for the config to be generated and fed into the host on startup. When cml_config_file is defined in the host’s inventory, it is parsed as a Jinja file and fed into that host as config at startup. This allows for just-in-time configuration to occur. 

Once the playbook completes, you can use another built-in playbook, cisco.cml.inventory, to get the inventory for the topology. In order to use it, first create a cml.yml in the inventory directory as shown above, then run the playbook as follows: 

% ansible-playbook cisco.cml.inventory 

PLAY [cml_hosts] ********************************************************************** 

TASK [debug] ********************************************************************** 

ok: [WAN-rtr1] => { 

    "msg": "Node: WAN-rtr1(csr1000v), State: BOOTED, Address: 192.168.255.53:22" 


ok: [nso1] => { 

    "msg": "Node: nso1(ubuntu), State: BOOTED, Address: my-cml-server.my-domain.com:2010" 


ok: [site1-host1] => { 

    "msg": "Node: site1-host1(ubuntu), State: BOOTED, Address: site1-host1:22" 


In this truncated output, three different scenarios are shown. First, WAN-rtr1 is assigned the DHCP address it received for its ansible_host value, and ansible port is 22. If the host running the playbook has IP connectivity (either in the topology or a network connected to the topology with an external connector), it will be able to reach that host. 

The second scenario shows an example of the PATty functionality with the host nso1 in which the dynamic inventory plugin reads those tags to determine that the host is available through the CML server’s interface (i.e. ansible_host is set to my-cml-server.my-domain.com). Also, it knows that ansible_port should be set to the port specified in the tags (i.e. 2010). After these values are set, the ansible playbook can reach the host in the topology using the PATty functionality in CML. 

The last example, site1-host1, shows the scenario in which the CML dynamic inventory script can either find a DHCP allocated address or tags to specify to what ansible_host should be set, so it uses the node name. For the playbook to reach those hosts, it would have to have IP connectivity and be able to resolve the node name to an IP address. 

These built-in playbooks show examples of how to use the functionality in the CML Ansible Collection to build your own playbooks, but you can also use them directly as part of your pipeline. In fact, we often use them directly in the pipelines we build for customers. 

Source: cisco.com

Tuesday, 16 January 2024

Using the Knowledge Store on Cisco Observability Platform

Build custom observability solutions


Cisco Observability Platform (COP) enables developers to build custom observability solutions to gain valuable insights across their technology and business stack. While storage and query of Metric, Event, Log, and Trace (MELT) data is a key platform capability, the Knowledge Store (KS) enables solutions to define and manage domain-specific business data. This is a key enabler of differentiated solutions. For example, a solution may use Health Rules and FMM entity modeling to detect network intrusions. Using the Knowledge Store, the solution could bring a concept such as “Investigation” to the platform, allowing its users to create and manage the complete lifecycle of a network intrusion investigation from creation to remediation.

In this blog post we will teach the nuts and bolts of adding a knowledge model to a Cisco Observability Platform (COP) solution, using the example of a network security investigation. This blog post will make frequent use of the FSOC command to provide hands-on examples. If you are not familiar with FSOC, you can review its readme.

First, let’s quickly review the COP architecture to understand where the Knowledge Store fits in. The Knowledge Store is the distributed “brain” of the platform. The knowledge store is an advanced JSON document store that supports solution-defined Types and cross-object references. In the diagram below, the Knowledge Store is shown “connected” by arrows to other components of the platform. This is because all components of the platform store their configurations in the knowledge store. The Knowledge Store has no ‘built-in’ Types for these components. Instead, each component of the platform uses a system solution to define knowledge types defining their own configurations. In this sense, even internal components of the platform are solutions that depend on the Knowledge Store. For this reason, the Knowledge Store is the most essential component of the platform that absolutely nothing else can function without.

Using the Knowledge Store on Cisco Observability Platform

To add a more detailed understanding of the Knowledge Store we can understand it as a database that has layers. The SOLUTION layer is replicated globally across Cells. This makes the SOLUTION layer suitable for relatively small pieces of information that need to be shared globally. Any objects placed inside a solution package must be made available to subscribers in all cells, therefore they are placed in the replicated SOLUTION layer.

Using the Knowledge Store on Cisco Observability Platform
Solution Level Schema

Get a step-by-step guide


From this point we will switch to a hands-on mode and invite you to ‘git clone git@github.com:geoffhendrey/cop-examples.git’. After cloning the repo, take a look at https://github.com/geoffhendrey/cop-examples/blob/main/example/knowledge-store-investigation/README.md which offers a detailed step-by-step guide on how to define a network intrusion Type in the JSON store and how to populate it with a set of default values for an investigation. Shown below is an example of a malware investigation that can be stored in the knowledge store.

Using the Knowledge Store on Cisco Observability Platform
Malware Investigation

The critical thing to understand is that prior to the creation of the ‘investigation’ type, which is taught in the git repo above, the platform had no concept of an investigation. Therefore, knowledge modeling is a foundational capability, allowing solutions to extend the platform. As you can see from the example investigation below, a solution may bring the capability to report, investigate, remediate, and close a malware incident.

If you cloned the git repo and followed along with the README, then you already know the key points taught by the ‘investigation’ example:

  1. The knowledge store is a JSON document store
  2. A solution package can define a Type, which is akin to adding a table to a database
  3. A Type must specify a JSON schema for its allowed content
  4. A Type must also specify which document fields uniquely identify documents/objects in the store
  5. A solution may include objects, which may be of a Type defined in the solution, or which were defined by some different solution
  6. Objects included in a Solution are replicated globally across all cells in the Cisco Observability Platform.
  7. A solution including Types and Objects can be published with the fsoc command line utility

Provide value and context on top of MELT data


Cisco Observability Platform enables solution developers to bring powerful, domain specific knowledge models to the platform. Knowledge models allow solutions to provide value and context on top of MELT data. This capability is unique to COP. Look for future blogs where we will explore how to access objects at runtime, using fsoc, and the underlying REST APIs. We will also explore advanced topics such as how to generate knowledge objects based on workflows that can be triggered by platform health rules, or triggers inside the data ingestion pipeline.

Source: cisco.com