Thursday, 30 July 2020

What happens to the Cisco Live Network Infrastructure when the conference goes virtual?

This is a question the Technology Experiences Team (TechX), Cisco’s dedicated team of infrastructure engineers and project managers, asked themselves this year. When our annual, in-person conference suddenly went virtual, it rendered our hardware a little redundant. So, what do we do with the technology we’d usually deploy for our customers at events?

TechX is chartered with the support of events and trade shows throughout the calendar year. It is our fun and often exhilarating task to implement Cisco’s technologies and sometimes our very latest solutions. Supporting our customers, event staff, and partners to host Cisco Live, and building an enterprise class network for 28,000+ people in just a few days is certainly an undertaking.

With no physical events this year, all that amazing Cisco technology is suddenly useless, right? Well, fortunately not. My job within the team is to build out and support the Data Center (DC) for our shows. The DC is home for all those applications that make the event and supporting it a success. Our applications portfolio includes: Cisco Identify Services Engine (ISE), Cisco Prime Network Registrar (CPNR – DNS/DHCP), Cisco DNA Center, virtual Wireless LAN controllers, FTP, Cisco Network Services Orchestrator (NSO), Data Center Network Manager (DCNM), vCenter, various flavors of Linux based on our Engineers preference, NTP, Active Directory, Remote Desktop Services, Application Delivery Controllers (ADC), Cisco Video Surveillance Manager, Grafana, NetApp Snap Center, Ansible hosts, Mazemap Lipi server, Find my Friends server, web hook servers, Database hosts, and the list goes on.

What did we do with a DC that supports all of those wonderful applications you may well ask? Well, we did two things. First we deployed Folding@home virtual machines, which as many of you well know is a distributed network of compute power using almost any machine to crunch numbers, helping scientists at Stanford University work toward cures for diseases. What better use of a large Data Center? Not only are we repurposing our infrastructure instead of retiring it, we’re doing our part to help with a healthcare crisis. In fact, Cisco as a whole is using its compute power across the company to contribute, and you can see our progress with the Folding@home project. Cisco’s team ID is 1115, and our group is called CiscoLive2016, as that’s the first time we deployed Folding@home during that very show.

Other important questions arise from this such as:

◉ What are we using to host Folding@home?
◉ How did we deploy the virtual machines?
◉ How are we monitoring our compute?
◉ How do we monitor our progress in terms of the Folding@home project?

What are we using to Host Folding@home?


We deploy two types of compute cluster at Cisco Live, one traditional data center solution with storage and blade servers (UCS B series), known as a Flexpod. The second, a hyperconverged cluster known as Cisco Hyperflex. The Flexpod is a collaborative solution that comprises VMware’s vSphere virtualization software, NetApp’s storage clusters, Cisco’s UCS Blade Servers, and Nexus Data Center switches. In this case we’re using UCS B200 M4 split over two chassis combined with a NetApp MetroCluster IP for a total of 16 Blades. The Metro cluster is a fully redundant storage system that replicates all data between two arrays. As such, if you lose one, the other will allow you to recover your lost data. Typically, these are installed at two different locations, which isn’t possible at Cisco Live due to space and cabling restrictions. You’ll see how we configure it below.

The MetroCluster actually ships with two Nexus 3232C switches to create the IP connectivity between both clusters. The UCS Chassis uses a boot from SAN method, to load their ESXi OS from the Metro Cluster IP. Due to UCS’s service profiles, if we were to lose a blade, we may simply replace the blade and boot the exact same operating system, used by the old host, without the need to re-install ESXi. A service profile is essentially a set of variables that make a host or server operable.  These variables include UUID, MAC address, WWPN’s and many other pieces of information. When we insert a new blade it would take on the appearance of the fold blade using the information created within the profile. This allows it to masquerade as the old host and permits a compute hotswap. Here’s a basic diagram of our design.

Flexpod Design Diagram

Cisco Prep, Cisco Tutorial and Material, Cisco Guides, Cisco Learning, Cisco Exam Prep

How are we monitoring our Compute?


The other awesome thing about Cisco’s compute platform is we have a cloud-based monitoring system called Cisco Intersight. We use this each year to ensure our servers are running without error. You may also access the servers’ management interfaces, UCS Manager, from Intersight, making it a consolidated GUI across multiple sites or deployments. Here’s a Dashboard screen capture of how that looks. We actually have an error on one host which I need to investigate further. It’s great to have a monitoring system, especially whilst we’re all working from home.

Cisco Prep, Cisco Tutorial and Material, Cisco Guides, Cisco Learning, Cisco Exam Prep

How did we deploy the Virtual Machines?


Being a busy guy, I didn’t want to manually deploy all 40 virtual machines (VMs), carrying out a lot of error prone typing of host names, IP addresses and VM specific parameters. Bearing in mind, there would be a great deal of repetition as each VM is essentially the same. Instead I decided to automate the deployment of all the VMs. The great news is, some of the work has already been done as VMware themselves have produced a Folding@home ‘ova’ image running their Photon OS. The image is optimized to run on ESXi and can be installed using ova/ovf parameters. These are basically settings, such as IP address, hostname and information specific to the Folding@home software install taken prior to installation. There are some installation posts regarding deployment and also in the download itself. Please see the link at the end of this post.

Using Python scripting and VMware’s ovftool, a command line tool for deploying ovf/ova files, I was able to take the image and pass all the ova parameters to the ovftool. The ovftool then actually builds a VM on a specified host taking all of your desired settings. Using Python, I can loop over all of these parameters x number of times, in my case forty, and execute the ovftool command forty times.  This was a joy to watch, as VM’s started to appear in my vCenter all of a sudden and I could sit back and drink my cappuccino.

After the installation I was able to monitor, using VMware’s vCenter how our hosts were running. Using Folding@home’s largest VM’s installation, which uses more processing power, I was able to push our cluster to around 75% CPU utilization on each host as can be seen below. Some hosts were spiking a little, so I needed to make some adjustments, but we continued to crunch numbers and use our otherwise idle compute for a greater good.

Cisco Prep, Cisco Tutorial and Material, Cisco Guides, Cisco Learning, Cisco Exam Prep

How do we monitor our progress in terms of the Folding@home project?


Digging into Folding@home, I was able to learn the project has an Application Programming Interface or API. The API allows access to the statistics programmatically. Again, using Python alongside InfluxDB and Grafana, I was able to create a dashboard that the team could view in order to monitor our progress. Here’s a sample that I’ve annotated with numbers so we can refer to each statistic individually.

1. Teams work units, the amount of data crunched over time
2. The score assigned to our team over time
3. Cisco System’s group position out of all companies contributing to the project
4. Within the Cisco Systems group, our own position within the project
5. TechX work units as a numerical value
6. TechX’s Score as a numerical value

Cisco Prep, Cisco Tutorial and Material, Cisco Guides, Cisco Learning, Cisco Exam Prep

I was going to go into what we used our Hyperflex for, but I may leave that to another article as this one is getting a little long!

Tuesday, 28 July 2020

Cisco Managed Services Offers To Support Partners Across Their Portfolio Journey

Today’s customers are relentlessly focused on accelerating business outcomes throughout their lifecycle journey. Cisco and our partners have worked together for many years to develop and successfully deliver technology innovations across all industries. To help our partners continue to build on their roles as trusted advisors, we have built a Customer Experience Success Portfolio, which opens up multiple service opportunities.

Cisco understands that not all partners have the same focus areas or business models. They may be at different stages in developing new technologies, architectures, and solution portfolios. That’s why Cisco offers a range of services to support partners, regardless of where they are in their journey.

Some partners may have plenty of their own engineering resources and have already successfully developed and deployed their own solutions to customers. For these partners, Cisco Technical Assistance Center (TAC) offers support services for escalations and troubleshooting.

Cisco also offers mentoring and training services for partners who are building a new practice around a new technology and may need help with their initial installs.

Some partners may focus on a very specific architecture, but might need to respond to an opportunity with requirements that are outside their area of expertise. Not everyone can invest the resources to become proficient in every technology or solution that Cisco offers. Cisco’s advanced services experts can help partners fill gaps in their offerings and seize more opportunities.

In some cases, a partner may wish to completely offload the management and operation of a new solution for their customer. They may want to avoid the time and expense of building a new security or network operations center. Or maybe their business model or customer installed base can’t justify building out their own management and operations.

For partners who have already built out their own managed services practice, Cisco Managed Services can help capture more of this market opportunity if they lack capabilities in certain areas or can’t scale fast enough to accommodate specific customer needs. Cisco can help you win more managed services opportunities right away, without having to wait to build your own capabilities.

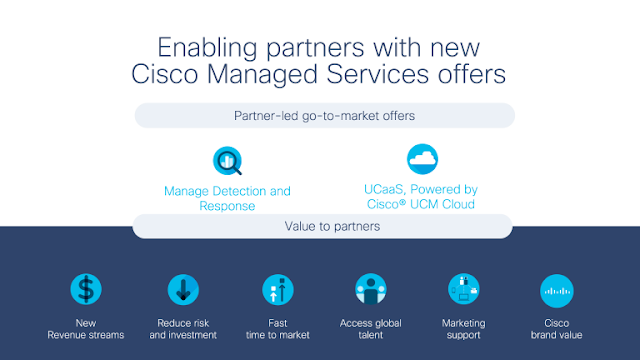
Cisco Managed Services offers enable partners to address these types of specific market opportunities.

Many of our partners might have not heard about Cisco Managed Services. They may be unaware that Cisco Managed Services has been serving a select group of large strategic enterprise customers over the past sixteen years.  We wanted to find a way to package up and share what we’ve been learning into a partner-ready go to market offer.

Cisco Study Material, Cisco Guides, Cisco Learning, Cisco Exam Prep

Now you can take advantage of all the knowledge, intellectual property, and experience that Cisco has accumulated, to help your customers achieve the outcomes they are seeking.

According to IDC, companies are spending more than $21 billion for around-the-clock monitoring and management of security operations centers today. Managed security services are now the fastest growing segment of the IT security sector, with a compound annual growth rate of 14.2 percent, and IDC estimates that the overall market will be $32.2 billion by 2022.

Managed Detection and Response (MDR) lets customers apply advanced security across the cloud, network, and endpoints. It is delivered by an elite team of researchers, investigators, and responders, together with integrated intelligence, defined investigations, and response playbooks supported by Cisco Talos threat research.

Cisco MDR leverages Cisco’s world-class integrated security architecture to deliver industry-leading 24x7x365 threat detection and response. It helps customers reduce mean time to detect, and lets them contain threats faster with relevant, meaningful, prioritized response actions.

According to Markets and Markets, companies will have spent $31 billion on enterprise collaboration in 2019. By 2024, the projected total available market will be $48.1 billion, with a compound annual growth rate of 9.2 percent.

Cisco UCM Cloud provides a complete collaboration, security, and networking solution from Cisco that simplifies the move to the cloud. It lets customers move from their current on-premise model, where they are responsible for maintaining Cisco UC Manager, to an as-a-service model from Cisco.

Unified Communication as a Service, Powered by Cisco UCM Cloud is a managed service that wraps around the Cisco UCM Cloud solution, simplifying your customers’ ongoing management of a cloud-based UC platform. CX Managed Services can help you make the most of this growing market opportunity. Our offerings can complement your managed voice, video, and contact center offers, to help support customers’ heterogeneous environments and a flexible transition to the cloud.

Cisco is dedicated to helping you unlock the potential of the growing managed services market, to help you grow your practice. We want to complement your portfolio and drive pull-through opportunities both for technology solutions, as well as value add on partner services.

Sunday, 26 July 2020

Cisco APIs Help Partners Address Demand for Work From Home

Cisco Prep, Cisco Learning, Cisco Exam Prep, Cisco Tutorial and Material

Achieve amazing end user experiences


You are telling me I can get my entire music library on just that battery powered hard drive and have room for 10,000+ more songs! It was a whole new process that took some work to sort, tag, and rip all my CDs. This sea change in the way of doing something I had been doing for years created a user experience so valuable, it was impossible to return to the old way of doing things.

Technology really shines when it can fundamentally change a process to achieve amazing end user experiences. As we forge ahead in this new environment, I was reminded of 1998 and how MP3s changed my world.

Work from home can pose new challenges to IT


Nobody predicted tens of thousands of people that used to go into the office every day would be suddenly working from home. It has forced some interesting evaluation of our business processes; do we need floors of cube farms to get work done? According to Business News Daily in March, they found work from home workers to put in an average of 1.4 more days per month or more than three additional weeks of work per year. It appears that the claims of workers being more productive working remote has some real data to back it up. While this level of change is a good thing for corporations’ top line, it can pose some new challenges to IT.

Up until recently the bandwidth coming into the data center was more than sufficient to support cloud data set backups, sync with our remote data center, and provide Internet access and VPN access for our employees. However, when your 7,000 employees leave those LAN connected branches and all WFH (Work From Home), the experience can suffer dramatically.

Addressing the new demand for work-from-home


At Cisco, we have long had a vision that the most important measurement of IT performance is employee and customer experience which is why we continue to make strategic acquisitions such as Application Dynamics and the soon to close ThousandEyes.

Effectively addressing this new demand in this hyper connected world means scaling workloads across multiple clouds. But how do you ensure the experience for an employee in a WFH environment over a VPN or HTTPS session is getting the application experience required for them to get that extra 1.4 days in each month? A dashboard of application and network health, regardless of where that application is being hosted or consumed would provide IT the agility it needs to know and address any issues before they become real problems.

Using the SDKs and Cisco APIs


Using the SDKs and APIs from App-D, vManage SDWAN, ThousandEyes, and Tetration would allow a DevNet certified partner to build just such a health application to offer as part of a managed service, standalone app, or other competitive differentiator for their customers.

The flow could look something like this:
  • Customer moves front-end web-scale applications to AWS, Azure, and Google Cloud while others with low-latency dependencies stay in the DC (could automatically be moved by Cisco CloudCenter)
  • Application Dynamics agents monitor the application stack in the DC and in the cloud while automatically injecting javascript into the remote browsers to monitor the user experience.
  • Tetration applies workload-protection policies at the OS/instance level and reports connectivity and dependency information back. These policies are maintained consistently across on-premises DC and public cloud environments.
  • Cisco Viptela SDWAN ensures application demand is being balanced across the multi-cloud environment for high availability
  • ThousandEyes actively monitors the network traffic paths across internal, external, SaaS, carrier and Internet networks in real time, reporting hop by hop issues such as path changes, bandwidth constraints, round-trip latency, packet loss, and QoS remarking.
  • The DevNet Certified partner utilizes APIs, SDKs, etc. from each of those products.
    • Validate the workload is spun up in the preferred cloud provider
    • Validates Tetration cloud workload-protection matches the DC workload-protection and dependencies are connected
    • vManage reports that the applications are being securely delivered and balanced between clouds with minimal latency
    • ThousandEyes validates there are no alerts on transitory or peering AS routes to AWS, SalesForce, or O365
    • App-D sees the CPU, Memory, and application calls are at appropriate levels and response times from the workload and at the clients desktop are well within spec.
The Dashboard is updated: Virtual workload secure, responding, and scaled. Client’s side responding, WAN available, and secure. Success! We have deployed our WFH solution providing the same or better experience as if we are sitting in the cubes, but with the comfort of being in our pajamas with our dog laying on our feet. Technology shines when it drives change and simplicity, offering better ways of doing things.

Cisco APIs help partners to adapt


Cisco DevNet Certified partners and Cisco APIs allow us to easily adapt and show how IT can truly shine in a hyperconnected world.

Now to get back to sorting another batch of MP3s, you have to have tunes while thinking about how we can change the world.

Saturday, 25 July 2020

Cisco Secure Cloud Architecture for Azure

Workloads and applications are moving from a traditional data center to the public cloud as the public cloud provides an app-centric environment. Microsoft Azure offers critical features for application agility, faster deployment, scalability, and high availability using native cloud features. Microsoft Azure recommends tiered architecture for web applications, as this architecture separates various functions. There is the flexibility to make changes to each tier independent of another tier.

Figure1 shows a three-tier architecture for web applications. This architecture has a presentation layer (web tier), an application layer (app tier), and a database layer (database tier). Azure has a shared security model, i.e., the customers are still responsible for protecting workloads, applications, and data.

Cisco Tutorial and Material, Cisco Guides, Cisco Learning, Cisco Certification

Figure 1: Azure three-tier web architecture

In addition to the native cloud security controls, Cisco recommends using security controls for visibility, segmentation, and threat protection.

Cisco Tutorial and Material, Cisco Guides, Cisco Learning, Cisco Certification


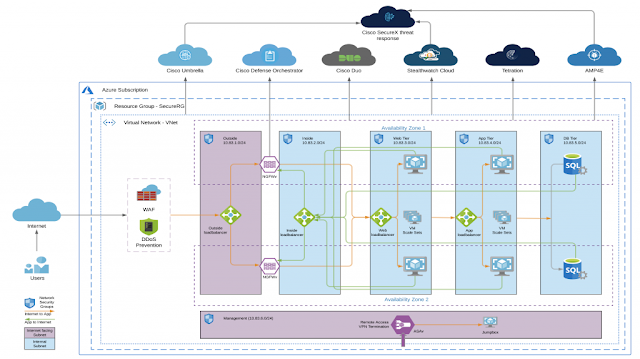
Cisco recommends protecting workloads and applications using Cisco Validated Design (CVD) shown in figure 3. We focused on three-essential pillars (visibility, segmentation, and threat protection) of security validating this cloud security architecture.

This solution brings together a Cisco, Radware, and Azure to extend unmatched security for workloads hosted in the Azure environment.

◉ Visibility: Cisco Tetration, Cisco Stealthwatch Cloud, Cisco AMP for Endpoints, Cisco SecureX Threat Response, and Azure Network Security Group flow logs.

◉ Segmentation: Cisco Firepower Next-Generation Virtual Firewall (NGFWv), Cisco Adaptive Security Virtual Appliance (ASAv), Cisco Tetration, Azure Network Security Group

◉ Threat Protection: Cisco Firepower Next-Generation Virtual Firewall (NGFWv), Cisco Tetration, Cisco AMP for Endpoints, Cisco Umbrella, Cisco SecureX Threat Response, Azure WAF, Azure DDoS, Radware WAF, and Radware DDoS.

In addition to visibility, segmentation, and threat protection, we also focused on Identity and Access Management using Cisco Duo.

Cisco Tutorial and Material, Cisco Guides, Cisco Learning, Cisco Certification


Cisco security controls used in the Cisco Validated Design (Figure 3):

◉ Workload level

      ◉ Cisco Tetration: Cisco Tetration agent on Azure instances forwards “network flow and process information” this information essential for getting visibility and policy enforcement.
     ◉ Cisco AMP for Endpoints: Cisco AMP for Endpoints offers protection against Malware.

◉ VNet level

     ◉ Cisco Umbrella (VNet DNS settings): Cisco Umbrella cloud offers a way to configure and enforce DNS layer security and IP enforcement to workloads in the VNet.

     ◉ Cisco Stealthwatch Cloud (NSG flow logs): SWC consumes Azure NSG flow logs to provided unmatched cloud visibility. SWC includes compliance-related observations, and it provides visibility 
into your Azure VNet cloud infrastructure.

◉ Perimeter

     ◉ Cisco Next-Generation Firewall Virtual (NGFWv): Cisco NGFWv provides capabilities like a stateful firewall, “application visibility and control”, next-generation IPS, URL-filtering, and network AMP in Azure.
     ◉ Cisco Adaptative Security Appliance Virtual (ASAv): Cisco ASAv provides a stateful firewall, network segmentation, and VPN capabilities in Azure VNet.
     ◉ Cisco Defense Orchestrator (CDO): CDO manages Cisco NGFWv and enables segmentation and threat protection.

◉ Identity

     ◉ Cisco Duo: Cisco Duo provides MFA service for Azure console and applications running on the workloads.

◉ Unify Security View

      ◉ Cisco SecureX Threat Response: Cisco SecureX Threat Response has API driven integration with Umbrella, AMP for Endpoints, and SWC (coming soon). Using these integrations security ops team can get visibility and perform threat hunting. 

Azure controls used in the Cisco Validated Design (Figure 3):

◉ Azure Network Security Groups (NSGs): Azure NSG provides micro-segmentation capability by adding firewalls rules directly on the instance virtual interfaces. NSGs can also be applied at the network level for network segmentation.
◉ Azure Web Application Firewall (WAF): Azure WAF protects against web exploits. 
◉ Azure DDoS (Basic and Standard): Azure DDoS service protects against DDoS. 
◉ Azure Internal and External Load Balancers (ILB and ELB): Azure ILB and ELB provide load balancing for inbound and outbound traffic.

Radware controls used in the Cisco Validated Design (Figure 3):

◉ Radware (WAF and DDoS): Radware provides WAF and DDoS capabilities as a service.

Cisco recommends enabling the following key capabilities on Cisco security controls. These controls provide unmatched visibility, segmentation, and threat protection and help in adhering security compliances.

Cisco Tutorial and Material, Cisco Guides, Cisco Learning, Cisco Certification

In addition to the above Cisco security control, Cisco recommends using the following native Azure security components to protect workloads and applications.

Cisco Tutorial and Material, Cisco Guides, Cisco Learning, Cisco Certification

Secure Cloud for Azure – Cisco Validated Design Guide (July 2020)

For detailed information on Secure Cloud Architecture for Azure, refer to our recently published Cisco Validated Design Guide. This design guide is based on the Secure Cloud Architecture Guide. The Secure Cloud Architecture Guide explains cloud services, critical business flows, and security controls required for the cloud environment to protect workloads. This guide covers the Cisco Validated Designs for workload protection in Azure three-tiered architecture. This also includes cloud-native security controls and Radware WAF/DDoS for workload protection in the cloud.

Friday, 24 July 2020

How Trustworthy Networking Thwarts Security Attacks

Nestled in the picturesque Sierra Nevada mountain range, famous for its ski resorts, spas, and casinos, is Reno’s Renown Health. Renown is northern Nevada’s largest and most comprehensive healthcare provider and the only locally owned, not-for-profit system in the region. Renown boasts 6500+ employees across more than 70 facilities serving over 74,000 Nevadans every month.  During ski season, it’s not unusual to see one or more helicopters hanging out on the roof of the hospital. Because of its location, the need for alternative modes of transport and communication are imperative to serving its remote community and ski slopes.

As with most hospitals, Renown is highly connected with medical devices, communications devices, mobile crash carts, as well as surgical robots, MRI machines, you name it—and it’s all connected to a centralized network that provides access to mission-critical data, applications, and services.  This not only includes the production healthcare network but the guest network where patients and their friends and family communicate. And from what I hear, the guest network is also popular with the staff, which means that it must be as reliable and secure as the hospital’s production network.

Getting Wi-Fi with a little help from my friends (at Cisco)


A couple weeks ago, I (virtually) sat down with Dustin Metteer, network engineer at Renown Health, to learn a little bit more about how Cisco and Renown work together. Dustin started out by sharing that their wireless network wasn’t always as wonderful as it is today. He explained that Renown had been using another company’s access points (APs) for a few years. Long story short, they didn’t live up to expectations on both the hardware and software side. After a few years of trying to get this solution to work, Dustin and team moved to Cisco and the Aironet platform.  The Cisco Aironet APs delivered the reliability, security, and ease of use that Renown needed. And for five years, the Cisco Aironet 3702 APs served Renown’s 70+ facilities with consistent wireless communications.

Today, Renown is moving to the next generation of Cisco APs with Wi-Fi 6 compatibility, more sophisticated chip sets, and the latest IOS-XE operating system all covered under a single Cisco DNA Advantage license. Dustin shared that healthcare facilities are typically late to adopt technology and the hospital isn’t stocked with Wi-Fi 6 devices. However, Dustin felt the move was necessary to ensure the network is ready when the time comes.

“While updating,” says Dustin “we thought, ‘Why not update to the latest technology and future proof the network?’”

And so that’s what they did.

Cisco Catalyst access points deliver on experience


Renown purchased its first batch of Wi-Fi 6-ready Cisco Catalyst 9120 Access Points along with Cisco Catalyst 9800-80 wireless controllers about a year ago. The healthcare company has updated several hospitals already. But with more than 70 facilities dispersed throughout the state, they’ll be busy for a while. The Catalyst 9120 has 4×4 radios, custom ASICs, and the ability to host applications at the edge. Additionally, it’s compatible with DNA Spaces (included with Cisco DNA Advantage) for location-based analytics which also has the ability to integrate with other healthcare specific applications for wayfinding, asset management, and more—we’ll get into this a little further down. But the real reason for the Catalyst 9120, is it’s a good fit for Renown’s highly demanding, high-density environment.

“We coupled our new 9120 Access Points with the Cisco Catalyst 9800-80 wireless controllers to push configurations and define policies for our WLANs,” says Dustin.  “Provisioning is as easy as defining the policies and tags for each wireless network and assigning to each group of APs.” To add to that, policies based on identity and tags enable the hospital to segment users while ensuring secure access to resources and compliance. And updates can be done live without taking the wireless network offline. Seriously, and they don’t even have to restart or anything.

Of course, all good wireless networks have a great wired network behind them. Renown has also recently upgraded to the Cisco Catalyst 9000 family of switches to drive everything from the edge to the core. And for resiliency, Renown has deployed them in high-availability (HA) pairs. Here’s what Dustin says: “We always want to be prepared for any piece of anything to break and so we have backup all the way down to our core switches.”

And when asked about running everything from the switches to the controllers to the APs on the Cisco IOS-XE operating system, Dustin is excited that he can, “run commands across the stack and not worry about it.” He adds: “The usability is awesome.”

Taking control with Cisco DNA Center


“We can simply log into Cisco DNA Center and it takes us five minutes to do what used to take hours.” That’s the first thing Dustin tells me when I ask about Cisco DNA Center. It set the stage for the next phase in our conversation around wired and wireless assurance in a healthcare system where 100% uptime isn’t just the standard, it’s mission critical.

Prior to Cisco DNA Center, the Renown team would wander around looking for the root cause of a reported issue and of course, it was rarely replicated. It’s like when you take the car to the mechanic for a noise it’s been making for a month, you pull into the shop and the noise is gone. But unlike the mechanic, the Renown team has Cisco DNA Center with Cisco DNA Assurance built in. This gives them X-ray like vision and allows them to trace an issue to its root cause, even something that happened days ago. Once an issue is identified, assurance provides them with remediation tips and best practices for quick resolution. Its advanced analytics and machine learning combine to reduce the noise of non-relevant alerts and highlight serious issues, saving them time troubleshooting. With Cisco DNA Center, the team has the assurance tools they need to increase network performance and spend less time doing it.

Cisco Tutorial and Material, Cisco Learning, Cisco Guides, Cisco Security

Cisco DNA Spaces + STANLEY Healthcare: Helping hospitals help patients


The Cisco Catalyst 9120 APs that Renown purchased also have the ability run Cisco DNA Spaces which provides a cloud-based platform for location-based analytics. Renown chose to use the Cisco DNA Spaces and STANLEY Healthcare integration to remotely track the temperature and location of medications and set alerts to prevent them from spoilage. In the past, thermostats needed be checked manually, one-by-one by nurses which was time consuming and labor intensive. Not only does the integration make temperature tracking more consistent, it also makes the nurses’ lives easier and allows them to focus on what matters most, caring for their patients.

Renown also uses the Cisco DNA Spaces and STANLEY Healthcare integration to track assets. Things like IV pumps, “are small and easily maneuvered and they tend to go walking,” says Dustin. It’s often complicated to track the locations of 30 to 40 assets at once, and many are lost or misplaced. Cisco DNA Spaces not only allows them to track down and locate misplaced devices, they use tags and set perimeters, and once a tagged device “goes walking” it sounds an alarm. This reduces lost equipment and saves on the time spent searching for missing equipment.

And when asked about deployment of the integration, Dustin says, “it was really simple to operate and going into Cisco DNA Spaces was very intuitive. Getting STANLEY Healthcare integrated with Cisco DNA Spaces was relatively painless.”

In the future, Renown is planning to use Cisco DNA Spaces in conjunction with their mobile app to help patients, visitors, and guests with indoor wayfinding. Patients often encounter difficulties pinpointing where in the healthcare facility their appointment is. Dustin says, “Using maps with Cisco DNA Spaces will enable patients to get to their appointments faster and more efficiently without the need to stop and get directions, it’ll give them a better experience.”

Visibility, control, experience, and analytics


Renown’s new networking solution, comprised of the latest Cisco LAN gear, will provide the hospital system with reliable and secure connectivity for many years to come. With Cisco DNA Center, they are able to assure service while proactively troubleshooting potential issues to deliver users the optimal connected experience. And with Cisco DNA Spaces, Renown has simplified device monitoring and location analytics proving valuable insights and simplifying operations. And Renown is only partially through its LAN refresh. I look forward to following up with them to see how things turn out.

In closing, I posed a question to Dustin. With all this new equipment, have any of your users noticed a difference? Dustin explained that, “It’s kinda the best compliment when nobody says anything. The best IT team is the one that you don’t know you have.”

Thursday, 23 July 2020

Hot off the press: Introducing OpenConfig Telemetry on NX-OS with gNMI and Telegraf!

Transmission and Telemetry


The word transmission may spark different thoughts in each of us. We may think about transmission of electromagnetic waves from transmitter to receiver like in a radio or television. Perhaps we think of automobile transmission. In the world of networking, transmission commonly refers to transmitting and receiving packets between source and destination. This brings us to the focus of this article – transmission of telemetry data.

I am excited to share a few new developments we have in the area, especially with streaming telemetry on Nexus switches. Telemetry involves the collection of data from our switches and their transmission to a receiver for monitoring. The ability to collect data in real time is essential for network visibility, which in turn helps in network operations, automation and planning. In this article, we introduce gNMI with OpenConfig that is used to stream telemetry data from Nexus switches. We also introduce the open source time series data collection agent, Telegraf, which is used to consume our telemetry data. The word telegraph, as some may recall, was a system for transmitting messages from a distance along a wire. Let us take a look at our modern take on it, and how far we have come from Morse codes to JSON encoding!

Evolution of gRPC, gNMI and OpenConfig on our switches


There are different network configuration protocols available on Cisco Nexus switches, including NETCONF, RESTCONF and gNMI. All of these protocols use YANG as a data model to manipulate configuration and state information. Each of these protocols can use a different encoding and transport. For the purposes of this article, we will be focusing on gRPC Network Management Interface (gNMI) which leverages the gRPC Remote Procedure Call (gRPC) framework initially developed by Google. gNMI is a unified management protocol for configuration management and streaming telemetry. While NETCONF and RESTCONF are specified by the IETF, the gNMI specification is openly available at the OpenConfig GitHub account.

Cisco Nexus switches introduced telemetry over gRPC using a Cisco proprietary gRPC agent in NX-OS Release 7.x. The agent called “gRPCConfigOper” was used for model-driven telemetry. This was based on a dial-out model, where the switch pushed telemetry data out to telemetry receivers.

With NX-OS Release 9.3(1), we introduced a gNMI agent which also offers a dial-in subscription to telemetry data on the switch. This allowed a telemetry application to pull information from a switch with a Subscribe operation. The initial implementation of gNMI Subscribe was based on the Cisco Data Management Engine (DME) or device YANG which is specific to Cisco Nexus switches.

In order to have a fully open gNMI specification, we added OpenConfig support with gNMI. gNMI defines the following gRPC operations: CapabilityRequest, GetRequest, SetRequest and SubscribeRequest. Cisco NX-OS Release 9.3(5) supports the complete suite of gNMI operations with Capability, Subscribe, Get and Set using OpenConfig. Cisco NX-OS 9.3(5) is based on gNMI version 0.5.0.

While these may seem like incremental enhancements, that is far from the case. This new method of telemetry enables us to stream telemetry to multiple collectors, both in-house as well as within the open source community, as we will see in this article.

Telemetry on Cisco Nexus Switches


The two methods of streaming telemetry described above can be implemented by enabling specific features globally on Cisco Nexus switches.

◉ Dial-out telemetry is enabled with “feature telemetry”.
◉ Dial-in telemetry with gNMI is enabled with “feature grpc”.


Telegraf


Telegraf is an open-source server agent used for collecting and reporting metrics and events. It was developed by the company InfluxData. It uses various input plugins to define the sources of telemetry data that it receives and processes. It uses output plugins which control where it sends the data, such as to a database. With the appropriate input plugins in place, Telegraf is able to subscribe to a switch or switches and collect telemetry data over gNMI or other protocols. It can send this data to a time series database called InfluxDB. The data can then be rendered with an application called Chronograf. The different components are summarized below:

◉ Telegraf: a server agent for collecting and reporting metrics

◉ InfluxDB: a time series database

◉ Chronograf: a GUI (graphical user interface) for the InfluxData platform which works on templates and libraries

◉ Kapacitor: a data-processing engine

In my example below, I’ve leveraged the first three components of the stack for viewing telemetry data. Cisco has released specific plugins for gNMI and MDT (model-driven telemetry) for Telegraf which are packaged along with the product.

How can I get it to work?


Step 1: Set up your environment

In the example below, the setup is entirely virtual and is built with just two devices: A Nexus 9300v switch running 9.3(5) and an Ubuntu server running 18.04 LTS. You could set up the same environment with any Nexus switch with reachability to a host.

Cisco Prep, Cisco Tutorial and Material, Cisco Exam Prep, Cisco Guides, Cisco Certification

Nexus 9000 Telemetry using gNMI with Telegraf

The Nexus 9300v is a new ToR (Top-of-Rack) simulation of the Nexus 9000 series switches that can be used as a virtual appliance with VMware ESXi/Fusion, Vagrant or KVM/QEMU. It requires no licenses and can be used for demo or lab purposes to model a Nexus 9000 environment. In this example, I used an OVA to deploy my switch on a VMware ESXi host. Once the installation is complete and the switch can be accessed over console or SSH, the appropriate RPM packages for OpenConfig need to be installed on the switch, which can be downloaded from the Cisco Artifactory portal, under “open-nxos-agents”.

After the file “mtx-openconfig-all-<version>.lib32_n9000.rpm” is copied onto the switch bootflash, it needs to be installed on the switch as below:

n9300v-telemetry# install add mtx-openconfig-all-1.0.0.182-9.3.5.lib32_n9000.rpm activate 
Adding the patch (/mtx-openconfig-all-1.0.0.182-9.3.5.lib32_n9000.rpm)
[####################] 100%
Install operation 1 completed successfully at Fri Jul  3 02:20:55 2020

Activating the patch (/mtx-openconfig-all-1.0.0.182-9.3.5.lib32_n9000.rpm)
[####################] 100%
Install operation 2 completed successfully at Fri Jul  3 02:21:03 2020

n9300v-telemetry# show version
<---snip--->
Active Package(s):
 mtx-openconfig-all-1.0.0.182-9.3.5.lib32_n9000
n9300v-telemetry# 

Step 2: Configure your server with Telegraf

There are two ways to install Telegraf. One method would be to install Telegraf, InfluxDB and Chronograf within Docker containers on the host. The other method is to install them natively on the host using the Telegraf repository to install the component packages. This is the method that I followed in my example. There are many tutorials available for Telegraf installation, so I will reference the InfluxData documentation for this step. Once the services have been installed, you can verify their operational status or start/stop/restart services the using the following commands.

systemctl status telegraf
systemctl status influxdb
systemctl status chronograf

The two plugins cisco_mdt_telemetry (the Cisco model-driven telemetry plugin) and gnmi (the Cisco gNMI plugin) are integrated into the Telegraf release, and no specific configuration is required to install them. The cisco_mdt_telemetry plugin is based on dial-out telemetry or a push model. The gnmi plugin is based on dial-in telemetry or a pull model, which is what we explore in this example.

Step 3: Configure your switch

Telemetry using gRPC and gNMI can be enabled by the command “feature grpc”. The other gRPC configuration is summarized below.

n9300v-telemetry# show run grpc

!Command: show running-config grpc
!No configuration change since last restart
!Time: Tue Jul 14 16:56:37 2020

version 9.3(5) Bios:version  
feature grpc

grpc gnmi max-concurrent-calls 16
grpc use-vrf default
grpc certificate gnmicert

n9300v-telemetry# 

The max-concurrent-calls argument applies specifically to the new gNMI service and allows a maximum of 16 concurrent gNMI calls. The gRPC agent serves only the management interface by default. Adding the “use-vrf default” command allows it to accept requests from both the management and the default VRF.

Optionally, we can also configure gNMI to use a specific port for streaming telemetry. The default port is 50051.

n9300v-telemetry(config)# grpc port ?
    Default 50051

Telemetry with gNMI uses TLS certificates to validate the client-server communication. In my example, I used a self-signed certificate and uploaded it onto the server and the switch. The gNMI/gRPC agent on the switch is then set to honor the certificate. On the server side, the Telegraf configuration file (covered in the next section) is set to point to the certificate.

For the switch side of the configuration, the configuration guide covers the required steps. There are two methods that can be followed. The first method is available in older releases and consists of copying the .pem file onto bootflash and manually editing the gRPC configuration file to use the .pem and .key file.

The second method was introduced with NX-OS Release 9.3(3) and is our recommended way of installing certificates. It consists of generating a public and private key pair and embedding them in a certificate that is associated with a trustpoint. The trustpoint is then referenced in the grpc certificate command above.

n9300v-telemetry# run bash sudo su
bash-4.3# cd /bootflash/
bash-4.3# openssl req -newkey rsa:2048 -nodes -keyout gnmi.key -x509 -days 1000 -out gnmi.pem
bash-4.3# openssl pkcs12 -export -out gnmi.pfx -inkey gnmi.key -in gnmi.pem -certfile gnmi.pem -password pass:abcxyz12345
bash-4.3# exit
n9300v-telemetry(config)# crypto ca trustpoint gnmicert
n9300v-telemetry(config-trustpoint)# crypto ca import gnmicert pkcs12 gnmi.pfx abcxyz12345 
n9300v-telemetry(config)# grpc certificate gnmicert

The certificate can be verified using the command “show crypto ca certificates”. In my example, I copied the public key gnmi.pem from the switch bootflash to the host running Telegraf into the default configuration folder /etc/telegraf.

Step 4: Edit the configuration file in Telegraf

Now we get to the key piece of the puzzle. Telegraf uses input and output plugins. The output plugins are a method for sending data to InfluxDB. The input plugins are used to specify different sources of telemetry data that Telegraf can subscribe to receive data from, including our Cisco Nexus switch.

Here is the configuration for the output plugin. We ensure that we are pointing to our server IP address, and setting up a database name and credentials for InfluxDB. This information will be fed into Chronograf.

Most of the fields are left as default, but a few parameters are edited as seen below.

# Configuration for sending metrics to InfluxDB
[[outputs.influxdb]]
   urls = ["http://172.25.74.92:8086"]
   database = "telemetrydb"
   username = "telemetry"
   password = "metrics"

Here is the configuration for the input plugin, where we enter our switch details. Cisco has released two plugins with Telegraf, the MDT plugin and the gNMI plugin. For this exercise, we will be focusing on the gNMI plugin which is integrated into Telegraf when you install it. Note that our path specifies an origin of “openconfig”. The other options are to use device or DME as the origin and path for our gNMI subscription. The encoding can also be specified here. Please see the Cisco Nexus Programmability Guide for supported encoding formats with gNMI for the release you are working with. The examples below reference the plugin “cisco_telemetry_gnmi” which has since been renamed to “gnmi” in future Telegraf releases since it works with other vendors that support gNMI.

 [[inputs.cisco_telemetry_gnmi]]
  ## Address and port of the GNMI GRPC server
  addresses = ["172.25.74.84:50051"]
  #  addresses = ["172.25.238.111:57400"]
  ## define credentials
  username = "admin"
  password = "abcxyz12345"

  ## GNMI encoding requested (one of: "proto", "json", "json_ietf")
   encoding = "proto"

  ## enable client-side TLS and define CA to authenticate the device
   enable_tls = true
   tls_ca = "/etc/telegraf/gnmi.pem"
   insecure_skip_verify = true

[[inputs.cisco_telemetry_gnmi.subscription]]
 ## Name of the measurement that will be emitted
 name = "Telemetry-Demo"

 ## Origin and path of the subscription
    origin = "openconfig"
    path = "/interfaces/interface/state/counters"

Step 5: Set up Chronograf and start Telegraf

Browse to your server IP port 8888 to see the beautiful view of your time series telemetry data! Chronograf can be accessed as shown in the picture below. The settings icon on the left will need to be used to point to the InfluxDB database that you selected in the output plugin section of your Telegraf configuration file.

Cisco Prep, Cisco Tutorial and Material, Cisco Exam Prep, Cisco Guides, Cisco Certification
Chronograf with a connection to InfluxDB

In Step 4 where we edit the Telegraf configuration file in the folder /etc/telegraf on the host, I created a new configuration file that I edited so as not to modify the original configuration file. I called this file telegraf_influxdb.conf. When I start telegraf, I can do so by specifying this particular configuration file. As you can see below, the cisco_telemetry_gnmi plugin (later renamed to gnmi) is loaded.

dirao@dirao-nso:/etc/telegraf$ sudo /usr/bin/telegraf -config /etc/telegraf/telegraf_influxdb.conf -config-directory /etc/telegraf/telegraf.d/
[sudo] password for dirao: 
2020-07-15T00:33:54Z I! Starting Telegraf 1.14.4
2020-07-15T00:33:54Z I! Loaded inputs: cisco_telemetry_gnmi
2020-07-15T00:33:54Z I! Loaded aggregators: 
2020-07-15T00:33:54Z I! Loaded processors: 
2020-07-15T00:33:54Z I! Loaded outputs: influxdb file
2020-07-15T00:33:54Z I! Tags enabled: host=dirao-nso
2020-07-15T00:33:54Z I! [agent] Config: Interval:10s, Quiet:false, Hostname:"dirao-nso", Flush Interval:10s
{"fields":{"in_broadcast_pkts":0,"in_discards":0,"in_errors":0,"in_fcs_errors":0,"in_multicast_pkts":0,"in_octets":0,"in_unicast_pkts":0,"in_unknown_protos":0,"out_broadcast_pkts":0,"out_discards":0,"out_errors":0,"out_multicast_pkts":0,"out_octets":0,"out_unicast_pkts":0},"name":"Telemetry-Demo","tags":{"host":"dirao-nso","name":"eth1/14","path":"openconfig:/interfaces","source":"172.25.74.84"},"timestamp":1594773287}
{"fields":{"penconfig:/interfaces/interface/name":"eth1/14"},"name":"openconfig:/interfaces","tags":{"host":"dirao-nso","name":"eth1/14","path":"openconfig:/interfaces","source":"172.25.74.84"},"timestamp":1594773287}
{"fields":{"in_broadcast_pkts":0,"in_discards":0,"in_errors":0,"in_fcs_errors":0,"in_multicast_pkts":0,"in_octets":0,"in_unicast_pkts":0,"in_unknown_protos":0,"out_broadcast_pkts":0,"out_discards":0,"out_errors":0,"out_multicast_pkts":0,"out_octets":0,"out_unicast_pkts":0},"name":"Telemetry-Demo","tags":{"host":"dirao-nso","name":"eth1/9","path":"openconfig:/interfaces","source":"172.25.74.84"},"timestamp":1594773287}

Step 6: Verify and Validate gNMI on the switch

Verify gNMI/gRPC on the switch as below to check the configured gNMI status with certificate registration and to verify that the gNMI subscription was successful.

n9300v-telemetry# show grpc gnmi service statistics 

=============
gRPC Endpoint
=============

Vrf            : management
Server address : [::]:50051

Cert notBefore : Jul 10 19:56:47 2020 GMT
Cert notAfter  : Jul 10 19:56:47 2021 GMT

Max concurrent calls            :  16
Listen calls                    :  1
Active calls                    :  0

Number of created calls         :  4
Number of bad calls             :  0

Subscription stream/once/poll   :  3/0/0

Max gNMI::Get concurrent        :  5
Max grpc message size           :  8388608
gNMI Synchronous calls          :  0
gNMI Synchronous errors         :  0
gNMI Adapter errors             :  0
gNMI Dtx errors                 :  0
<---snip--->
n9300v-telemetry#  

n9300v-telemetry# show grpc internal gnmi subscription statistics  | b YANG
1              YANG                 36075             0                 0       
         
2              DME                  0                 0                 0       
         
3              NX-API               0                 0                 0          
<---snip--->

Note the output above showing the gRPC port number and VRF in use. It also shows that the certificate is installed successfully with the dates of the Cert being indicated. The second command output shows hits on the statistics for YANG every time we have a successful gNMI subscription, since gNMI uses the underlying YANG model.

Step 7: Visualize time-series telemetry data on Chronograf

Navigate to the measurement you specified in your Telegraf configuration file, and enjoy your new graphical view on Chronograf!

Cisco Prep, Cisco Tutorial and Material, Cisco Exam Prep, Cisco Guides, Cisco Certification
Chronograf – Setting up queries and parameters to monitor

Cisco Prep, Cisco Tutorial and Material, Cisco Exam Prep, Cisco Guides, Cisco Certification
Chronograf – Interface counter graphs and packet counts on time series view

The above output shows interface statistics collected by gNMI for unicast packets in and out of a particular interface that has traffic going on it. The data can be viewed and further modeled using queries to make it more granular and specific.

Source: cisco.com

Wednesday, 22 July 2020

Helping to keep employees safe by measuring workspace density with Cisco DNA Spaces

Cisco Tutorial and Material, Cisco Exam Prep, Cisco Study Material, Cisco DNA

Employee safety is top of mind as pandemic lockdowns ease and we gradually welcome employees back to the office. We’ll bring back employees in waves, starting with the 20-30% of employees whose jobs require them to be in the office, like engineers with hands-on responsibilities for development, testing, and operations. Before allowing additional employees to return, our Workplace Resources team wants to make sure the first employees are practicing social distancing—not standing or sitting too close or gathering in large groups.

We needed a solution quickly, which sped up our plans to adopt Cisco DNA Spaces. It’s a cloud-based, indoor location services platform that turns existing wireless networks into a sensor.

Quick deployment


Cisco DNA Spaces is a cloud solution. We deployed the connectors, which run on virtual machines, in about a day. Connectors retrieve data from our wireless LAN controllers, encrypt personally identifiable information, and then send the data on to Cisco DNA Spaces. Provisioning accounts in the cloud took just a few hours. Adding buildings took just minutes to add to Cisco DNA Spaces, as did uploading building maps. In total, we were able to onboard multiple sites in just two days and extend to production sites in four. That gave us time to vet the use case with Workplace Resources and collaborate with Infosec on data privacy and security.

Measuring workspace density to adjust the pace of return


To date, Cisco DNA Spaces is used for ten branch offices and three campus locations in the United States and Asia, with many more planned and underway.

Workplace Resources will use Cisco DNA Spaces to see where people gather and at what times. Based on that data, Workplace Resources will take actions such as increasing or reducing the number of employees on site, closing or opening certain areas of the building, posting signage, etc. After taking an action Workplace Resources can check the Cisco DNA Spaces App to make a data-based decision on whether to invite more employees back—or pause. A colleague compared the approach to turning the faucet on or off.

We receive alerts when density or device count in a certain area exceeds our thresholds, using the DNA Spaces Right Now App. It shows wireless density in near real-time, for a site, building, floor, or zone (Figure 1).

Cisco Tutorial and Material, Cisco Exam Prep, Cisco Study Material, Cisco DNA

Figure 1. Right Now App dashboard

Respecting privacy—no names


When employees return to the office, they’ll use a mobile app to attest that they don’t have a fever or other symptoms before they are allowed into the facility. Then they’ll badge in and use Wi-Fi as they would ordinarily. No change to the user experience.

The change is that Wi-Fi data we’ve always collected now feeds the analytics (real-time and historical) in Cisco DNA Spaces. As people move around the building throughout the day, Cisco DNA Spaces plots the location of devices connected to Wi-Fi (Figure 2). To respect employee privacy, we capture device location only—not the owner’s name or any other personally identifiable information. As an example, we can see that three people were in the break room from 3:00 p.m. – 3:45 p.m., but not who they are.

Another one of our suggestions as Customer Zero was making it easier to define zones, or specified areas of a floor. Workplace Resources finds it more useful to monitor density by zone rather than an entire floor or building. Other potential improvements have also been detailed by Cisco IT to the product management teams responsible for the DNA Spaces solution. Including various potential enhancements and new features, which in time will hopefully automate a number of currently manual tasks, expand APIs, and hopefully offer other benefits not only to Cisco IT, but other customers as well.

Cisco Tutorial and Material, Cisco Exam Prep, Cisco Study Material, Cisco DNA

Figure 2. Cisco DNA Spaces shows where people gather in groups

Getting an accurate count


While Cisco DNA Spaces gives us a good idea of density, we keep in mind there’s a margin of error. For example, wireless location data can be accurate to within about three meters. So it might appear that people are maintaining social distancing when they aren’t—or vice versa. Also, two connected devices in a room doesn’t necessarily mean two people. One person might be using two connected devices. Or there might be three people, one whose device isn’t connected to Wi-Fi.

To make our density estimates more accurate, for the first few buildings to re-open, Workplace Resources is correlating Cisco DNA Spaces data with badge-in data. If 20 people badge into a building and Cisco DNA Spaces reports 60 devices, for example, we’ll estimate one person for every three devices shown.

Lesson learned: accurate floor maps are important


During initial rollout we realized that some of our floor plans were inaccurate because of “drift.” That is, over time, the floor plans tend to diverge from access point placement data. In buildings where we’d recently upgraded infrastructure, the maps are accurate and include the height and azimuth of the access points. That’s not the case for buildings that haven’t been refreshed for a while. Cisco IT and Workplace Resources are currently updating the maps for sites where accurate information is important to plan a return to the office at a safe pace.

Before we return: checking office network health


As part of our return-to-office process, we’re evaluating each location against a readiness checklist. One item is network readiness.  While sheltering in place, Cisco IT staff has been turning on Cisco DNA Assurance in more locations. On one pane of glass we can see a holistic view of the health of all wired and wireless infrastructure in a given building. During the lockdown we’ve been keeping a to-do list of hands-on tasks—e.g., re-patching cables—to complete before employees return to the office.

More plans for Cisco DNA Spaces


Bringing employees back to the office at a safe pace was our incentive to deploy Cisco DNA Spaces.  We in Cisco IT eagerly implemented it via our Customer Zero program, which involves road testing new Cisco products or using existing ones in new ways.  As Customer Zero we help improve a solution by giving feedback to product engineers about bugs, additional features, and the user experience.

Later we’ll use Cisco DNA Spaces in new ways—for instance, showing the closest unoccupied conference room, tracking the movement of things in our supply chain, and tracking janitorial services. This will help us know where we have cleaned recently and ensure efficiency and effectiveness based on usage of the space.

Tuesday, 21 July 2020

ACI Gets Support for Segment Routing on MPLS

I’m pleased to announce that Cisco’s Application Centric Infrastruture (ACI) version 5.0 introduces support for Segment Routing on Mulitprotocol Label Switching (SR-MPLS). This will make it easier for service provider architects to roll out new 5G networks quickly, while meeting strict service-level agreements.

With this new feature, service providers can roll out 5G networks using Segment Routing as the data plane — all the way from their data centers, across the transport network, and to the edge. Using a single data plane across an entire wide-area network empowers service provider architects to design more efficient and flexible 5G networks. Also, a single data and control plane across data center and transport makes it easier for operations teams to maintain networks.

Powering Service Providers with ACI


Many of our service provider customers are using Cisco ACI to streamline operations for distributed central, regional, and edge data centers; and to build new distributed, 5G-ready telecom data centers. ACI provides consistent policy, automation, and telemetry, in addition to intelligent service chaining.

When building the 5G transport domains, many service providers use a SR-MPLS handoff, from service provider data center, across the transport, to the provider data center edge. ACI’s SR-MPLS feature offers the potential for dramatically simpler automation, through consistent policy applied end-to-end.

SR-MPLS handoff is supported directly in ACI 5.0. The handoff solution works in any data center topology, including ACI multi-site, ACI multi-pod, and remote leaf. It also improves day-2 operations by simplifying the network from their data center to the 5G edge.

Here are some key ways we leverage SR-MPLS handoff in ACI 5.0:

Unified SR-MPLS transport


ACI was built to solve data center challenges, such as workload mobility, and integration with different types of virtual environments — such as VMware, Microsoft and KVM Hypervisors for OpenStack, as well as container workloads — to support automation and visibility.  ACI uses a VXLAN data plane within the fabric. Many SP transport networks are built using an SR-MPLS data plane. An SR-MPLS data center handoff allows service providers to use a single data plane protocol on their transport devices.

Cisco Prep, Cisco Tutorial and Material, Cisco Learning, Cisco Exam Prep, Cisco Learning

Traditionally the handoff from the ACI fabric was done either with native IP or with VXLAN. In these cases, the transport devices needed to support VXLAN, and the handoff had to be manually configured. With SR-MPLS handoff in ACI, service provder customers no longer have to worry about supporting VXLAN, nor manually configuring an IP handoff on their transport devices.

A new automated and scalable data center handoff


To provide connectivity from the data center to the transport or external device, an IP handoff from the data center requires a separate interface and routing protocol for each virtual routing and forwarding (VRF) instance. This type of connectivity is referred to as a VRF-lite. At a service provider or in a large enterprise environment there might be many VRFs deployed. Creating separate sub-interfaces and routing protocol adjacencies for each VRF causes automation and scale issues.

Cisco Prep, Cisco Tutorial and Material, Cisco Learning, Cisco Exam Prep, Cisco Learning

But with SR-MPLS handoff, a single BGP EVPN session can exchange information about all prefixes and all VRFs, instead of having a routing protocol session and sub-interface for each VRF. This leads to better scalability and simplified automation.

Cisco Prep, Cisco Tutorial and Material, Cisco Learning, Cisco Exam Prep, Cisco Learning

Consistent policy across data center and transport


Customers can simply advertise a BGP color community for a prefix from the ACI Border Leaf (BL) and use the community on the Provider Edge (PE) to define an SR policy in the transport. Allowing this mapping between the data center and transport provides better automation and policy consistency across the domains. The following diagram shows how to achieve this.

Cisco Prep, Cisco Tutorial and Material, Cisco Learning, Cisco Exam Prep, Cisco Learning

Another option to achieve consistent policy end-to-end is to mark packets with specific DSCP or EXP values when they leave the data center, and use these values in the transport to define SR policies. The following diagram shows how.

Cisco Prep, Cisco Tutorial and Material, Cisco Learning, Cisco Exam Prep, Cisco Learning

Lastly, if the transport doesn’t support BGP color community or SR policies based on DSCP/EXP values, customers can define prefix-based SR policies based on prefixes advertised by the ACI fabric using the BGP EVPN session between border leaf and the data center-provider edge.