Thursday, 13 September 2018

What is SD-WAN?

The SD-WAN market is in high gear. The concept is solid and the benefits are real. There are, in fact, very few WAN situations that would not benefit greatly from this technology. However, all SD-WAN is not the same. There are multiple paths you choose as you endeavor to take your existing, running, trusted network…to a brand new modern one.

What is SD-WAN?


The primary value proposition for SD-WAN centers on the high cost of traditional WAN. As the internet has grown, it has become easier (and cheaper) to get broadband internet circuits just about anywhere. For many users, high speed bandwidth was no longer a benefit of driving to the office. I has become harder to explain why we had to build the networks that we did and as traffic patterns have migrated cloud-wise, these designs are showing their age.

More Options. Less Complexity.


MPLS has been the dominant form of enterprise WAN over the past few decades but it finally has a very viable competitor in SD-WAN. MPLS circuits provide a dedicated network that is completely distinct from any other network. Every remote connection has a specifically sized circuit delivered to them so you know exactly how much bandwidth you get at each site…it is all very predictable. Which is important. If any location needs to access ‘the internet’ than this is commonly done by routing that connection through a central office which has big pipes to the internet and various security mechanisms for filtering it.

Two big issues have come out of this:

1. All internet traffic from branch sites is using those precious/expensive MPLS in two directions. This is secure….but wasteful.

2. Internet use is rising fast along with it’s business critical nature with multiple Saas or IaaS resources are now used by the entire enterprise.

Enterprise IT has long been able to connect to the Internet directly from any remote office. This is not a new idea. It just came with too much risk.

SD-WAN is now offering a credible option for enabling a secure ‘hybrid’ WAN. The hybrid is a reference for how SD-WAN is here to augment, not necessarily replace those expensive MPLS circuits with a less expensive broadband internet.

There will be multiple, physical circuit terminations into the same edge point. Does the vendor have hardware routing experience? Some locations may need an MPLS line, pus two different sources of Internet connectivity. If it’s a really critical area, consider adding cellular failover, 4G LTE or other wireless that might be available. Make sure you can run active/active on those cabled circuits as well so that you are not paying for something ‘just in case.’

When SD-WAN is done right, it should offer a simplified ability to route enterprise traffic in a secure manner with a consistent quality of experience that is as good or better than what you are doing now.

If you are considering an SD-WAN solution, there are quite a few options in the market. Here is my shortlist for things you should make sure you dig into with any option under consideration:

1. Simplicity – the software defined part of SD-WAN refers to the control portion of your routers now being handled somewhere else. This is generally a cloud based that you access with what is hopefully a simple interface. Couple of quick things to check for here:

◈ Does the controller HAVE to be in the cloud? You may run a network that does not allow for this…make sure you know what you can do.

◈ Is ALL the policy control handled through this same interface? How granular can it get? You should be able to define and manage unique policies for every remote location down to the individual application requirements. Set it and forget it.

Cisco SD-WAN, Cisco Guides, Cisco Learning, Cisco Tutorial and Material, Cisco Study Material

2. Security should be more than a passing mention to IPsec encryption.

◈ Check for how security is being handled across three dimensions: encryption, authentication and integrity. Zero-trust models are the goal but make sure that it’s not just a marketing term.

◈ The ease of bringing new sites onto the network is a common benefit. Ask what security is in place when doing this. Remote connections back to the centralized controller should have an authorization process that precedes any traffic flows.

◈ Security is very personal, unique to every organization. Make sure you like the options available for expanding security controls outside of the ones provided by your SD-WAN vendor.

◈ This move to SD-WAN is being driven by the incredible growth of cloud based applications we all now depend on. Security controls need to extend to these services as well..striking that balance between ‘secure connection’ and ‘most optimal route.’

◈ SD-WAN brings a lot of flexibility we have not had before. Take fully meshed connections for example. These were once too complex to configure in most situations. Dynamic, policy based routing should be easy for SD-WAN such that performance remains aligned with security. There should be no trade-offs here.

Cisco SD-WAN, Cisco Guides, Cisco Learning, Cisco Tutorial and Material, Cisco Study Material

3. Quality of Experience – as opposed the ease of use pointer above, this QoE mention is really about the controls and design in place that benefit the end-user.

◈ The internet is still not controllable in the same sense as a private network. However, there are quite a few things that can now be done to minimize this. Hybrid network connectivity, combined with granular controls should allow for policies that can dictate the conditions under which an MPLS path might be chosen. This is a new middle ground option that previously did not exist. The idea is that your SD-WAN implementation should allow you to reduce the size of your MPLS circuits (which reduces operating costs) because you have policies that say that certain applications may work just fine over the internet ‘most of the time.’ What you want is a real time measurement that can choose that MPLS route for a specific conversation at a specific time…because the network is smart enough to pull it off.

◈ Non-core applications are generally the first to move to the cloud model. HR, scheduling, administrative stuff, these have become SaaS applications like Office 365 and Salesforce for example. User experience will vary by the state of multiple things that constantly change: from the internet gateway on one end, all the through to the hosting location on the other. How is this variation measured and then used to optimize the routing path?

Track Record


There are no shortage of SD-WAN vendors right now. This is truly where WAN networking is going, it is not a fad of any sort. But as much as networking changes, it still remains the same. Don’t overlook the importance of a good track record in both networking and security. Most vendors seem to have some experience in one but are then partnering for the other. Partnerships are hard. We do it. But if any one element that is important to you, is being handled through a partnership…make sure you are comfortable with how that will work for you if something goes awry. This is your network after all…everything and everyone is impacted.

Don’t run towards SD-WAN ONLY because it offers tremendous cost savings when compared to your private lines. There should be no increased risk or settling for sub-standard control options. SD-WAN is a technology your network should aspire to with better security, better visibility, control and ease of use. It’s all here and it’s fun to show off.

Wednesday, 12 September 2018

The Role of Visibility in SecOps

The bad guys aren’t going away.  In fact, they are getting smart, more creative, and just as determined to wreak havoc for profit as they have ever been.  The good news is Security solutions and methodologies are getting better.  Next Generation Firewalls, Malware Protection, and Access Control are not only improving, but in some cases, working in concert together.   This is good news for any security team and a lot of these solutions are part of any security stack.

But how do you know when you have been breached?  How long has that attack been roaming through the network?  Who is affected?  These are the questions that visibility helps answer.  Access Control solutions are now commonplace in letting us know the “Who”, “What”, “Where”, and “When”.  Now we need to know the “How” and “Why”.  We need to know these answers not just for the network, but for our Cloud solutions as well.

Visibility into the Conversation


Learning what “normal” behavior looks like is a great place to start. Knowing how hosts behave and interact allows you to react quickly when a host deviates from the norm.  Stealthwatch provides visibility into every conversation, baselines the network, and alerts to changes.  Not all changes are bad and this level of insight will also provide critical information for network planning.

Cisco Stealthwatch Cloud, Advanced Malware Protection, Security, Cisco Study Materials

Visibility into the Files


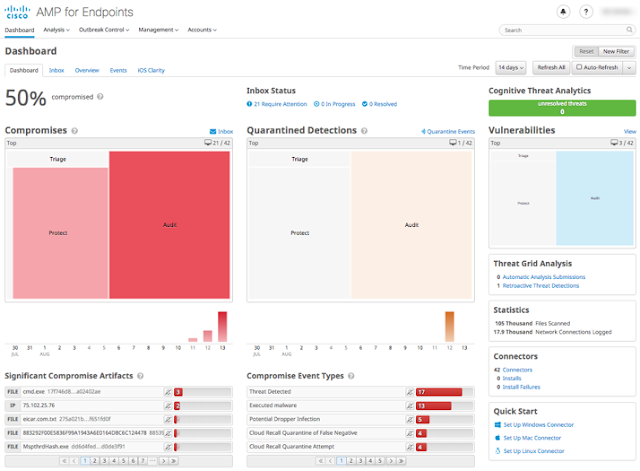
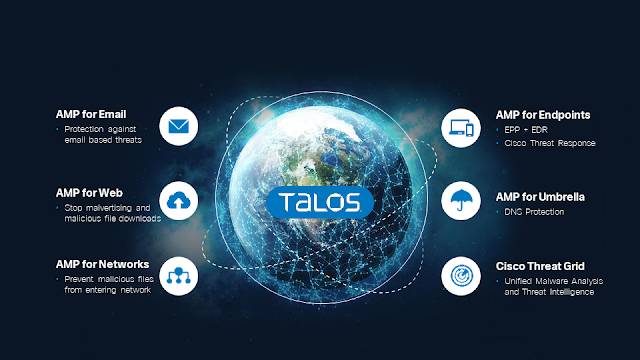
Since malware began, there has been a need to inspect files to ensure that they have not been compromised or the source of corruption themselves.  A downloaded file that was benign yesterday could morph into something detrimental tomorrow.  Advanced Malware Protection (AMP) does retrospective analysis such that it doesn’t just inspect a file once and moves on.  It has the ability to look back in time and see exactly when and how a file changed, what it did, who it effected.  Additionally, a file discovered to be malicious on one machine can be quarantined and an update can be sent to all machines that prevents them from ever even opening that file, now limiting the exposure to the rest of the network.

Cisco Stealthwatch Cloud, Advanced Malware Protection, Security, Cisco Study Materials

Visibility into the Threats


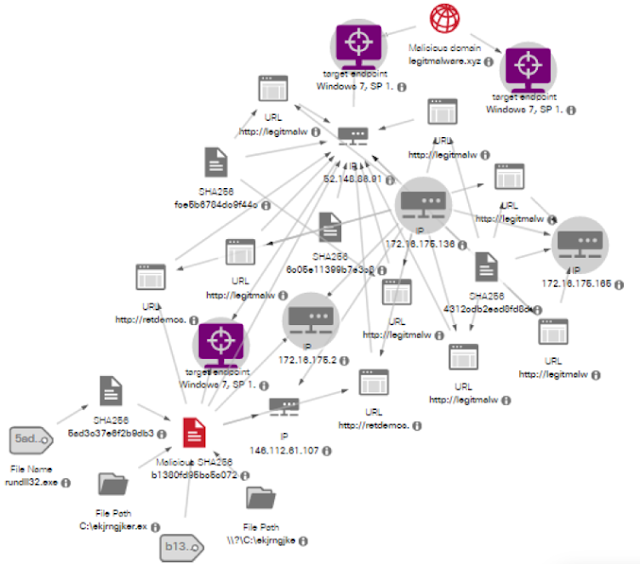
Since it’s not a matter if a breach will occur, but when, the ultimate goal is to limit exposure and remove the threat as quickly as possible.  Threat hunting is costly, time consuming, and necessary in getting operations back to normal.  Knowing where to begin, determining the impact, removing the threat, and ultimately protecting against it from happening again is a challenge in of itself.  The longer the threat is in the network, the more damage it will do.  AMP Visibility helps in finding the threats quickly, identifying those effected, and eliminating the threat faster than ever.  Visibility displays the entire path of the malicious event, including URL, SHA values, file information, and more.  This information effectively reduces the time spent threat hunting.

Cisco Stealthwatch Cloud, Advanced Malware Protection, Security, Cisco Study Materials

Visibility into the Internet


We are also constantly being misled and misdirected to go to sites that we shouldn’t.  Whether it’s as simple as a fat-finger or being intentionally misled, anyone can easily end up in a very dark place.  Embedded links within an email that appears legitimate brings our guard down.  The first URL you click on may be OK (think reddit.com ) but what happens as you go deeper?  Should your employees be allowed to click on a link that is two hours old?  How can I protect my employees when they are off-net?  These are questions asked every day.  Cisco Umbrella is built into the foundation of the Internet and as a DNS service, endpoints can be protected both on and off-net.  Umbrella’s Investigate lets you explore deeper into the URL to get a complete picture of everything; from where the site is hosted, who owns it, it’s reputation, and even Threat scores via integrations with AMP’s Threat Grid.  Umbrella’s view of the Internet can prevent up to 90% of threats from ever making it to the endpoint, thus making the rest of the security stack that much more efficient.

Visibility is the Key!


The bad guys only need to be successful at breaching the network once.  The good guys need to be successful EVERY time.  Firewalls, Intrusion Detection, Endpoint protection, and other security solutions are critical in handling 99% of the risks.  That’s a great number.  It’s that 1% that gets through that keeps security people awake at night and is going to cause the most harm.  Having the ability to see not just the north-south traffic, but the east-west, is vital to detecting anomalies early.  When there is an event that requires research, reducing the time it takes to get to the bottom of it and ultimately eliminating the threat quickly keeps business humming optimally.

Saturday, 8 September 2018

Deploying Stealthwatch Cloud in a Google GKE Kubernetes Cluster

Cisco Stealthwatch Cloud has the unique ability to provide an unprecedented level of visibility and security analytic capabilities within a Kubernetes cluster. It really doesn’t matter where the cluster resides, whether on-premise or in any public cloud environment. Stealthwatch Cloud deploys as a daemonset via a yaml file on the cluster master node, ensuring that it will deploy on every worker node in the cluster and both expand and contract as the cluster’s elasticity fluctuates. It’s very simple to configure this and once it’s configured, the sensor will deploy with each node and ensure full visibility into all node, pod and container traffic. This is done via deploying with a host-level networking shim that ensures full traffic visibility into every packet that involves any container, pod or node.

How’s this done? In this guide I’m going to walk you through how to deploy Stealthwatch Cloud within the Google Cloud Kubernetes Engine or GKE.  I’m choosing this because its incredibly simple to deploy a K8s cluster for labbing purposes in a few minutes in GKE, which will allow us to focus our attention on the nuts and bolts of deploying Stealthwatch Cloud step by step into an existing K8s cluster.

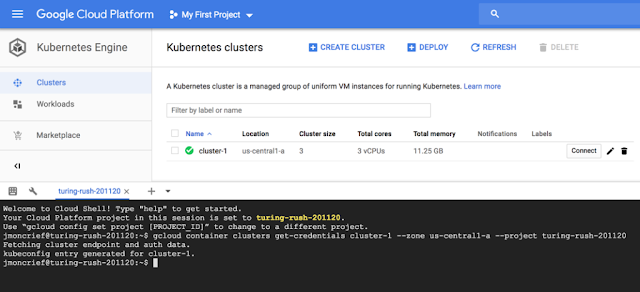
The first step is to login to the GKE utility within your Google Cloud Platform console:

Security, Kubernetes, Security Analytics, Cisco Stealthwatch, Cisco Stealthwatch Cloud

Create your cluster:

Security, Kubernetes, Security Analytics, Cisco Stealthwatch, Cisco Stealthwatch Cloud

Security, Kubernetes, Security Analytics, Cisco Stealthwatch, Cisco Stealthwatch Cloud

Click Connect to get your option to connect using the built-in console utility. Click the option for “Run in Cloud Shell”:

Security, Kubernetes, Security Analytics, Cisco Stealthwatch, Cisco Stealthwatch Cloud

Click Start Cloud Shell:

Security, Kubernetes, Security Analytics, Cisco Stealthwatch, Cisco Stealthwatch Cloud

You will now be brought into the GKE Cloud Shell where you can now fully interact with your GKE Kubernetes cluster:

Security, Kubernetes, Security Analytics, Cisco Stealthwatch, Cisco Stealthwatch Cloud

You can check  the status of the nodes in your 3-node cluster by issuing the following command:

kubectl get nodes

Security, Kubernetes, Security Analytics, Cisco Stealthwatch, Cisco Stealthwatch Cloud

You can also verify that there are currently no deployed pods in the cluster:

kubectl get pods

Security, Kubernetes, Security Analytics, Cisco Stealthwatch, Cisco Stealthwatch Cloud

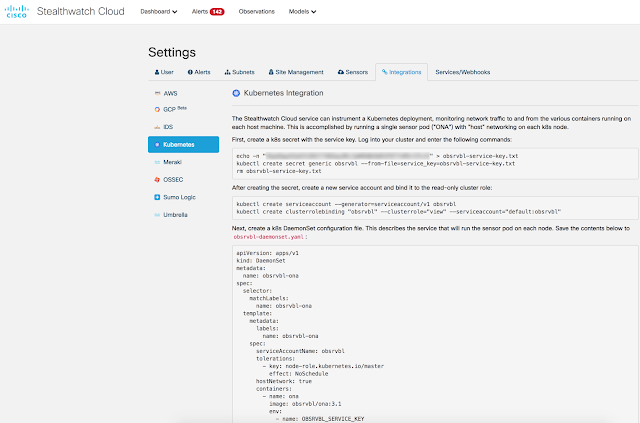
At this point you’ll want to reference the instructions provided in your Stealthwatch Cloud portal on how to integrate Stealthwatch Cloud with your new cluster. In the Integrations page you find the Kubernetes integration page:

Security, Kubernetes, Security Analytics, Cisco Stealthwatch, Cisco Stealthwatch Cloud

First we’ll create a Kubernetes “Secret” with a Service Key as instructed in the setup steps:

Security, Kubernetes, Security Analytics, Cisco Stealthwatch, Cisco Stealthwatch Cloud

Now we’ll create a service account and bind it to the read-only cluster role:

Security, Kubernetes, Security Analytics, Cisco Stealthwatch, Cisco Stealthwatch Cloud

Next, create a k8s DaemonSet configuration file.  This describes the service that will run the sensor pod on each node. Save the contents below to obsrvbl-daemonset.yaml:

Security, Kubernetes, Security Analytics, Cisco Stealthwatch, Cisco Stealthwatch Cloud

Security, Kubernetes, Security Analytics, Cisco Stealthwatch, Cisco Stealthwatch Cloud

Save the file and then create the sensor pod via:

Security, Kubernetes, Security Analytics, Cisco Stealthwatch, Cisco Stealthwatch Cloud

You can see that now we have a Stealthwatch Cloud sensor pod deployed on each of the 3 nodes. That daemonset.yaml will ensure that the pod is deployed on any new worker node replicas as the cluster expands, automatically. We can now switch over to the Stealthwatch Cloud portal to see if the new sensors are available and reporting flow telemetry into the Stealthwatch Cloud engine. Within a few minutes the sensor pods from GKE should start reporting in and when they do you’ll see them populate the sensors page as unique sensors in your Sensor List:

Security, Kubernetes, Security Analytics, Cisco Stealthwatch, Cisco Stealthwatch Cloud

At this point Stealthwatch Cloud is now providing full visibility into all pods on all nodes including the K8s Master node and the full capabilities of Stealthwatch Cloud including Entity Modeling and behavioral anomaly detection will be protecting the GKE cluster.

We can now deploy an application in our cluster to monitor and protect. For simplicity’s sake we’ll deploy a quick NGINX app into a pod in our cluster using the following command:

sudo kubectl create deployment nginx --image=nginx

You can verify the status of the application along with the Stealtwatch Cloud sensors with the following kubectl command:

kubectl get pods -o wide

Security, Kubernetes, Security Analytics, Cisco Stealthwatch, Cisco Stealthwatch Cloud

You’ll see in the above that I actually have 2 NGINX instances running and it’s simply because I edited the YAML file for the NGINX app to ensure that 2 replicas were running upon deployment. This can easily be adjusted to set your needs as you scale your K8s cluster.

After a few minutes you can now query your Stealthwatch Cloud portal for anything with “NGINX” and you should see the following type of results:

Security, Kubernetes, Security Analytics, Cisco Stealthwatch, Cisco Stealthwatch Cloud

You’ll see both existing and non-existing NGINX pods in the search results above. This is because as the cluster expands and contracts and the pods deploy, each pod gets a unique IP Address to communicate on. The non-existent pods in the Stealthwatch Cloud search results represent previously existent pods in our cluster that were torn down to do reducing and increasing replica pods over time.

At this point you have full visibility into all of the traffic across the NGINX pods and full baselining and anomaly detection capabilities as well should any of them become compromised or begin behaving suspiciously.

Friday, 7 September 2018

Time to Get Serious About Edge Computing

Edge Computing, Cisco Study Materials, Cisco Guides, Cisco Tutorial and Material, Cisco Live

If a heart monitor can’t keep a consistent connection to the nurses’ station, is the patient stable or in distress? If a WAN link to a retail chain store goes down, can the point of sale still process charge cards?  If gas wellheads are leaking methane and the LTE connection is unavailable, how much pollution goes untracked? These critical applications are candidates for edge processing. As organizations design new applications incorporating remote devices that cumulatively feed time-critical data to analytics back in the data center or cloud, it becomes necessary to push some of the processing to the edge to decrease network loads while increasing responsiveness. While it is possible to use public clouds to provide processing power for analyzing edge data, there is a real need to treat edge device connectivity and processing differently to minimize time to value for digital transformation projects.

Edge Computing Workloads Are Uniquely Demanding


There are three attributes in particular that need careful consideration when networking edge applications.

Very High Bandwidth

Video surveillance and facial recognition are probably the most visible of edge implementations. HD cameras operate at the edge and generate copious volumes of data, most of which is not useful. A local process on the camera can trigger the transmission of a notable segment (movement, lights) without feeding the entire stream back to the data center. But add facial recognition and the processing complexity increases exponentially, requiring much faster and more frequent communication with the facial analytics at the cloud or data center. For example, with no local processing at the edge, a facial recognition camera at a branch office would need access to costly bandwidth to communicate with the analytic applications in the cloud. Pushing recognition processing to the edge devices, or their access points, instead of streaming all the data to the cloud for processing decreased the need for high bandwidth while increasing response times.

Latency and Jitter

Sophisticated mobile experience apps will grow in importance on devices operating at the edge. Apps for augmented reality (AR) and virtual reality (VR) require high bandwidth and very low (sub-10 millisecond) latency. VoIP and telepresence also need superior Quality of Service (QoS) to provide the right experience. Expecting satisfactory levels of service from cloud-based applications over the internet is wishful thinking. While some of these applications run smoothly in campus environments, it’s cost prohibitive in most branch and distributed retail organizations using traditional WAN links. Edge processing can provide the necessary levels of service for AR and VR applications.

High Availability and Reliability

Many use cases for IoT edge computing will be in the industrial sector with devices such as temperature/humidity/chemical sensors operating in harsh environments, making it difficult to maintain reliable cloud connectivity. Far out-on-the-edge, devices such as gas field pressure sensors may not need real-time connections, but reliable burst communications to warn of potential failures. Conversely, patient monitors in hospitals and field clinics need consistent connectivity to ensure alerts are received when patients experience distress. Retail stores need high availability and low latency for Point of Sale payment processing and to cache rich media content for better customer experiences.

Building Hybrid Edge Solutions for Business Transformation

Edge Computing, Cisco Study Materials, Cisco Guides, Cisco Tutorial and Material, Cisco Live
Cisco helps organizations create hybrid edge-cloud or edge-data center systems to move processing closer to where the work is being done—indoor and outdoor venues, branch offices and retail stores, factory floor and far in the field. For devices that focus on collecting data, the closest network connection—wired or wireless—can provide additional compute resources for many tasks such as filtering for significant events and statistical inferencing using Machine Learning (ML). Organizations with many branches or distributed store fronts designed for people interactions, can take advantage of edge processing to avoid depending on connectivity to corporate data centers for every customer transaction.

An example of an edge computing implementation is one for a national quick serve restaurant chain that wanted to streamline the necessary IT components at each store to save space while adding bandwidth for employee and guest Wi-Fi access, enable POS credit card transactions even when an external network connection is down, and connect with the restaurant’s mobile app to route orders to the nearest pickup location. Having all the locally-generated traffic traverse a WAN or flow through the internet back to the corporate data center is unnecessary, especially when faster response times enable individual stores to run more efficiently, thus improving customer satisfaction. In this particular case, most of the mission-critical apps run on a compact in-store Cisco UCS E-series with an ISR4000 router, freeing up expensive real estate for the core business—preparing food and serving customers—and improving in-store application experience. The Cisco components also provide local edge processing for an in-store kiosk touch screen menu interface to speed order management and tracking.

The Cisco Aironet Access Point (AP) platform adds another dimension to edge processing with distributed wireless sensors. APs, like the Cisco 3800, can run applications at the edge. The capability enables IT to design custom apps that process data from edge devices locally and send results to cloud services for further analysis. For example, an edge application that monitors the passing of railway cars and track conditions. Over a rail route, sensors at each milepost collect data on train passages, rail conditions, temperature, traffic loads, and real-time video. Each edge sensor attaches to an AP that aggregates, filters, and transmits the results to the central control room. The self-healing network minimizes service calls along the tracks while maintaining security of railroad assets via sensing and video feeds.

Bring IT to the Edge

Edge Computing, Cisco Study Materials, Cisco Guides, Cisco Tutorial and Material, Cisco Live
There are thousands of ways to transform business operations with IoT and edge applications. Pushing an appropriate balance of compute power to the edge of the cloud or enterprise network to work more closely with distributed applications improves performance, reduces data communication costs, and increases the responsiveness of the entire network. Building on a foundation of an intent-based network with intelligent access points and IOS-XE smart routers and Access Points, you can link together edge sensors, devices, and applications to provide a secure foundation for digital transformation. Let us hear about your “edgy” network challenges.

Edge Computing, Cisco Study Materials, Cisco Guides, Cisco Tutorial and Material, Cisco Live

Wednesday, 5 September 2018

New Study Shows Correlating Network and Endpoint Data is Highly Manual

We recently commissioned Forrester Consulting to survey IT security professionals to find out what their desired end state was when it came to correlating security intelligence from network and endpoint. Bringing together these two disparate threat vectors allows organizations to:

◈ Increase detection and prevention capabilities
◈ Reduce manpower and resources needed for containment (and therefore costs)
◈ Exponentially decrease remediation time

In short, these are perceived benefits as they are not really happening today. Surprisingly, most organizations reported high confidence in their current threat detection and remediation systems.

But do they really have the problem covered?


Turns out – No. Perception and reality differ in this case. Many respondents claim to have integrated systems but in practice, being able to make decisions about endpoint and network security requires considerable time and effort from teams, if the data can be used at all. This shouldn’t really come as much of a shock at all since we asked what security technologies they had implemented and what they were planning to implement. While there is no clear standout winner for what is going to be implemented, what is clear is of the 21 solutions that we inquired about, respondents are spreading their capital expenses all over the place. This is why most organizations are doing the work manually.

Too many tools, little integration, no automation


With so many different security solutions in place, it’s no wonder there is so much time spent doing manual analysis and investigation into security incidents. Earlier this summer I spoke with a lot of security professionals at the Gartner Security Summit and at Cisco Live who talked about how siloed their products were. The data produced by one tool couldn’t even be consumed by another, and the information they could correlate took forever. One conversation in particular that stands out was an incident responder from a large power company who talked about how they had taken more than 6 months to investigate a single incident because they couldn’t track back the path of infection, and identify how it was propagating through their network. This is not an uncommon story that we hear. Over the last decade so many tools have been deployed that it is now making the job harder, not easier. If only they could have a security architecture where the tools talked to each other, and correlated data automatically.

Cisco Tutorial and Material, Cisco Study Materials, Cisco Learning, Cisco Network
Automating data analysis for improved detection is a reality

The term “architecture” has been used so much it quite possibly is one of the few terms that requires more definition than “cloud”.  Simply put, we view an architecture as something that works together. Not a bunch of API’s that get cobbled together to push data somewhere (and eventually the API gets changed and that’s all broken…), and then the manual analysis happens, but a set of technologies, and specifically security tools, that all work together – automatically – to reduce the manual effort. This means having your endpoint detection and response solution (EDR) correlating files seen by your firewall or intrusion detection system with those analyzed your sandbox, and connect it with telemetry from the web proxy to identify associated traffic as well as command & control (CNC) infrastructure, and additional tools attackers are using – and all without you having to do anything.

While it may sound absurd, we call it Advanced Malware Protection, or AMP Everywhere. When you put the same eyes everywhere, you see everything. More visibility means a better ability to prevent advanced attacks.

Cisco Tutorial and Material, Cisco Study Materials, Cisco Learning, Cisco Network

For a good technical overview of how AMP works, check out this chalk talk.

Saturday, 1 September 2018

How to Use the Plug and Play Template Editor in DNA Center – Part 3

The first and second blog posts in this series gave an overview of network Plug and Play (PnP) and how it has evolved in Cisco DNA Center.   They showed a very simple workflow to provision a device with a configuration template with a variable called “hostname.”   This was done by the UI and programmatically via the API.

This blog post looks at creating PnP configuration templates using template editor in Cisco DNA Center.  Here, we will cover the User Interface and basic concepts, and subsequent blog posts will cover advanced topics, Day-N provisioning and the associated API.

Template Editor


The template editor is a standalone application at the bottom of the Cisco DNA Center home page.  It can be used for Day-0 (PnP) or Day-N configurations.

Cisco DevNet, Cisco DNA Center, Enterprise Networking, Cisco Study Material, Cisco Tutorial and Material

When the editor is opened for the first time, a project needs to be created along with a template. Projects are like folders to contain and structure the templates you build.  The example below, shows the “base config” template used in the earlier blogs.  “pnp” and “adam” are just project names.

Cisco DevNet, Cisco DNA Center, Enterprise Networking, Cisco Study Material, Cisco Tutorial and Material

Creating a new Template


Click the “+” at the top of the template page or the gear beside a project to add a new template.  The “+” allows you to create a project or a template, while the gear creates a template with the project.

Cisco DevNet, Cisco DNA Center, Enterprise Networking, Cisco Study Material, Cisco Tutorial and Material

The “add new template” slide out will appear.  This contains metadata about the template, such as the device types it applies to and the flavor of IOS. The example below applies to routers and switches (all models) which run IOS-XE.  It is possible to restrict the template to a specific version of code or model of device.

NOTE:  It is possible to have a single template or a composite sequence of templates. Currently composite sequences are not supported in PnP.

Cisco DevNet, Cisco DNA Center, Enterprise Networking, Cisco Study Material, Cisco Tutorial and Material

Click on the template to edit it.  The three boxes on the top right are used to navigate between the following views:

◈ Edit – to edit/commit the template.
◈ Variable – provide metadata about the variables used in the template. “$” is used to signify a variable.
◈ Simulation mode – View the rendered template by providing a set of test values for the variables.

Cisco DevNet, Cisco DNA Center, Enterprise Networking, Cisco Study Material, Cisco Tutorial and Material

It is important to realize that templates have a 2-phase commit.  A template can be saved, but it needs to be “committed” before it can be used. Templates have version control based on the “commit process”.

First Version


After entering some commands, the template needs to be saved and committed.  Any string that starts with “$” will be treated as a variable. In this example, “$hostname” is a variable.  Multiple variables are supported.

Cisco DevNet, Cisco DNA Center, Enterprise Networking, Cisco Study Material, Cisco Tutorial and Material

Variable Types


After committing an initial template version, the variables view can be used to change the type of the variable if required.  Variables can also be marked as “not a variable”, which is useful for configuration strings that contain  “$”.  I will discuss this more in the advanced blog post.

Cisco DevNet, Cisco DNA Center, Enterprise Networking, Cisco Study Material, Cisco Tutorial and Material

Simulation


Simulations can be used to test the template with dummy variables.  This is particularly useful later on when using loops and other control structures in a template.

Select the simulation tab, and then the “New Simulation” action.

Cisco DevNet, Cisco DNA Center, Enterprise Networking, Cisco Study Material, Cisco Tutorial and Material

You then need to provide a value for the variables, and run the simulation to see the result.  Notice how the hostname variable has been replaced by its value (“fred”).

The simulation feature is particularly relevant with more sophisticated templates.

Cisco DevNet, Cisco DNA Center, Enterprise Networking, Cisco Study Material, Cisco Tutorial and Material

Friday, 31 August 2018

New XR Programmability Learning Labs and Sandbox Let You Explore

Turning team focus to network automation and programmability


I came from a network service provider background. Then, when I starting working at Cisco, I was working on the Cisco Security network team. The global network we built, owned, and managed was much like a service provider network. We had lots of transit links, and circuits with service providers, and tons of peering links, and sessions all over the world. Managing this was a full-time job, and I am just talking about managing the WAN (wide area network) here. Which is why, like many of you and other network teams out there whose network requires speed, scale, and data analytics, my team and I turned our focus to network automation and programmability.

The majority of our network devices (both core and edge) were running IOS XR. IOS XR has always been one of my favorite platforms, so it was with great excitement that when I began working for the Cisco DevNet team, my specialist area would be working with the IOS XR teams and platform.

What is new to learn here?


A great question, I am pleased you asked! We have built a dedicated sandbox environment for IOS XR programmability and learning labs to go with this.  The IOS XR Programmability sandbox and learning labs provide an environment where developers and network engineers can explore the programmability options available in this routing platform. These include:

◈ Model Driven Programmability with YANG Data Models, NETCONF and gRPC
◈ Streaming Telemetry
◈ Service-Layer APIs
◈ Application Hosting

What gear can you access in the sandbox?


We wanted to build a sandbox that provides the right level of simplicity for users to get started while offering a flexible platform they can build on. The sandbox provides two Cisco IOS XRv 9000 devices (R1 and R2) connected back to back, plus a Linux host that acts as a development box (DevBox). The image version on Sandbox tile is 6.4.1 this is available on both the two IOS-XR nodes.

Cisco Study Materials, Cisco Guides, Cisco Learning, Cisco Certification, Cisco Tutorial and Material

The new IOS XR programmability sandbox lets you explore programmability options available in this routing platform.

The all-new learning labs and track


You can use the IOS-XR programmability learning track to familiarize yourself with the rich set of programmable interfaces and APIs offered by IOS-XR. The goal of this track is to introduce you to the architectural tenets of the IOS-XR network stack and showcase how APIs at every layer of the stack – from Manageability APIs like YANG models, CLI, ZTP hooks to Service Layer APIs at the network infrastructure layer can be used to completely transform the way you manage and provision your network.

◈ IOS-XR CLI automation Cisco IOS-XR offers a comprehensive portfolio of APIs at every layer of the network stack, allowing users to leverage automated techniques to provision and manage the lifecycle of a network device. In this module, we start with the basics: the Command Line Interface (CLI) has been the interaction point for expect-style scripters (TCL, expect, pexpect etc.) for ages; but these techniques relying on send/receive buffers are prone to errors and inefficient code. This is where the new onbox ZTP libraries come handy. Use them for automated device bring-up or to automate Day1 and Day2 behavior of the device through deterministic APIs and return values in a rich Linux environment on the router.

◈ IOS-XR Model-Driven Automation: YANG models Cisco IOS-XR offers a comprehensive portfolio of APIs at every layer of the network stack, allowing users to leverage automated techniques to provision and manage the lifecycle of a network device. APIs that are derived, documented and versioned using deterministic models are contractually obliged to match the expectations laid out by the model. Following this ethos, in IOS-XR, all the capabilities of the software, traditionally offered through the Command Line Interface (configuration commands, show commands, exec commands) are mapped to equivalent Config and Oper YANG models backed by the internal IOS-XR Database called SYSDB. In this module, we start taking the first steps towards model-driven programmability as we dive deeper into IOS-XR Yang models. We look at the interaction with these models with tools such as ncclient, YDK or gRPC clients and tips to map your CLI configurations to corresponding YANG-Modeled XML/JSON representations.

◈ IOS-XR Streaming Telemetry: SNMP is dead! It is time to move away from slow, polling techniques employed by SNMP for monitoring that are unable to meet the cadence or scale requirements associated with modern networks. Further, Automation is often misunderstood to be a one-way street of imperative (or higher-layer declarative) commands that help bring a network to an intended state. However, a core aspect of automation is the ability to monitor real-time state of a system during and post the automation process to accomplish a feedback loop that helps make your automation framework more robust and accurate across varied circumstances. In this module, we learn how Streaming Telemetry capabilities in IOS-XR are all set to change network monitoring for the better – allowing tools to subscribe to structured data, contractually obliged to the YANG models representing operational state of the IOS-XR internal database (SYSDB) at a cadence and scale that are orders of magnitude higher than SNMP.

◈ IOS-XR Service-Layer APIs: Cisco IOS-XR offers a comprehensive portfolio of APIs at every layer of the network stack. For most automation use cases, the manageability layer that provides the CLI, YANG models and Streaming Telemetry capabilities, is adequate. However, over the last few years, we have seen a growing reliance in web-scale and large-scale Service Provider networks on off-box Controllers or on-box agents that extract away the state machine of a traditional protocol or feature and marry their operation to the requirements of a specific set of applications on the network. These agents/controllers require highly performant access to the lowest layer of the network stack called the Service Layer and the model-driven APIs built at this layer are called the Service-Layer APIs. With the ability to interact with RIB, the Label Switch Database (LSD), BFD events, interface events and more capabilities coming in the future, it is time to take your automation chops to the next level.

Cisco Study Materials, Cisco Guides, Cisco Learning, Cisco Certification, Cisco Tutorial and Material

The sandbox provides two Cisco IOS XRv 9000 devices (R1 and R2) connected back to back, plus a Linux host that acts as a development box (DevBox).

Getting Started


The development box includes a “hello world” sample app to check the uptime on routers to get you started.

hello-ydk.py

The script illustrates a minimalistic app that prints the uptime of a device running Cisco IOS XR. The script opens a NETCONF session to a device via the devices IP address, reads the system time and prints the formatted uptime.

Sample Output: