Sunday 1 March 2020

An Introduction Into Kubernetes Networking – Part 2

2. Pod-to-Pod Communications


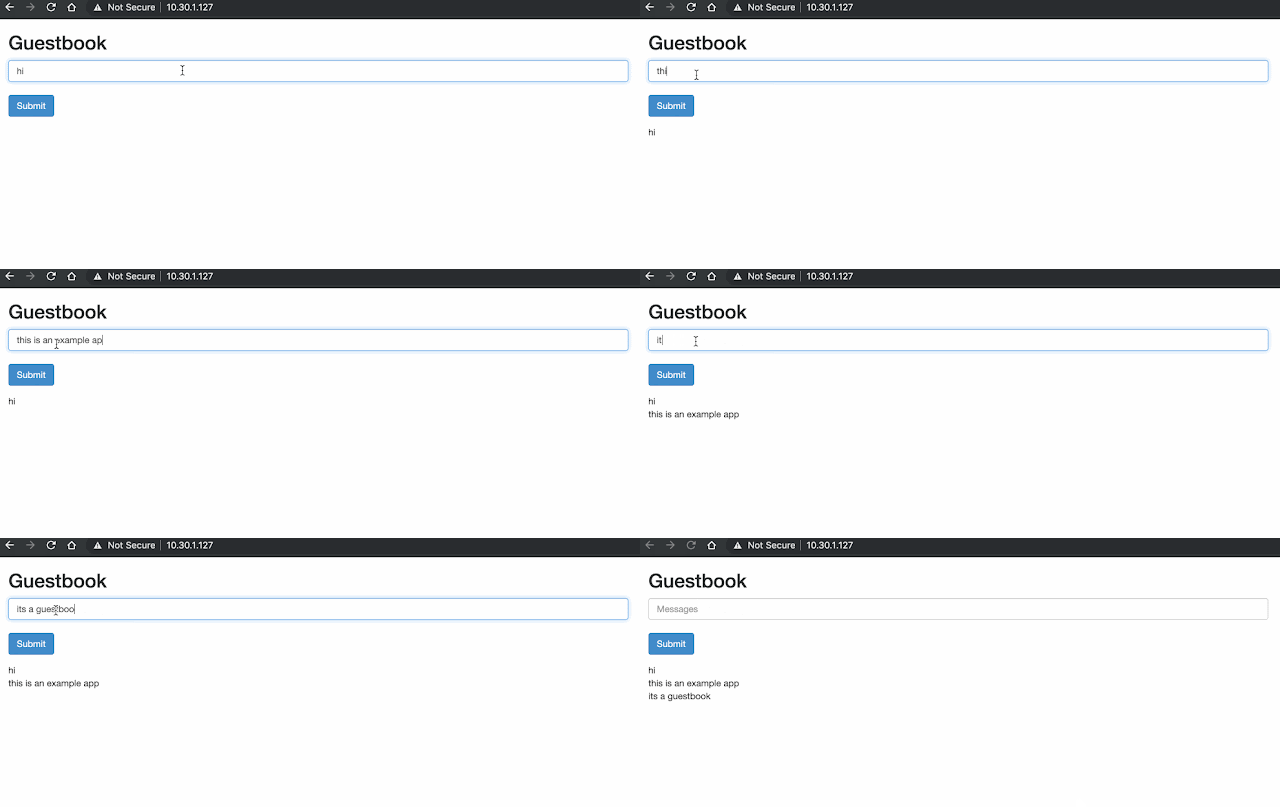
In the subsequent topics we will move away from the two-container pod example and instead use the Kubernetes Guestbook example. The Guestbook features a frontend web service (PHP and Apache), as well as a backend DB (Redis Master and Slave) for storing the guestbook messages.

Cisco ACI, DevNet, Kubernetes, Network Programming, Cisco Prep, Cisco Guides

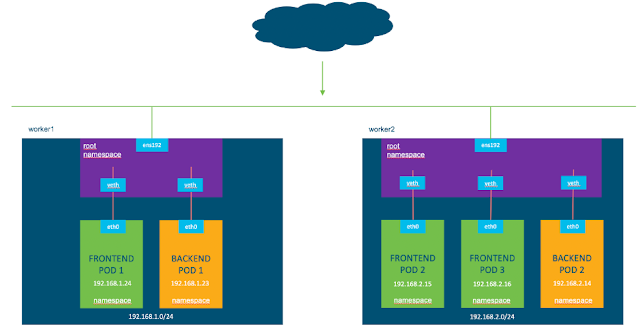
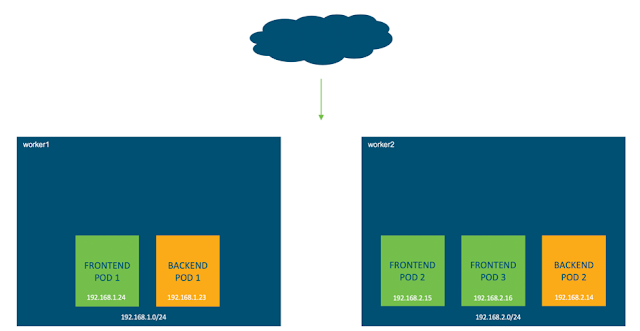
Before we get into pod-to-pod communication, we should first look at how the addresses and interfaces of our environment have been configured.

◉ In this environment there are two worker nodes, worker 1 and worker 2, where the pods from the Guestbook application will run.

◉ Each node receives it’s own /24 subnet, worker 1 is 192.168.1.0/24 and worker 2 is 192.168.2.0/24.

◉ These addresses are internal to the nodes; they are not routable in the lab.

Cisco ACI, DevNet, Kubernetes, Network Programming, Cisco Prep, Cisco Guides

*** IMPORTANT POINT: ***  Every Kubernetes pod receives its own unique IP address. As we previously saw, you can have multiple containers per pod. This means that all containers in a pod share the same network namespace, IP address and interfaces.

Network Namespaces

Kubernetes and containers rely heavily on Linux namespaces to separate resources (processes, networking, mounts, users etc) on a machine.

“Namespaces are a feature of the Linux kernel that partitions kernel resources such that one set of processes sees one set of resources while another set of processes sees a different set of resources.”

“Network namespaces virtualize the network stack.

Each network interface (physical or virtual) is present in exactly 1 namespace and can be moved between namespaces.

Each namespace will have a private set of IP addresses, its own routing table, socket listing, connection tracking table, firewall, and other network-related resources.”


If you come from a networking background the easiest way to think of this is like a VRF and in Kubernetes each pod receives its own networking namespace (VRF).

Additionally, each Kubernetes node has a default or root networking namespace (VRF) which contains for example the external interface (ens192) of the Kubernetes node.

*** IMPORTANT POINT: *** Linux Namespaces are different from Kubernetes Namespaces. All mentions in this post are referring to the Linux network namespace.

Virtual Cables and Veth Pairs

In order to send traffic from one pod to another we first need some way to exit the pod. Within each pod exists an interface (e.g. eth0). This interface allows connectivity outside the pods network namespace and into the root network namespace.

Just like in the physical world you have two interfaces, one on the server and one on the switch, in Kubernetes and Linux we also have two interfaces. The eth0 interface resides in our pod and we also have a virtual ethernet (veth) interface that exists in the root namespace.

Instead of a physical cable connecting a server and switchport, we can think similarly of these two interfaces but this time connected by a virtual cable. This is known as a virtual ethernet (veth) device pair and allows connectivity outside of the pods.

Cisco ACI, DevNet, Kubernetes, Network Programming, Cisco Prep, Cisco Guides

The next step is to understand how the veth interfaces connect upstream. This is determined by the plugin in use and for example may be a tunneled interface or a bridged interface.

*** IMPORTANT POINT: *** Kubernetes does not manage the configuration of the pod-to-pod networking itself, rather it outsources this configuration to another application, the Container Networking Interface(CNI) plugin.

“A CNI plugin is responsible for inserting a network interface into the container network namespace (e.g. one end of a veth pair) and making any necessary changes on the host (e.g. attaching the other end of the veth into a bridge). It should then assign the IP to the interface and setup the routes consistent with the IP Address Management section by invoking appropriate IPAM plugin.”

https://github.com/containernetworking/cni/blob/master/SPEC.md#overview-1

CNI plugins can be developed by anyone and Cisco have created one to integrate Kubernetes with ACI. Other popular plugins include Calico, Flannel, and Contiv, with each implementing the network connectivity in their own way.

Although the methods of implementing networking connectivity may differ between CNI plugins, every one of them must abide by the following requirements that Kubernetes imposes for pod to pod communications:

◉ Pods on a node can communicate with all pods on all nodes without NAT

◉ Agents on a node (e.g. system daemons, kubelet) can communicate with all pods on that node

◉ Pods in the host network of a node can communicate with all pods on all nodes without NAT

https://kubernetes.io/docs/concepts/cluster-administration/networking/

*** IMPORTANT POINT: *** Although pod to pod communication in Kubernetes is implemented without NAT, we will see NAT rules later when we look at Kubernetes services

What is a CNI Plugin?


A CNI plugin is in fact just an executable file which runs on each node and is located in the directory, “/opt/cni/bin”. Kubernetes runs this file and passes it the basic configuration details which can be found in “/etc/cni/net.d”.

Once the CNI plugin is running, it is responsible for the network configurations mentioned above.

To understand how CNI plugins implement the networking for Kubernetes pod to pod communications we will look at an example, Calico.

Calico

Calico has a number of options to configure Kubernetes networking. The one that we’ll be looking at today is using IPIP encapsulation however you could also implement unencapsulated peering, or encapsulated in VXLAN. See the following document for further details on these options.

https://docs.projectcalico.org/networking/determine-best-networking

There are two main components that Calico uses to configure networking on each node.

◉ Calico Felix agent

The Felix daemon is the heart of Calico networking. Felix’s primary job is to program routes and ACL’s on a workload host to provide desired connectivity to and from workloads on the host.

Felix also programs interface information to the kernel for outgoing endpoint traffic. Felix instructs the host to respond to ARPs for workloads with the MAC address of the host.

◉ BIRD internet routing daemon

BIRD is an open source BGP client that is used to exchange routing information between hosts. The routes that Felix programs into the kernel for endpoints are picked up by BIRD and distributed to BGP peers on the network, which provides inter-host routing.

https://docs.projectcalico.org/v3.2/reference/architecture/components

Now that we know that Calico programs the route table and creates interfaces we can confirm this in the lab.

Cisco ACI, DevNet, Kubernetes, Network Programming, Cisco Prep, Cisco Guides

As you can see there are a few interfaces that have been created:

◉ ens192 is the interface for external connectivity outside of the node. This has an address in the 10.30.1.0/24 subnet which is routable in the lab

◉ tunl0 is the interface we will see shortly and provides the IPIP encapsulation for remote nodes

◉ calixxxxx are the virtual ethernet interfaces that exist in our root namespace. Remeber from before that this veth interface connects to the eth interface in our pod

*** IMPORTANT POINT: *** As previously mentioned this example is using Calico configured for IPIP encapsulation. This is the reason for the tunnelled interface (tunl0). If you are using a different CNI plugin or a different Calico configuration you may see different interfaces such as docker0, flannel0, or cbr0

If you look at the routing table you should see that Calico has inserted some routes. The default routes direct traffic out the external interface (ens192), and we can see our 192.168 subnets.

We’re looking at the routing table on worker 1 which has been assigned the subnet 192.168.1.0/24. We can see that any pods on this worker (assigned an IP address starting with 192.168.1.x) will be accessible via the veth interface, starting with calixxxxx.

Any time we need to send traffic from a pod on worker 1 (192.168.1.x) to a pod on worker 2 (192.168.2.x) we will send it to the tunl0 interface.

As per the this document, “when the ipip module is loaded, or an IPIP device is created for the first time, the Linux kernel will create a tunl0 default device in each namespace”

Another useful link points out, “with the IP-in-IP ipipMode set to Always, Calico will route using IP-in-IP for all traffic originating from a Calico enabled host to all Calico networked containers and VMs within the IP Pool”

https://docs.projectcalico.org/v3.5/usage/configuration/ip-in-ip

So how does Calico implement pod to pod communication and without NAT?


Based on what we’ve learnt above, if it’s pod to pod communication on the same node it will send packets to the veth interfaces.

Traffic between pods on different worker nodes will be sent to the tunl0 interface which will encapsulate these packets with an outer IP packet. The source and destination IP addresses for the outer packet will be our external, routable addresses (10.30.1.x subnet).

*** IMPORTANT POINT: *** A reminder that in this example we’re using IPIP encapsulation with Calico however it could also be implemented using VXLAN.

Cisco ACI, DevNet, Kubernetes, Network Programming, Cisco Prep, Cisco Guides

We can confirm this encapsulation is taking place by capturing the packets from the ens192 external interface. As you can see from the screenshot, when we send traffic from Frontend Pod 1 (192.168.1.24) to Frontend Pod 2 (192.168.2.15), our inner packets are encapsulated in an outer packet containing the external source and destination addresses of the ens192 interfaces (10.30.1.131 and 10.30.1.132).

Since the 10.30.1.0/24 subnet is routable in the lab, we can send the packets into the lab network and they will eventually find their way from worker 1 to worker 2. Once they’re at worker 2 they will be decapsulated and sent onto the local veth interface connecting to the Frontend Pod 2.
Saturday 29 February 2020

An Introduction Into Kubernetes Networking – Part 1

Cisco Study Materials, Cisco Guides, Cisco Tutorial and Material, Cisco Learning, Cisco Kubernetes

Cisco Live Barcelona recently took place and there was a lot of focus on Kubernetes, including the launch of the Cisco Hyperflex Application Platform(HXAP). Cisco HXAP delivers an integrated container-as-a-service platform that simplifies provisioning and ongoing operations for Kubernetes across cloud, data center, and edge.

With every new technology comes a learning curve and Kubernetes is no exception.

1. Container to Container Communications


The smallest object we can deploy in Kubernetes is the pod, however within each pod you may want to run multiple containers. A common usecase for this is a helper where a secondary container helps a primary container with tasks such as pushing and pulling data.

Container to container communication within a K8s pod uses either the shared file system or the localhost network interface.

We can test this by using the K8s provided example, two-container-pod, and modifying it slightly.

https://k8s.io/examples/pods/two-container-pod.yaml

When we deploy this pod we can see two containers, “nginx-container” and “debian-container“. I’ve created two separate options to test, one with a shared volume, and one without a shared volume but using localhost instead.

Shared Volume Communication


Cisco Study Materials, Cisco Guides, Cisco Tutorial and Material, Cisco Learning, Cisco Kubernetes

Cisco Study Materials, Cisco Guides, Cisco Tutorial and Material, Cisco Learning, Cisco Kubernetes

When we use the shared volume, Kubernetes will create a volume in the pod which will be mapped to both containers. In the “nginx-container”, files from the shared volume will map to the “/usr/share/nginx/html” directory, while in the “debian-container” files will map to the “/pod-data” directory. When we update the “index.html” file from the Debian container, this change will also be reflected in our Nginx container, thereby providing a mechanism for our helper (Debian) to push and pull data to and from Nginx.

Localhost Communication


Cisco Study Materials, Cisco Guides, Cisco Tutorial and Material, Cisco Learning, Cisco Kubernetes

Cisco Study Materials, Cisco Guides, Cisco Tutorial and Material, Cisco Learning, Cisco Kubernetes

In the second scenario shared volume has been removed from the pod and a message has been written in the “index.html” file which only resides in the Nginx container. As previously mentioned, the other method for multiple containers to communicate within a pod is through the localhost interface and the port number to which they’re listening.

In this example Nginx is listening on port 80, therefore when we run the “curl https://localhost” command from the Debian container we can see that the “index.html“ page is served back to us from Nginx.

Here’s the “nginx-container” showing the contents of the “index.html” file.

Cisco Study Materials, Cisco Guides, Cisco Tutorial and Material, Cisco Learning, Cisco Kubernetes

Confirmation that we’re receiving the file when we Curl from the “debian-container”

Cisco Study Materials, Cisco Guides, Cisco Tutorial and Material, Cisco Learning, Cisco Kubernetes

Friday 28 February 2020

Accelerate Your SMB Opportunity with High Velocity Managed Services

Cisco Exam Prep, Cisco Prep, Cisco Tutorial and Material, Cisco Guides, Cisco Collaboration

Small and medium business (SMB)* IT trends are consistent regardless of what you read or who you talk to.  IT budgets are growing, security is top of mind, and the shift to cloud in full force. For Cisco, these trends couldn’t align better. We have the buyer interest^, product leadership, and a world-class partner ecosystem to respond to the needs of these customers. 

And we are laser-focused on improving our traction in this market with a new small business-specific portfolio and a series of right-sized partner programs launched late last year.

In this blog, I will discuss the very exciting work we are doing to accelerate the SMB opportunity with our global Service Provider Partners, using a comprehensive new approach called High Velocity Managed Services. Simply put, High Velocity Managed Services does what it says: it accelerates the build-out and launch of managed services offerings targeting smaller customers, making it easy, scalable, and efficient to reach this segment.

Major Opportunity for SP Managed Services


When it comes to where and how to buy, there is no one size fits all in SMB. Sales cycles, typically one month, are much shorter than with enterprise customers (typically months or years for similar solutions) and SMBs want to purchase solutions on-demand and often, online.

However, when it comes to IT infrastructure services like network, security, and collaboration, new Cisco research suggests that many of the same companies are interested in using managed services if the provider can make it easy, affordable, and bundle it with other services – especially security (more on this later). And if the managed services provider can expand the bundle to deliver a complete IT package, including internet, the value proposition becomes extremely favorable.

Cisco Exam Prep, Cisco Prep, Cisco Tutorial and Material, Cisco Guides, Cisco Collaboration

Obviously, this means our global service provider ecosystem is in a great spot to better serve small business customers. They already market and deliver connectivity to SMBs and can use that scale to layer in new value-added services these buyers are looking for. No brainer, right?

Upping the Game with Managed Services


Yes, trends and business models suggest that service providers are poised to capture more managed services revenues. But this needs to be done with a few key tenets in mind:

◉ First and foremost, an acknowledgment that enterprises and SMB are very different. Sales and go-to-market processes need to be simplified to reach SMB buyers.

◉ For winning service providers, this comes with the recognition that SMBs can’t be served with enterprise offerings at a reduced price.

◉ Rather, solutions need to be tuned for this space by delivering the right set of features that solve the broadest set of customer pain points (with optional add-ons for vertical customers) messaged with a set of specific personas and business outcomes in mind, and set up for easy cross-sell.

Born in the cloud, Cisco Meraki delivers a simple value proposition for managed service providers – and is where the High Velocity journey starts. Providers can easily create a Meraki service template (i.e. offering) that suits a majority of customer needs, use platform APIs to connect to backend services, and then sell and provision with turnkey speed. This plug and play model can be used to deliver a secure WiFi offering all the way to a full managed network/LAN solution for rapid deployment and serviceability of desk phones across the WAN. All with a brandable end customer portal to provide important solution visibility that comes out of the box or customized through application development partners such as Encapto.

Security is King


71% of SMBs who are very interested in purchasing managed services from their service provider ranked security as the top value proposition of such a solution – higher than streamlined support and reporting tools.

Cisco Exam Prep, Cisco Prep, Cisco Tutorial and Material, Cisco Guides, Cisco Collaboration

With Meraki integrations with Cisco’s security products such as Cisco Advanced Malware Protection (AMP) and Umbrella, partners can lead with a value proposition centered on keeping out malware and ransomware that can cripple business productivity. Backed by the world’s most comprehensive threat intelligence research entity in Cisco Talos, providers can further showcase how well the solution covers the complex and evolving cyber threat landscape. For companies investing in collaboration, the Webex platform also delivers top-end security. Together, providers can market the complete suite of IT infrastructure services with security as the lead message.

Cisco Exam Prep, Cisco Prep, Cisco Tutorial and Material, Cisco Guides, Cisco Collaboration

More than Just a Product Pitch


As partners shift from niche managed services players to leading digital service providers, they need to adapt their own go-to-market programs and resources. It is not an overnight shift to start selling network security, SD-WAN, and complete IT infrastructure bundles. Nor is it sufficient to just start selling a managed service without thinking about the right product set, target segments, and packages as mentioned previously.

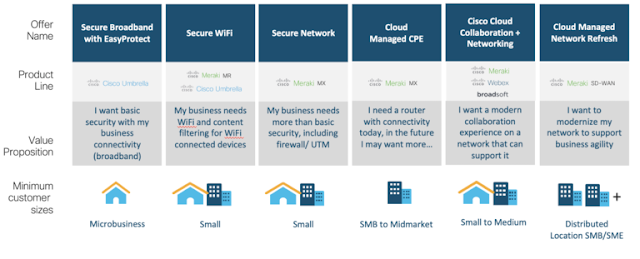
To help providers with the High Velocity Managed Services opportunity, we’ve built an arsenal of best-practice go-to-market resources to assist with sales and marketing enablement. We’ve developed these assets across the offers depicted above, and they can be used off the shelf or tailored to a provider’s specific campaign goals through a Cisco-led engagement.

Thursday 27 February 2020

Threat hunting doesn’t have to be difficult—Taking a proactive position with your cybersecurity

Cisco Study Materials, Cisco Guides, Cisco Learning, Cisco Exam Prep

Your Endpoint Protection Platform (EPP) is up to date with the latest version. Your Endpoint Detection and Response (EDR) technology has all of the latest framework rules and automaton in place. Vulnerabilities and patches for hardware and software are all covered. Your Defense in Depth strategy appears to be keeping your organization secure. But, and there is always a “but”, some adversarial techniques are difficult to DETECT even on a good day. Exfiltration can be quite difficult to detect even if you are looking for it.

As advanced threats continue to proliferate throughout an organizations’ IT resources, threat hunting as a practice has appeared. For an elite security organization, threat hunting takes a more proactive stance to threat detection. Threat hunting was a natural, security progression saved for the most mature environments where skilled personnel leverage knowledge and tools to formulate and investigate hypotheses relating to their organization’s security across the landscape. Now with technology advancements and automation, threat hunting has now become within reach for every organization.

Threat hunting is an analyst-centric process that enables organizations to uncover hidden, advanced threats, missed by automated preventative and detective controls.

Security professionals are beginning to discover threat hunting practices to advance their detection and response monitoring. Threat hunting requires a highly skilled person as well as wide-ranging data forensics and live response across the IT environment. There are only a handful of companies in verticals such as financial services, high-tech manufacturing, and defense that can claim to have advanced threat hunting teams that deliver results.

Today’s threat actors are well-organized, highly intelligent, motivated and focused on their targets. These adversaries could be lurking on your network or threating to break into it, using increasingly sophisticated methods to reach their goal. In addition, the attacks can come from many different threat surfaces to exploit the many vulnerabilities that may be present across an organizations’ network and people. Worst of all, organizations do not know by whom, when, where or how a well-planned attack will occur. Today’s rule-based defenses and solutions have limitations, even advanced detection mechanisms struggle to anticipate how attack vectors will evolve. To mitigate threats more proactively, organizations must move quicker than the speed of the threat. The easiest way to put it, when the existing rules are undermined, it is time to start threat hunting.

Cisco Study Materials, Cisco Guides, Cisco Learning, Cisco Exam Prep
Pyramid of Pain

Threat Hunting also allows security teams to address the top most tiers of the Pyramid of Pain, making more difficult for adversaries to impact environments. At the “Tools” level, analysts are taking away one or more specific tools that an adversary would use in an attack. At the apex of the pyramid are the TTPs (Tactics,Techniques and Procedures), when analysts detect and respond at this level, they are operating directly on the adversary’s behaviors, not against their tools, forcing them to learn new behaviors.

There are three types of hunts.

◉ Intelligence-Driven (Atomic Indicators) – These are low-hanging fruit hunts. They are generally known threats that bypass traditional security controls

◉ TTP-Driven (Behavioral and Compound Indicators) – These are hunts looking for techniques used by advanced attackers, where analysts take a methodological approach for discovering unknowns. Generally attempting to interrupt the adversaries TTPs (Techniques, Tactics, and Procedures)

◉ Anomaly-Driven (Generic Behaviors) – These hunts are based on low-prevalence artifacts and outlier behaviors. These are unknown threat leads.

Benefits of Starting a Threat Hunting Practice


There are many benefits from starting a threat hunting practice. Obviously, discovering and thwarting an attack before it causes significant damage. However, what about a threat hunt that doesn’t find anything? Is that really a bad thing? Having stronger knowledge of vulnerabilities and risks on the network will allow a hardening of your security environment which in turn should equate to fewer breaches and breach attempts. Moreover, the insights gathered from threat hunts will aid in reducing the attack surface. Another key result from beginning a threat hunting practice is that security teams will realize increased speed and accuracy of threat responses. Ultimately, organizations should witness measurable improvements for key security indicators such as mean time to detect and mean time to respond.

In-House or Outsourced?


Through outsourcing, threat hunting can be accessible for organizations of all sizes, but especially for small and medium sized organization as they often do not have a Security Operations Center (SOC) as it often is too expensive to build and support. Many Mid-Market sized companies have a SOC and are considering the addition of threat hunting to their current environment. Enterprise and large organizations perhaps are looking for assurance by augmenting existing threat hunting efforts. And in many cases, these enterprise organizations simply want to empower and educate their staff.

Just in time for RSAC, Cisco is pleased to announce that it will be adding Threat Hunting as a feature to our Cisco AMP for Endpoints offering. Our new threat hunting by Cisco Talos uniquely identifies advanced threats, alerting our customers before they can cause any further damage by:

◉ Uncovering hidden threats faster across the attack surface using MITRE ATT&CK™ and other industry best practices

◉ Performing human-driven hunts based on playbooks producing high fidelity alerts

◉ Continually developing systematic playbooks, executing on broad, low-level telemetry on product backend

Our new threat hunting capability:

◉ Is provided by Cisco Talos, the largest non-governmental threat intelligence organization on the planet

◉ Is not limited to just one control point (i.e.: endpoint), instead, we hunt across multiple environments

◉ Uniquely combines our new Orbital Advanced Search technology with expertise from elite threat hunters to proactively find more sophisticated threats

Tuesday 25 February 2020

Introducing SecureX

Making Security an Enabler, so Your Business Can Take an Exponential Leap


I joined the Cisco Security team the week after the RSA Conference in 2017. At that time there was a lot of discussion around the journey Cisco Security was on, particularly around our efforts to deliver an integrated architecture. For the previous years we had been integrating threat intelligence, context sharing and our anti-malware engine across our portfolio and were seeing dramatic improvements in key metrics such as time to detection.


But from the perspective of a security practitioner’s daily experience with our portfolio, we were failing. The user experience was siloed, it took too long to stitch our products (and third-party products) together, and even the navigation and look and feel of our products varied dramatically.

Shortly after that RSA we made the decision to focus our attention on the operational experience of our Security products, realizing that the usability component was equally as important as the underlying architecture. We stood up a team to lead us on that journey and began laying the foundation for what would become a huge leap forward for Cisco Security and for our customers.


Today we are introducing Cisco SecureX – a new way for users to experience Cisco’s Security portfolio.  Cisco SecureX streamlines our customers’ operations with increased visibility across their security portfolio and provides out-of-box integrations, powerful security analytics, and automated workflows to speed threat detection and response. SecureX is an open, cloud-native platform that connects Cisco’s integrated security portfolio and customers’ security portfolios for a simpler, more consistent experience across endpoints, cloud, network, and applications.

The foundational capabilities of SecureX


SecureX builds on the foundational work we’ve been doing over the past 2.5 years, including Cisco Threat Response, common user experience, single sign on, secure data sharing between on-prem and the cloud and more. But it does a whole lot more. The best way to experience SecureX is to visit us at the RSA conference. For those of you who can’t make it, here are some of the most important capabilities of the platform:

Unified visibility

SecureX provides unified visibility across all parts of your security portfolio – Cisco or third-party solutions – delivering metrics, activity feed and the latest threat intelligence.  I am particularly excited about the operational metrics capabilities of SecureX: Mean Time to Detection, Mean Time to Remediation, and Incident burndown times.  These metrics are derived from full case management capabilities native to the SecureX platform.  Case management enables SecureX customers to assign cases, track them to closure, and add relevant artifacts captured during investigation.

Automation

SecureX brings full multi-domain orchestration and automation capabilities to our customers using a no/low-code approach and intuitive drag-and-drop interface to deliver high-performance and scalable playbook capability.  The SecureX orchestration and automation capabilities use an adapter model that allows users to quickly and easily orchestrate across Security, Networking, IoT, Cloud, Collaboration, and Data Centers.  SecureX already has 50+ adapters across these domains and will continue to develop more.

Playbooks

SecureX will deliver pre-built playbooks, and customers can also develop their own playbooks tailored to their own environment of Cisco and non-Cisco products.  With our phishing playbook for example, end users can submit suspicious email to SecureX to get a recommendation of whether it is malicious or not.  If the submitted email is malicious, the end user will be notified of recommended next steps, and an event will be generated in SecureX alerting the security team.  To deliver this capability, the playbook pre-processes email to extract observables, determines the verdict for observables, hunts for targets involved and takes mitigation and/or preventative actions such as isolating the targets involved, blocking the malicious domain as necessary, etc.

Managed threat hunting

Only Cisco can bring multi-domain managed threat hunting capability across endpoint, cloud, email, etc. because of the breath and scope of our product portfolio.  Multi-domain managed threat hunting detects threats leveraging a combination of intel and data techniques to surface activity that might have slipped past traditional threat, behavioral, and ML-based techniques.  High fidelity threats confirmed by our Talos and Research teams are then communicated to customers through the SecureX activity panel as well as via emails with detail artifacts, targets involved, and remediation recommendations.

Fast time to value

Unlike other security platforms in the market, SecureX helps customers get value quickly.  Getting started is simple – if you have a CCO account, login and add products to SecureX by providing API keys and adding on-prem devices (for Firewall and on-prem Email solutions).  If you don’t have a CCO account, create a SecureX account on the homepage, add products to SecureX by providing an API key and adding on-prem devices (for Firewall and on-prem Email solutions).  You are ready to go in minutes vs. hours and days.

Saturday 22 February 2020

Best way to Prepare Cisco CCNA Collaboration (CICD) 210-060 Certificatio...


Exam Name: Implementing Cisco Collaboration Devices

Exam Number: 210-060 CICD

Exam Price: $300 USD

Duration: 75 minutes

Number of Questions: 55-65

Passing Score Variable: (750-850 / 1000 Approx.)

Recommended Training:

Implementing Cisco Collaboration Devices (CICD)

Exam Registration: PEARSON VUE

Sample Questions: Cisco 210-060 Sample Questions

Practice Exam: Cisco Certified Network Associate Collaboration Practice Test

Friday 21 February 2020

Is Your Firewall Permitting and Denying the Correct Flows?

Two days prior, a large US city fell victim to a ransomware attack that disabled a sizable portion of the municipal network. I found myself on an airplane a few hours later.

Cisco Prep, Cisco Exam Prep, Cisco Tutorial and Material, Cisco Certification

Our first order of business was to quarantine potentially infected systems away from known-clean systems. In the interest of time, we installed a large Cisco ASA firewall into the datacenter distribution layer as a crude segmentation barrier. Once management connectivity was established, I was tasked with firewall administration, a job that is generally monotonous, thankless, and easy to scapegoat when things go wrong.

Long story short, the network was changing constantly. Applications were being moved between subnets, systems were being torn down and rebuilt, and I was regularly tasked with updating the firewall rules to permit or deny specific flows. After about 30 minutes, I decided to apply some basic automation. Managing firewall configurations using Python scripts is powerful but not particularly new or interesting, so I won’t focus on that aspect today.

Instead, consider the more difficult question. How do you know that your firewall is permitting and denying the correct flows? Often times, we measure the effectiveness of our firewall by whether the applications are working. This is a good measure of whether the firewall is permitting the desirable flows, but NOT a good measure of whether the firewall is denying the undesirable flows. Answering this question was critical to our incident response efforts at the customer site.

How would you solve this problem?


I decided to use the `packet-tracer` command built into the ASA command line. The command supports native `xml` formatting, which makes it easy to parse into Python data structures. Using Python parlance, the output contains a list of dictionaries, each one describing a phase in the ASA processing pipeline. Stages might include an ACL check, route lookup, NAT, QoS, and more. After the phase list, a summary dictionary indicates the final result.

ASA1#packet-tracer input inside tcp 10.0.0.1 50000 192.168.0.1 80 xml
<Phase>
  <id>1</id>
  <type>ROUTE-LOOKUP</type>
  <subtype>Resolve Egress Interface</subtype>
  <result>ALLOW</result>
  <config/>
  <extra>found next-hop 192.0.2.1 using egress ifc management</extra>
</Phase>
<Phase>
  <id>2</id>
  <type>ACCESS-LIST</type>
  <subtype/>
  <result>DROP</result>
  <config>Implicit Rule</config>
  <extra>deny all</extra>
</Phase>
<result>
  <input-interface>UNKNOWN</input-interface>
  <input-status>up</input-status>
  <input-line-status>up</input-line-status>
  <output-interface>UNKNOWN</output-interface>
  <output-status>up</output-status>
  <output-line-status>up</output-line-status>
  <action>DROP</action>
  <drop-reason>(acl-drop) Flow is denied by configured rule</drop-reason>
</result>

Now, how to automate this? I decided to use a combination of Python packages:

1. Nornir, a task execution framework with concurrency support
2. Netmiko, a library for accessing network device command lines

The high-level logic is simple. On a per firewall basis, define a list of `checks` which contain all the inputs for a `packet-tracer` test. Each check also specifies a `should` key which helps answers our original business question; should this flow be allowed or dropped? This allows us to test both positive and negative cases explicitly. Checks can be TCP, UDP, ICMP, or any arbitrary IP protocol. The checks can also be defined in YAML or JSON format for each host. Here’s an example of a `checks` list for a specific firewall:

---
checks:
  - id: "DNS OUTBOUND"
    in_intf: "inside"
    proto: "udp"
    src_ip: "192.0.2.2"
    src_port: 5000
    dst_ip: "8.8.8.8"
    dst_port: 53
    should: "allow"
  - id: "HTTPS OUTBOUND"
    in_intf: "inside"
    proto: "tcp"
    src_ip: "192.0.2.2"
    src_port: 5000
    dst_ip: "20.0.0.1"
    dst_port: 443
    should: "allow"
  - id: "SSH INBOUND"
    in_intf: "management"
    proto: "tcp"
    src_ip: "fc00:192:0:2::2"
    src_port: 5000
    dst_ip: "fc00:8:8:8::8"
    dst_port: 22
    should: "drop"
  - id: "PING OUTBOUND"
    in_intf: "inside"
    proto: "icmp"
    src_ip: "192.0.2.2"
    icmp_type: 8
    icmp_code: 0
    dst_ip: "8.8.8.8"
    should: "allow"
  - id: "L2TP OUTBOUND"
    in_intf: "inside"
    proto: 115
    src_ip: "192.0.2.1"
    dst_ip: "20.0.0.1"
    should: "drop"
...

Inside of a Nornir task, the code iterates over the list of checks, assembling the proper `packet-tracer` command from the check data, and issuing the command to the device using Netmiko. Note that this task runs concurrently on all firewalls in the Nornir inventory, making it a good fit for networks with distributed firewalls. Below is a simplified version of the Python code to illustrate the high-level logic.

def run_checks(task):
    # Iterate over all supplied checks
    for chk in checks:
        # Build the string command from check details (not shown)
        cmd = get_cmd(chk)
        # Use netmiko to send the command and collect output
        task.run(
            task=netmiko_send_command,
            command_string=cmd
        )

Behind the scenes, the code transforms this XML data returned by the ASA into Python objects. Here’s what that dictionary might look like. It contains two keys: `Phase` is a list of dictionaries representing each processing phase, and `result` is the final summarized result/

{
  "Phase": [
    {
      "id": 1,
      "type": "ROUTE-LOOKUP",
      "subtype": "Resolve Egress Interface",
      "result": "ALLOW",
      "config": None,
      "extra": "found next-hop 192.0.2.1 using egress ifc management"
    },
    {
      "id": 2,
      "type": "ACCESS-LIST",
      "subtype": None,
      "result": "DROP",
      "config": "Implicit Rule",
      "extra": "deny all"
    }
  ],
  "result": {
    "input-interface": "UNKNOWN",
    "input-status": "up",
    "input-line-status": "up",
    "output-interface": "UNKNOWN",
    "output-status": "up",
    "output-line-status": "up",
    "action": "DROP",
    "drop-reason": "(acl-drop) Flow is denied by configured rule"
  }
}

In the interest of brevity, I won’t cover the extensive unit/system tests, minor CLI arguments, and dryrun process in this blog. Just know that the script will automatically output three different files. I used the new “processor” feature of Nornir to build this output. Rather than traversing the Nornir result structure after the tasks have completed, processors are event-based and will run at user-specified points in time, such as when a task starts, a task ends, a subtask starts, a subtask ends, etc.

One of the output formats is terse, human-readable text which contains the name of the check and the result. If a check should be allowed and it was allowed, or if a check should be dropped and it was dropped, is it considered successful. Any other combination of expected versus actual results indicates failure. Other formats include comma-separated value (CSV) files and JSON dumps that provide even more information from the `packet-tracer` result. Here’s the `terse` format when executed on two ASAs with hostnames `ASAV1` and `ASAV2`:

ASAV1 DNS OUTBOUND -> FAIL
ASAV1 HTTPS OUTBOUND -> PASS
ASAV1 SSH INBOUND -> PASS
ASAV1 PING OUTBOUND -> PASS
ASAV1 L2TP OUTBOUND -> PASS
ASAV2 DNS OUTBOUND -> PASS
ASAV2 HTTPS OUTBOUND -> FAIL
ASAV2 SSH INBOUND -> PASS
ASAV2 PING OUTBOUND -> PASS
ASAV2 L2TP OUTBOUND -> PASS

For the visual learners, here’s a high-level diagram that summarizes the project’s architecture. After Nornir is initialized with the standard `hosts.yaml` and `groups.yaml` inventory files, the host-specific checks are loaded for each device. Then, Nornir uses Netmiko to iteratively issue each `packet-tracer` command to each device. The results are recorded in three different output files which aggregate the results for easy viewing and archival.

Cisco Prep, Cisco Exam Prep, Cisco Tutorial and Material, Cisco Certification

If you’d like to learn more about the project or deploy it in your environment, check it out here on the Cisco DevNet Code Exchange. As a final point, I’ve built Cisco FTD support into this tool as well, but it is experimental and needs more in-depth testing. Happy coding!