Tuesday, 9 August 2022

Cisco Wireless 3D Analyzer: High Level View on Latest Innovations

Wireless connections are ubiquitous and have become a part of our daily lives no differently than electricity. Planning, maintaining, and troubleshooting  WiFi networks, optimized for today’s radio coverage and capacity requirements, may not be a simple task for an otherwise seasoned wireless network engineer.

Read More: 350-801: Implementing Cisco Collaboration Core Technologies (CLCOR)

While wireless technologies are ubiquitous, they interact steadily with the physical environment.  Architecting the best wireless coverage for a specific environment depends on many different physical factors like obstacles (walls, doors, windows), building geometry, furniture, and materials as well as the user density and intended usage. Different environments encounter a wide range of complexity across different verticals. For example, covering a moderate sized enterprise-office space could be as simple as correctly placing some APs (Access Points) with omni-directional antennas, while covering space with high ceiling such as a warehouse necessitates directional antennas to optimally cover the space and requires more engineering to get it dialed-in right. The challenge is that RF, unless visualized somehow, is invisible.  Providing the “super-power” to view the RF in sufficient context to determine the correct angles, power, coverage, and capacity needs requires innovation using specialized and outstanding tools. 

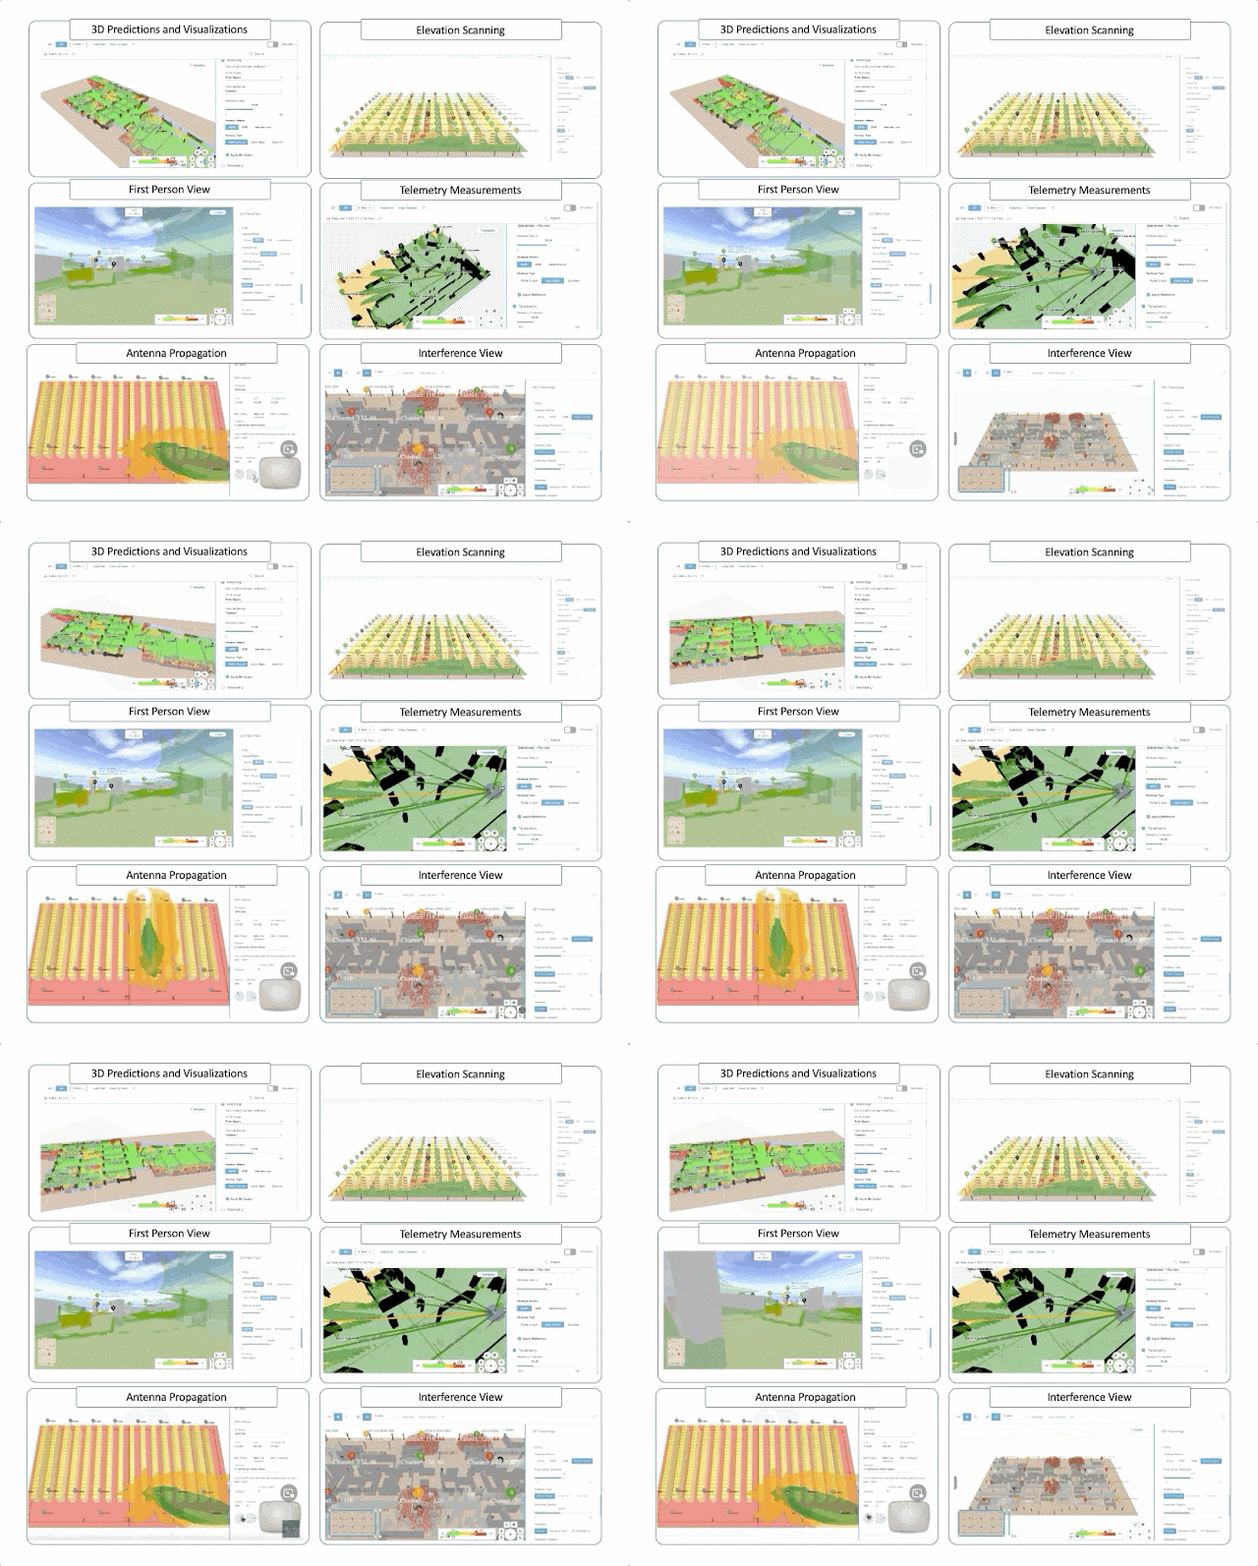
Cisco Wireless 3D Analyzer goal is to address challenges like these and enable RF design like never before possible! Cisco customers had access to this innovation starting with Cisco DNA Center release 2.2.3 providing features like the following: 

Cisco Wireless 3D Analyzer, Cisco Exam, Cisco Exam Prep, Cisco Tutorial and Materials, Cisco Career, Cisco Skills, Cisco Jobs, Cisco News
Figure 1. A few examples of Cisco Wireless 3D Analyzer features

What’s new? 


As we continue to drive innovation and lead the market with RF visualization, Cisco DNA Center release 2.3.3  brings new amazing key Wireless 3D Analyzer functionalities. This extends Cisco DNA Center’s tooling set and enables impeccable user experience on the wireless network. Below are a few of the new functionalities: 

Multi-floor Management

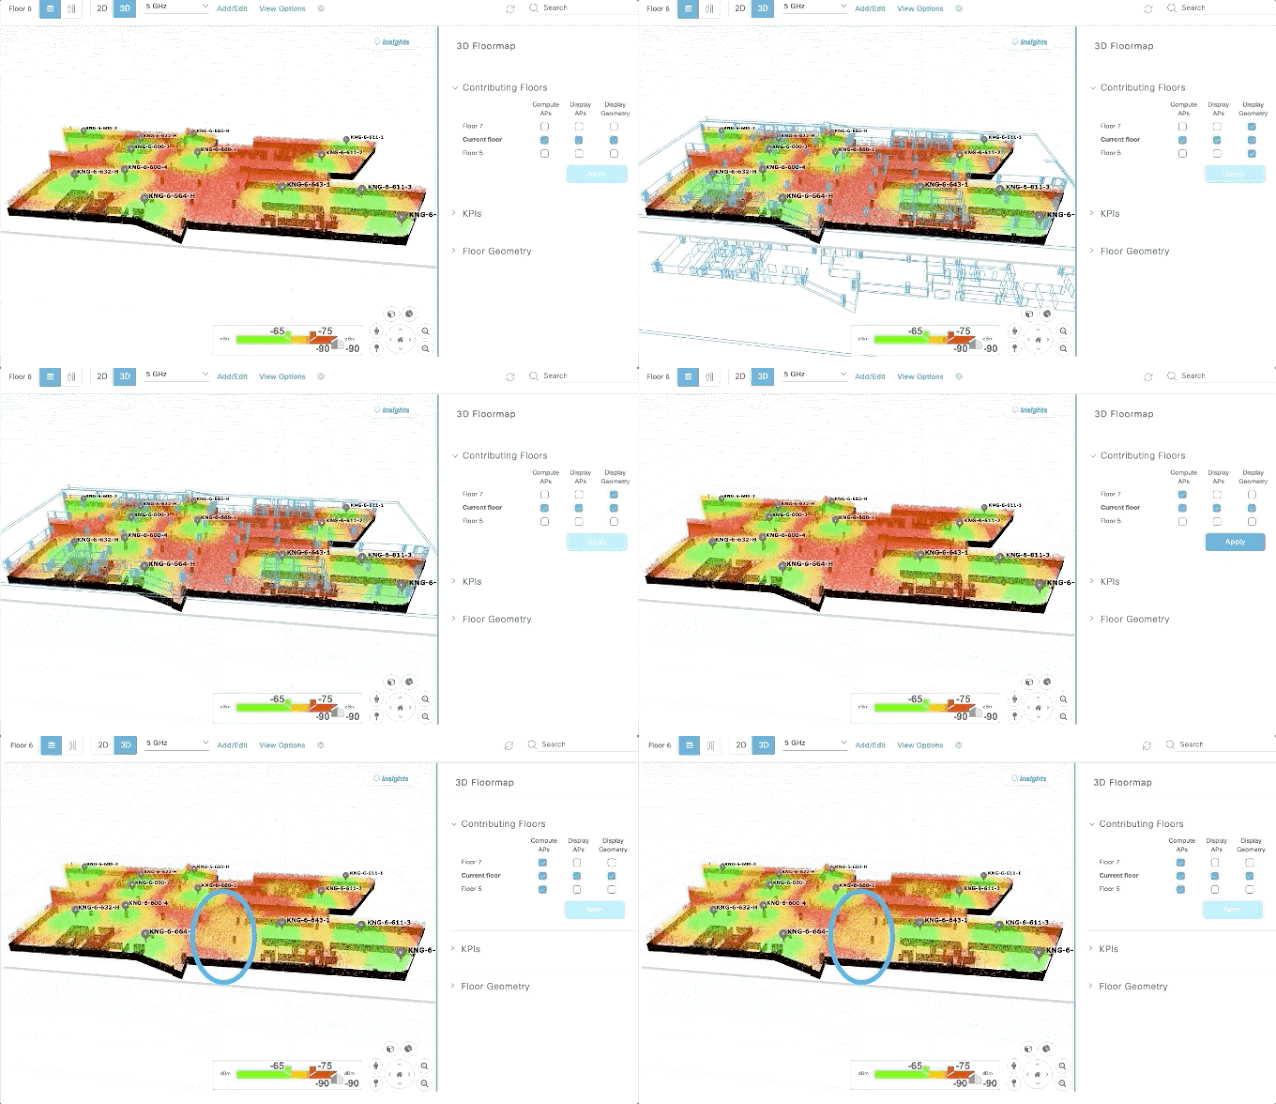
In scenarios where a network engineer needs to provide WiFi coverage in a high-rise office building, APs will be placed on each floor of the building to have the level of coverage desired (i.e. –65DBm). But one of the crucial issues is that APs on a given floor could create interferences to the adjacent floors below or above. This is why Cisco Wireless 3D Analyzer introduced the multi-floor view to provide the 3D perspective. Using this new functionality, the user can select adjacent floors up to 2 floors above and 2 floors below. Therefore, they can see what the contributions of RF impacts on the current floor are.

Cisco Wireless 3D Analyzer, Cisco Exam, Cisco Exam Prep, Cisco Tutorial and Materials, Cisco Career, Cisco Skills, Cisco Jobs, Cisco News
Figure 2. Multi-floor contributions

In figure 2, we can clearly see the contributions of intra-floor interferences from the floor above and below.  

Coverage Area Management

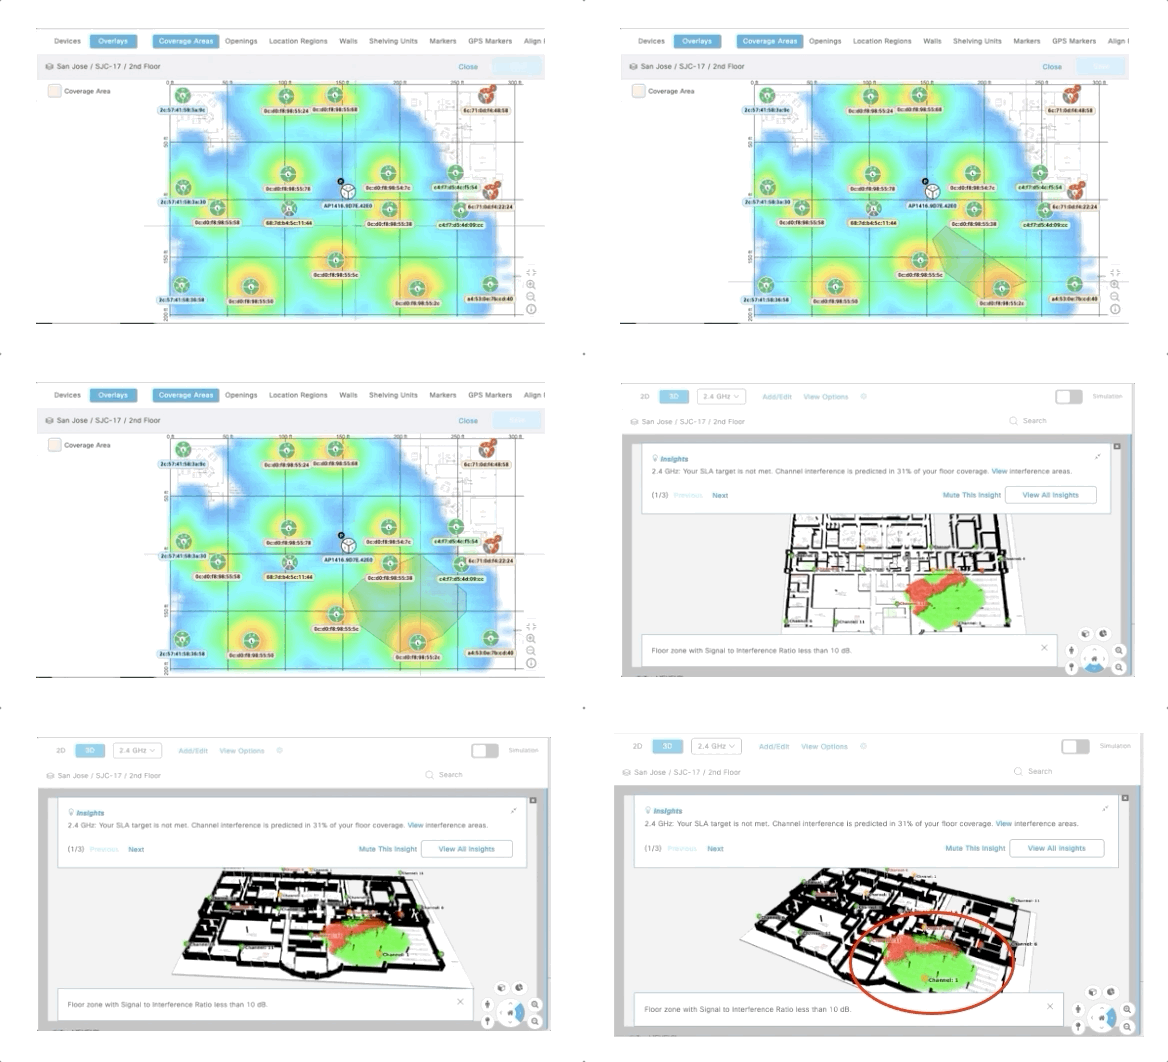
The Cisco Wireless 3D Analyzer Insights View allows an amazing deep dive into possible issues the wireless network can experience, and it can be configured according to key parameters and KPIs as shown in figure 3 below 

Cisco Wireless 3D Analyzer, Cisco Exam, Cisco Exam Prep, Cisco Tutorial and Materials, Cisco Career, Cisco Skills, Cisco Jobs, Cisco News
Figure 3. Example of insights configuration

A common use case is where the network engineer is interested in a specific area of the floor as opposed to the entire floor. Therefore, Cisco Wireless 3D Analyzer added the Coverage Area feature that allows the user to easily define the area of interest for a floor as shown in figure 4.

Cisco Wireless 3D Analyzer, Cisco Exam, Cisco Exam Prep, Cisco Tutorial and Materials, Cisco Career, Cisco Skills, Cisco Jobs, Cisco News
Figure 4. Coverage Area Management

With this functionality, Wireless 3D Analyzer will compute the insights for that specific area of interest to the network engineer.

3D Client Location

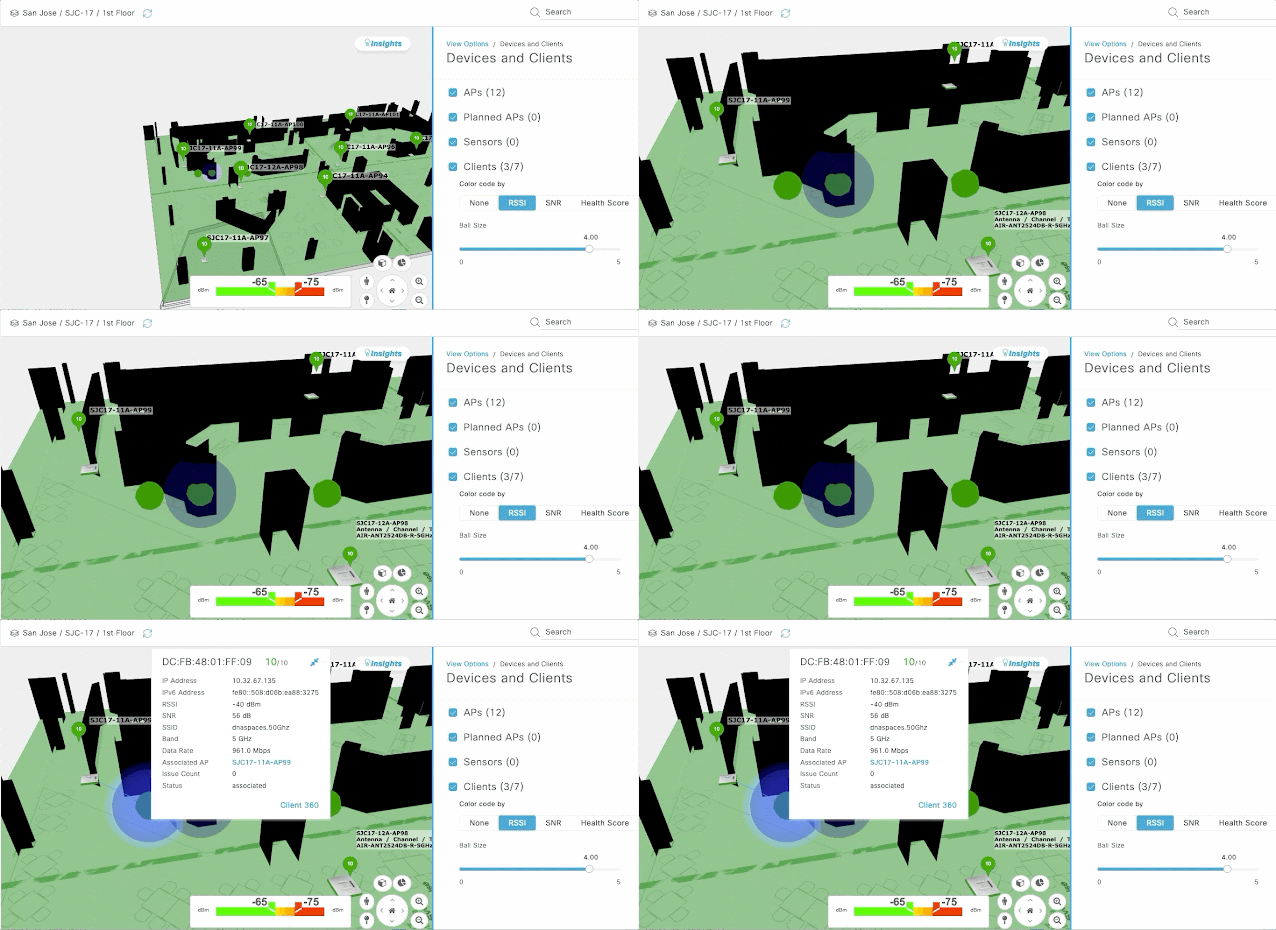
Wireless networks are there to support clients (humans or machines). Wireless 3D Analyzer now supports a Client Location View depicted in figure 5 below.

Cisco Wireless 3D Analyzer, Cisco Exam, Cisco Exam Prep, Cisco Tutorial and Materials, Cisco Career, Cisco Skills, Cisco Jobs, Cisco News
Figure 5. 3D client Location

Taking advantage of the integration with Cisco DNA Spaces, location analytics, and the related triangulations of the client’s positions, Cisco Wireless 3D analyzer can show the client’s location in the 3D space. Moreover, for those clients, Cisco DNA Center can track data around RSSI, SNR, or health scores in the same position. Finally, it collects all the available client data and shows it by clicking on the client on the 3D map. 

WiFi 6E Support 

Cisco recently shipped the first WiFi 6E APs (see more info at Cisco 6E launch), so Wireless 3D Analyzer supports and integrates the new 6GHz band together with the new WiFi 6E AP models.

Cisco Wireless 3D Analyzer, Cisco Exam, Cisco Exam Prep, Cisco Tutorial and Materials, Cisco Career, Cisco Skills, Cisco Jobs, Cisco News
Figure 6. 6GHz management within Wireless 3D Analyzer

In the picture above we can see how the coverage iso-surfaces change using the 6GHz band for the selected AP. 

Source: cisco.com

Monday, 8 August 2022

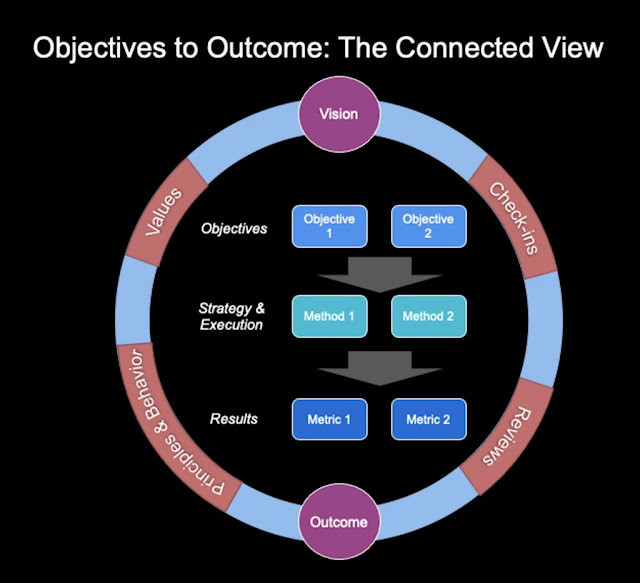
Operationalizing Objectives to Outcomes

Cisco Career, Cisco Skills, Cisco Jobs, Cisco Certification, Cisco Tutorial and Materials, Cisco Guides, Cisco Learning, Cisco Prep, Cisco Preparation

As part of our digital transformation, my Cisco colleagues and I were getting trained on business agility in our ONEx organization. Any transformation needs an effective way to measure the success at the end and throughout, and as part of our initiative, I could see there was enough awareness and emphasis given to metrics and measurements.

The training also addressed some points from the book “Measure What Matters,” which peaked my curiosity and inspired me to start reading it. It is a fantastic book with the origin of the Objectives and Key Results (OKR) concept and how companies have leveraged the framework. I wanted to share a bit here about how Cisco also embraces this framework – and more – in our organization, in a slightly customized and enhanced way, and how it can be extended further.

Finding Middle Ground between Vision, Strategy, and Execution

Although the OKR framework has generated more interest in recent decades, goals and metrics themselves have long been the foundation to any company to identify, set and succeed. As with technology, our approach to goals and metrics has also evolved over the time, namely to include a couple key concepts: MBO or Management by Objectives, and VSE or Vision, Strategy & Execution, extension of this, VSEM, to include Metrics.

Vision

The Vision has represented the true north-star of what the company wants to achieve. If we time box it, perhaps, 3 to 5 years or beyond, Vision does not change often unless the company goes through a major transformation or change of business. However, at an organization level or function level, it could change a bit but still align to the overall company vision. And, as you can imagine, there is still a healthy internal debate about whether one should have ONE single vision for all or a vision at each lower of functional levels – and different companies handle it in different ways.

Strategy

While Vision is a starting point, we need other elements to take it further. Strategy is the next level of Vision – how you plan to accomplish the vision. This could be multiple levers (or initiatives or methods or ways) to achieve the vision: A strategy, approach, or means to plan for the execution of it and, finally, deliver the desired outcome or results.

Execution

If Vision is the desired outcome, and Strategy is the big plan, then Execution is the detailed plan. The key to Execution is measurement, and thus it is often broken into smaller chunks – goals or objectives – which are easier to accomplish and show progress.

Finding Meaningful Measurements

In the process of transforming our operations I’ve found several things to be true, and helpful, during this endeavor:

1. As Peter Drucker said, “What cannot be measured, cannot be improved“, but even before improving upon a thing, identifying and establishing the right set of metrics is key for any goal. Drucker also observed, “A manager should be able to measure the performance and results against a goal.” However, truly effective organizations must not limit measurements to the management level, but instead, equip employees at every level to identify and track meaningful metrics. These metrics could be milestones or KPIs and can be annual, quarterly, or even monthly. Some of these metrics could be in multiple systems (say ERP or CRM or ITSM) or Project Portfolio Management tools. The goals and objectives can be (and in some cases should be) inherited either vertically or across the organization or cross-functionally beyond the organization for shared goals.

2. When employing new measurement metrics within a company, the ideal scenario would be to integrate, automate, and bring all of these metrics into one single dashboard. A one-stop shop for metrics viewing simplifies the process, ensuring that there is minimal manual work involved in updating these metrics periodically. Several of the SaaS solutions provide APIs that can be used to easily integrate and get the needed metric and based on a set threshold, can even provide indicators about whether metrics have been achieved, and communicate that critical information in real-time to impacted teams.

3. Although Goals & Results could be separately reviewed from employee performance review discussions, the ideal would be to review them together.

4. WHAT was achieved should be equally evaluated with HOW it was achieved. Equally important to the Vision are the types of behaviors that were exhibited to accomplish these results, and they should be reviewed to ensure that we understand and agree with the methods and the values represented in the achievement.

5. It’s critical that metrics and measurements are looked at holistically and together. Operationalization of the entire framework, process, or activity makes it efficient for the organization, but defining and setting meaningful metrics cannot be a one-time activity. Putting a structure and defining these annually is a good start but this is just the beginning – goals need to be measured, reviewed, revisited, and adjusted as needed.

Cisco Career, Cisco Skills, Cisco Jobs, Cisco Certification, Cisco Tutorial and Materials, Cisco Guides, Cisco Learning, Cisco Prep, Cisco Preparation

Operationalization of the OKR framework can include various elements:

1. Conducting reviews at Initiative, Program, and Project level – leveraging metrics from the Portfolio Management and other IT Systems/Tools

2. Organizational health metrics from various sources

3. Ongoing operational reviews (RtB or Run your Business) – both IT (ideal to do weekly, monthly, and quarterly) and Business Reviews (ideal is Quarterly)

Among all of these observations I’ve made through this process, one of the most critical ones is that the information about meaningful metrics cannot be created and kept safe somewhere secretly. Instead, it needs to be published centrally, so that anyone can check on the goals of their colleagues and leaders at any point in time. This not only brings transparency and trust but also avoids duplication when found.

We are still in the process of creating a more mature, sophisticated practice around our internal OKRs, and in parallel, my colleagues across Cisco are also applying metrics to inform smarter, more efficient operations within our customer organizations.

For those who want to dig into the topic even more deeply, click here to learn more about how Cisco’s IoT practice is using metrics as a powerful tool in our customers’ digital transformation.

On that note, how is your team doing it? What can you share about what it takes to set and achieve measurable goals in your organization’s digital transformation? 

Source: cisco.com
Sunday, 7 August 2022

Compliant or not? Cisco DNA Center will help you figure this out.

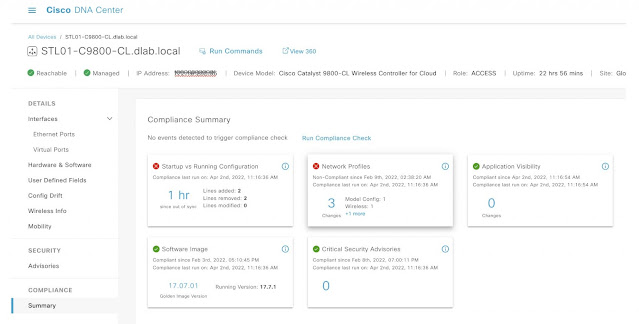
Clear visibility of device compliance is key for network operations. One of the biggest challenges though is to agree upon the definition of compliance since different environments have different requirements. The purpose of this blog is to share the current compliance capabilities in Cisco DNA Center that will help network administrators to keep the infrastructure safe and consistent.

The current version of Cisco DNA Center, looks at device compliance from five different lenses in a non-SD-Access network: startup vs. running-config, network profiles, application visibility, software image, and critical security advisories.

Cisco DNA Center, Cisco Tutorial and Materials, Cisco Certification, Cisco Guides, Cisco Career, Cisco Skills, Cisco Certification, Cisco Jobs, Cisco Prep, Cisco Preparation
Figure 1: Compliance Types

Startup vs Running Configuration


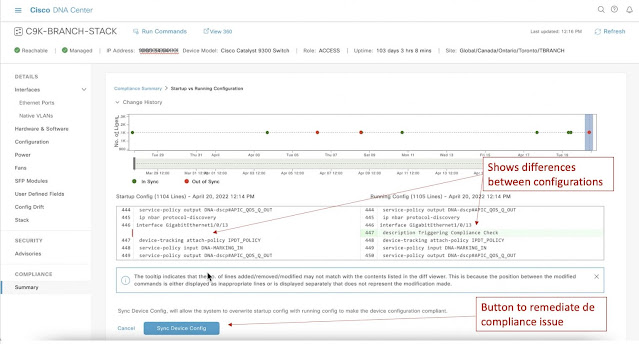
Have you ever configured a device and forgotten to save the running configuration only to have the device reboot unexpectedly?  The result of this could be catastrophic resulting in numerous issues in the network. Even though the preferred method for device configuration is through Cisco DNA Center, manual changes are still permitted. To avoid inconsistencies between startup and running configurations, Cisco DNA Center provides a compliance check by flagging any devices that have a startup and running configurations that don’t match.

In the snapshot below, we see how Cisco DNA Center provides visualization of the differences between the running and startup configuration.  In this example, the network administrator manually added a description to an interface and forgot to save the new configuration. Cisco DNA Center also provides a way to remediate this problem with a button to “Synch Device Config” which saves the running-config into startup-config.

Cisco DNA Center, Cisco Tutorial and Materials, Cisco Certification, Cisco Guides, Cisco Career, Cisco Skills, Cisco Certification, Cisco Jobs, Cisco Prep, Cisco Preparation
Figure 2: Config Differences and Remediation option

Network Profiles


One of Cisco DNA Center’s greatest values is the automation it brings by leveraging Intent-Based Networking (IBN). One of the constructs that Cisco DNA Center uses to implement IBN is network profiles. Network profiles contain different aspects of intent-based networking including wireless and model-based configuration (for wireless devices) and templates (for all devices). Via compliance checks, Cisco DNA Center can flag any configuration deviation from these constructs.

Let’s say that we have a simple template in Cisco DNA Center pushing a “vlan” configuration to a port:

TBRANCH-C9200L-2#show run int gig 1/0/7
Building configuration...

Current configuration : 344 bytes
!
interface GigabitEthernet1/0/7
description Description pushed by DNAC Template -- lan
switchport access vlan 419
switchport mode access
device-tracking attach-policy IPDT_POLICY
ip flow monitor dnacmonitor input
ip flow monitor dnacmonitor output
service-policy input DNA-MARKING_IN
service-policy output DNA-dscp#APIC_QOS_Q_OUT
end

In this example, we will assume that someone manually removed the “vlan” configuration that has been pushed by Cisco DNA Center templates:

TBRANCH-C9200L-2#conf t
Enter configuration commands, one per line. End with CNTL/Z.
TBRANCH-C9200L-2(config)#int gig 1/0/7
TBRANCH-C9200L-2(config-if)#no switchport access vlan 419
TBRANCH-C9200L-2(config-if)#

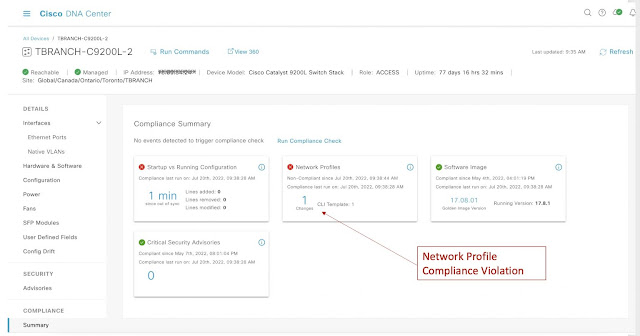
This action will trigger a “Network Profile” compliance violation as seen in the snapshots below:

Cisco DNA Center, Cisco Tutorial and Materials, Cisco Certification, Cisco Guides, Cisco Career, Cisco Skills, Cisco Certification, Cisco Jobs, Cisco Prep, Cisco Preparation
Figure 3: Network Profile Compliance Violation

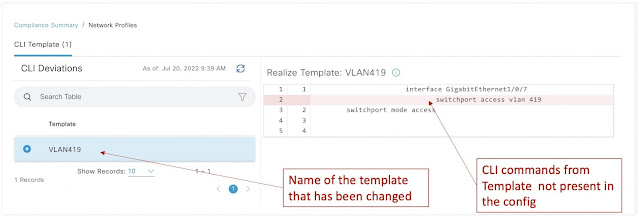
Cisco DNA Center clearly identifies the template that has been changed in the device and the specific lines of configuration that have been removed:

Cisco DNA Center, Cisco Tutorial and Materials, Cisco Certification, Cisco Guides, Cisco Career, Cisco Skills, Cisco Certification, Cisco Jobs, Cisco Prep, Cisco Preparation
Figure 4: CLI commands from Template not present in the config

Application Visibility


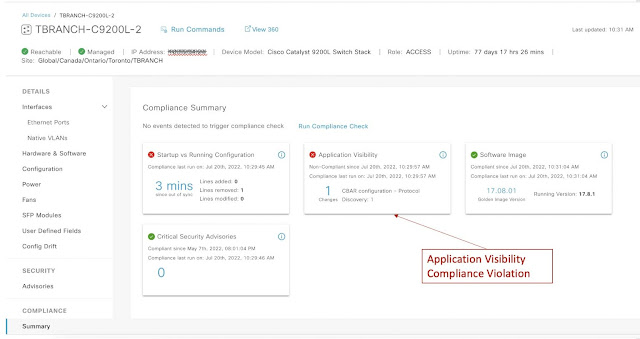
Cisco DNA Center also leverages Intent-Based Networking (IBN) to provision devices for visibility of applications through CBAR and NBAR.  If there are any changes to this intent, the devices will be marked as non-compliant for “Application Visibility” as seen in the example below.

The device has CBAR (Controller Based Application Recognition) enabled via DNA Center:

interface GigabitEthernet1/0/7
description Description pushed by DNAC Template -- lan
switchport access vlan 419
switchport mode access
device-tracking attach-policy IPDT_POLICY
ip flow monitor dnacmonitor input
ip flow monitor dnacmonitor output
service-policy input DNA-MARKING_IN
service-policy output DNA-dscp#APIC_QOS_Q_OUT
ip nbar protocol-discovery
end

Configuration is manually removed from the device:

TBRANCH-C9200L-2(config)#int gig 1/0/7
TBRANCH-C9200L-2(config-if)#no ip nbar protocol-discovery
TBRANCH-C9200L-2(config-if)#

Cisco DNA Center, Cisco Tutorial and Materials, Cisco Certification, Cisco Guides, Cisco Career, Cisco Skills, Cisco Certification, Cisco Jobs, Cisco Prep, Cisco Preparation
Figure 5: Application Visibility Compliance Violation

Cisco DNA Center, Cisco Tutorial and Materials, Cisco Certification, Cisco Guides, Cisco Career, Cisco Skills, Cisco Certification, Cisco Jobs, Cisco Prep, Cisco Preparation
Figure 6: Configuration removed for this interface

Software Image


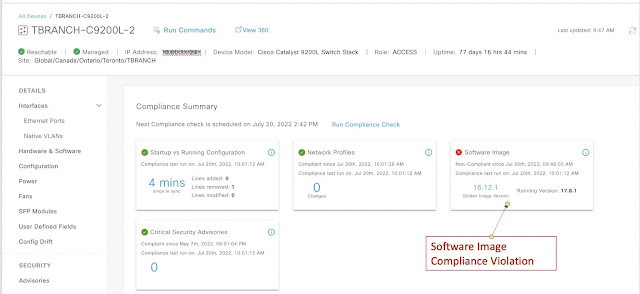
Cisco DNA Center uses the concept of “Golden Image” to support image consistency within a site. When devices have images different from “Golden Image”, it will trigger the “Software Image” compliance violation as seen in the snapshots below:

Cisco DNA Center, Cisco Tutorial and Materials, Cisco Certification, Cisco Guides, Cisco Career, Cisco Skills, Cisco Certification, Cisco Jobs, Cisco Prep, Cisco Preparation
Figure 7: Software Compliance Violation

Cisco DNA Center, Cisco Tutorial and Materials, Cisco Certification, Cisco Guides, Cisco Career, Cisco Skills, Cisco Certification, Cisco Jobs, Cisco Prep, Cisco Preparation
Figure 8: Device Image different from Golden Image

Critical Security Advisories


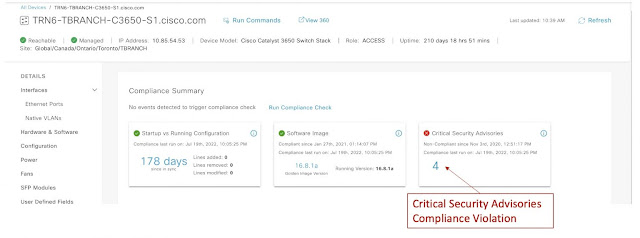
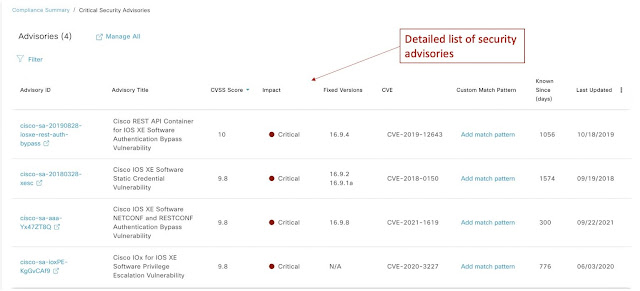
Devices with critical security vulnerabilities will also trigger a compliance check as shown in the snapshots below:

Cisco DNA Center, Cisco Tutorial and Materials, Cisco Certification, Cisco Guides, Cisco Career, Cisco Skills, Cisco Certification, Cisco Jobs, Cisco Prep, Cisco Preparation
Figure 9: Critical Security Advisories Compliance Violation

Cisco DNA Center, Cisco Tutorial and Materials, Cisco Certification, Cisco Guides, Cisco Career, Cisco Skills, Cisco Certification, Cisco Jobs, Cisco Prep, Cisco Preparation
Figure 10: Detailed list of security advisories

Source: cisco.com

Saturday, 6 August 2022

Cisco 350-201 CBRCOR: How to Prepare for CyberOps Professional Certification?


Cisco CBRCOR Exam Description:

Performing CyberOps Using Cisco Security Technologies v1.0 (CBRCOR 350-201) is a 120-minute exam that is associated with the Cisco CyberOps Professional Certification. This exam tests a candidate's knowledge of core cybersecurity operations including cybersecurity fundamentals, techniques, processes, and automation. The course Performing CyberOps Using Cisco Core Security Technologies helps candidates to prepare for this exam.

Cisco 350-201 Exam Overview:

RELATED READ:

Latest Innovations in Cisco DNA Software for Switching

Cisco continues to deliver on its promise of innovation in our Cisco DNA software for Switching subscription. By deploying the latest innovations in Cisco DNA software for Switching along with Cisco DNA Center, you can unlock the full power of your Catalyst switches in a user-friendly way. It’s no question that Cisco DNA Center is the most powerful management platform for your Catalyst devices over any third-party network management system.

What’s new?

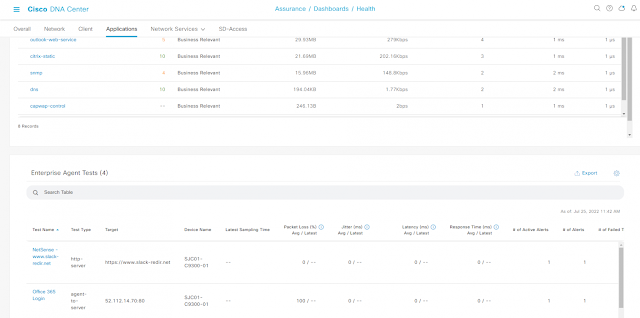
ThousandEyes integration (Application assurance): Cisco DNA Center can provide visibility into how your applications are performing, which is improved as a result of the out-of-the-box integration with ThousandEyes (TE). TE agents are included in Cisco DNA Software subscriptions at the Advantage level in specific models, they just need to be deployed out to your switches. You can see applications that TE agents are monitoring in the dashboard and get a performance summary (loss, latency, jitter) with the ability to drill down further. Not only does TE provide insight into your internal network, but also service providers.

Cisco DNA Software, Cisco Tutorial and Materials, Cisco Guides, Cisco Tutorial and Materials, Cisco Career, Cisco Skills, Cisco Jobs, Cisco Learning
Figure 1: ThousandEyes integration in Cisco DNA Center

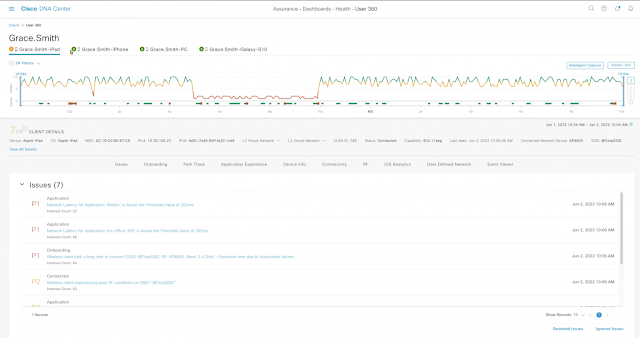
Client Health: This feature allows you to quickly and efficiently understand how well the network is supporting end-users. The impact of any issues can be minimized for end users as well as IT staff in terms of issue resolution. You have the ability to drill down and search for specific users and get a 360 view of the health of their devices to pinpoint any downtimes.

Cisco DNA Software, Cisco Tutorial and Materials, Cisco Guides, Cisco Tutorial and Materials, Cisco Career, Cisco Skills, Cisco Jobs, Cisco Learning
Figure 2: Client 360 in Cisco DNA Center

PoE analytics: As people return to the office, it is important to be able to understand the power in remote offices. PoE analytics will allow IT to troubleshoot issues by looking at key attributes of PoE. For example, if a device is pulling more power, it is usually an indication that it may break. Action can be taken to disable specific ports or even power cycle ports.

Cisco DNA Software, Cisco Tutorial and Materials, Cisco Guides, Cisco Tutorial and Materials, Cisco Career, Cisco Skills, Cisco Jobs, Cisco Learning
Figure 3: PoE Analytics

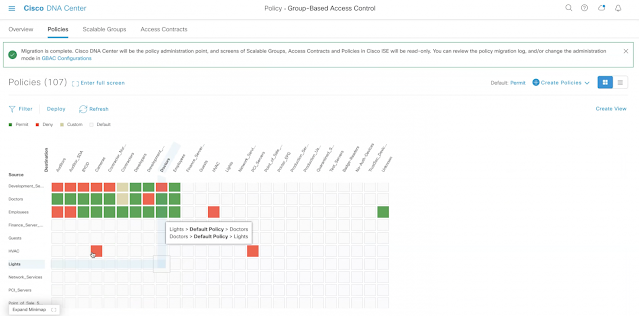
Group Policy with ISE: The integration of Cisco DNA Center and ISE to control policy on a Cisco network provides a level of security that is unmatched in the industry. You can visualize what’s going on in your network and what devices and servers are communicating with each other. This allows you to make corrections as needed and ultimately prevent any security breaches.

Cisco DNA Software, Cisco Tutorial and Materials, Cisco Guides, Cisco Tutorial and Materials, Cisco Career, Cisco Skills, Cisco Jobs, Cisco Learning
Figure 4: Cisco DNA Center integration with ISE

Cisco DNA Spaces for Smart Buildings: Cisco DNA Spaces, a cloud-based data platform for IoT devices, gives smart building managers an all-encompassing view of operations and power consumption of smart lighting and shades, conference room availability, and cleaning frequency, and asset location, to name a few. Cisco DNA Spaces entitlement for Smart Buildings (See and Extend) is included in Cisco DNA Advantage licenses for Cisco Catalyst 9300 and 9400 Series Switches.

Cisco DNA Software, Cisco Tutorial and Materials, Cisco Guides, Cisco Tutorial and Materials, Cisco Career, Cisco Skills, Cisco Jobs, Cisco Learning
Figure 5: Cisco DNA Spaces

How can I get these features and more?


If you already have a Cisco DNA Advantage subscription in Switching along with Cisco DNA Center, you will get to utilize these features at no additional cost to you.

If you do not have a Cisco DNA Advantage subscription or if you have a Cisco DNA Essentials subscription, the time to upgrade is now. We will continue to innovate and add more wireless features to our advantage tier.

Cisco is expanding the deployment options of Cisco DNA Center to provide greater operational flexibility and choice.


Cisco DNA Center is currently installed on a dedicated appliance. However, we recently announced at Cisco Live a new option for Cisco DNA Center customers, the Cisco DNA Center Virtual Appliance. The virtual appliance which is targeted for general availability next year will give customers new deployment options for a network controller to deploy in a public cloud on AWS or on VMware ESXi within a company data center or in a private cloud.

Source: cisco.com
Thursday, 4 August 2022

Stop DDoS at the 5G Network Edge

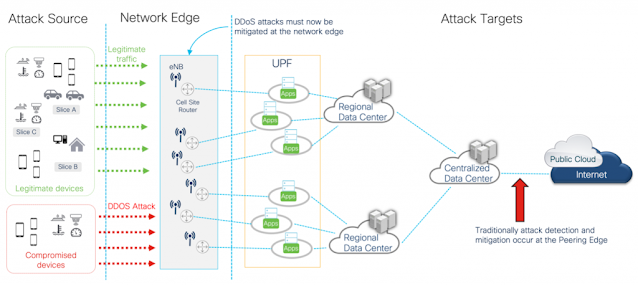
The increase in bandwidth demand and access to engaging online content has led to a rapid expansion of 5G technology deployments. This combination of increased demand from a multitude of user equipment devices (laptops, mobile phones, tablets) and rapid technology deployment has created a diverse threat surface potentially affecting the availability and sustainability of desired low latency outcomes (virtual reality, IoT, online gaming, etc.). One of the newer threats is an attack from rogue or BoT-controlled IoT and user equipment devices designed to flood the network with diverse flows at the access layer, potentially exposing the entire network to a much larger DDoS attack.

With the new Cisco Secure DDoS Edge Protection solution, communication service providers (CSPs) now have an efficient DDoS detection and mitigation solution that can thwart attacks right at the access layer. The solution focuses on 5G deployments, providing an efficient attack detection and mitigation solution for GPRS Tunneling Protocol (GTP) traffic. This will help prevent malicious traffic from penetrating deeper into a CSP network. To achieve the quality of experience (QoE) targets that customers demand in 5G networks, architectures should include the following features:

◉ Remove access level anomalies at the cell site router (CSR) to preserve QoE for users accessing 5G applications

◉ Remediate user equipment anomalies on the ingress port of the CSR to remove overages in backhaul resources like microwave backhaul

◉ Automate both east-west and north-south attack life cycles to remove collateral damage on the network and to preserve application service level agreements for customers

Cisco Certifications, Cisco Tutorial and Materials, Cisco Career, Cisco Skills, Cisco Jobs, Cisco News, Cisco Guides
Figure 1. DDoS attack protection at the 5G network edge

The Cisco Secure DDoS Edge Protection solution offers the ability to detect and mitigate the threats as close to the source as possible – the edge. It features a docker container (detector) integrated into IOS XR and a centralized controller. The system is also air gapped and requires no connectivity outside of the CSP network to operate. The controller performs lifecycle management of the detector, orchestration of detectors across multiple CSRs, and aggregation of telemetry and policy across the network. Having the container integrated into IOS XR allows services to be pushed to the edge to meet availability and QoE requirements for 5G services, while the controller provides a central nervous system for delivering secure outcomes for 5G. Important threats addressed by the Cisco Secure DDoS Edge Protection solution include IoT Botnets, DNS attacks, burst attacks, layer 7 application attacks, attacks inside of GTP tunnels, and reflection and amplification attacks.

Cisco Certifications, Cisco Tutorial and Materials, Cisco Career, Cisco Skills, Cisco Jobs, Cisco News, Cisco Guides
Figure 2. Edge protection solution on the Cisco Network Convergence System (NCS) 540

Moving the DDoS attack detection and mitigation agent to the CSR helps speed up the attack response and can lower overall latency. Additionally, efficiency enhancements have been made to the solution in the following ways:

◉ GTP flows are first extracted at the ASIC layer using user-defined filters (UDFs) in IOS XR before they are sampled for NetFlow. This allows more attack bandwidth protection with the same sampling rate.
◉ Tunnel endpoint Identifiers (TEIDs) of GTP flows are extracted and included in the NetFlow data.
◉ Extracted NetFlow data is exported to the detector on the router and formatted using Google Protocol buffers.

Given that the NetFlow data doesn’t need to be exported to a centralized entity and is consumed locally on the router, faster attack detection and mitigation is possible.

Source: cisco.com

Tuesday, 2 August 2022

Exploring the Linux ‘ip’ Command

Cisco Exam, Cisco Certification, Cisco Exam Prep, Cisco Tutorial and Material, Cisco Guides, Cisco Career, Cisco Skills, Cisco Jobs, Cisco Preparation

I’ve been talking for several years now about how network engineers need to become comfortable with Linux. I generally position it that we don’t all need to become “big bushy beard-bearing sysadmins.” Rather, network engineers must be able to navigate and work with a Linux-based system confidently. I’m not going to go into all the reasons I believe that in this post (if you’d like a deeper exploration of that topic, please let me know). Nope… I want to dive into a specific skill that every network engineer should have: exploring the network configuration of a Linux system with the “ip” command.

A winding introduction with some psychology and an embarrassing fact (or two)

If you are like me and started your computing world on a Windows machine, maybe you are familiar with “ipconfig” on Windows. The “ipconfig” command provides details about the network configuration from the command line.

A long time ago, before Hank focused on network engineering and earned his CCNA for the first time, he used the “ipconfig” command quite regularly while supporting Windows desktop systems.

What was the IP assigned to the system? Was DHCP working correctly? What DNS servers are configured? What is the default gateway? How many interfaces are configured on the system? So many questions he’d use this command to answer. (He also occasionally started talking in the third person.)

It was a great part of my toolkit. I’m actually smiling in nostalgia as I type this paragraph.

For old times’ sake, I asked John Capobianco, one of my newest co-workers here at Cisco Learning & Certifications, to send me the output from “ipconfig /all” for the blog. John is a diehard Windows user still, while I converted to Mac many years ago. And here is the output of one of my favorite Windows commands (edited for some privacy info).

Windows IP Configuration

   Host Name . . . . . . . . . . . . : WINROCKS

   Primary Dns Suffix  . . . . . . . :

   Node Type . . . . . . . . . . . . : Hybrid

   IP Routing Enabled. . . . . . . . : No

   WINS Proxy Enabled. . . . . . . . : No

   DNS Suffix Search List. . . . . . : example.com

Ethernet adapter Ethernet:

   Connection-specific DNS Suffix  . : home

   Description . . . . . . . . . . . : Intel(R) Ethernet Connection (12) I219-V

   Physical Address. . . . . . . . . : 24-4Q-FE-88-HH-XY

   DHCP Enabled. . . . . . . . . . . : Yes

   Autoconfiguration Enabled . . . . : Yes

   Link-local IPv6 Address . . . . . : fe80::31fa:60u2:bc09:qq45%13(Preferred)

   IPv4 Address. . . . . . . . . . . : 192.168.122.36(Preferred)

   Subnet Mask . . . . . . . . . . . : 255.255.255.0

   Lease Obtained. . . . . . . . . . : July 22, 2022 8:30:42 AM

   Lease Expires . . . . . . . . . . : July 25, 2022 8:30:41 AM

   Default Gateway . . . . . . . . . : 192.168.2.1

   DHCP Server . . . . . . . . . . . : 192.168.2.1

   DHCPv6 IAID . . . . . . . . . . . : 203705342

   DHCPv6 Client DUID. . . . . . . . : 00-01-00-01-27-7B-B2-1D-24-4Q-FE-88-HH-XY

   DNS Servers . . . . . . . . . . . : 192.168.122.1

   NetBIOS over Tcpip. . . . . . . . : Enabled

Wireless LAN adapter Wi-Fi:

   Media State . . . . . . . . . . . : Media disconnected

   Connection-specific DNS Suffix  . : home

   Description . . . . . . . . . . . : Intel(R) Wi-Fi 6 AX200 160MHz

   Physical Address. . . . . . . . . : C8-E2-65-8U-ER-BZ

   DHCP Enabled. . . . . . . . . . . : Yes

   Autoconfiguration Enabled . . . . : Yes

Ethernet adapter Bluetooth Network Connection:

   Media State . . . . . . . . . . . : Media disconnected

   Connection-specific DNS Suffix  . :

   Description . . . . . . . . . . . : Bluetooth Device (Personal Area Network)

   Physical Address. . . . . . . . . : C8-E2-65-A7-ER-Z8

   DHCP Enabled. . . . . . . . . . . : Yes

   Autoconfiguration Enabled . . . . : Yes

It is still such a great and handy command. A few new things in there from when I was using it daily (IPv6, WiFi, Bluetooth), but it still looks like I remember.

The first time I had to touch and work on a Linux machine, I felt like I was on a new planet. Everything was different, and it was ALL command line. I’m not ashamed to admit that I was a little intimidated. But then I found the command “ifconfig,” and I began to breathe a little easier. The output didn’t look the same, but the command itself was close. The information it showed was easy enough to read. So, I gained a bit of confidence and knew, “I can do this.”

When I jumped onto the DevNet Expert CWS VM that I’m using for this blog to grab the output of the “ifconfig” command as an example, I was presented with this output.

(main) expert@expert-cws:~$ ifconfig

Command 'ifconfig' not found, but can be installed with:

apt install net-tools

Please ask your administrator.

This brings me to the point of this blog post. The “ifconfig” command is no longer the best command for viewing the network interface configuration in Linux. In fact, it hasn’t been the “best command” for a long time. Today the “ip” command is what we should be using.  I’ve known this for a while, but giving up something that made you feel comfortable and safe is hard. Just ask my 13-year-old son, who still sleeps with “Brown Dog,” the small stuffed puppy I gave him the day he was born. As for me, I resisted learning and moving to the “ip” command for far longer than I should have.

Eventually, I realized that I needed to get with the times. I started using the “ip” command on Linux. You know what, it is a really nice command. The “ip” command is far more powerful than “ifconfig.”

When I found myself thinking about a topic for a blog post, I figured there might be another engineer or two out there who might appreciate a personal introduction to the “ip” command from Hank.

But before we dive in, I can’t leave a cliffhanger like that on the “ifconfig” command.

root@expert-cws:~# apt-get install net-tools

(main) expert@expert-cws:~$ ifconfig

docker0: flags=4099<UP,BROADCAST,MULTICAST>  mtu 1500

        inet 172.17.0.1  netmask 255.255.0.0  broadcast 172.17.255.255

        ether 02:42:9a:0c:8a:ee  txqueuelen 0  (Ethernet)

        RX packets 0  bytes 0 (0.0 B)

        RX errors 0  dropped 0  overruns 0  frame 0

        TX packets 0  bytes 0 (0.0 B)

        TX errors 0  dropped 0 overruns 0  carrier 0  collisions 0

ens160: flags=4163<UP,BROADCAST,RUNNING,MULTICAST>  mtu 1500

        inet 172.16.211.128  netmask 255.255.255.0  broadcast 172.16.211.255

        inet6 fe80::20c:29ff:fe75:9927  prefixlen 64  scopeid 0x20

        ether 00:0c:29:75:99:27  txqueuelen 1000  (Ethernet)

        RX packets 85468  bytes 123667981 (123.6 MB)

        RX errors 0  dropped 0  overruns 0  frame 0

        TX packets 27819  bytes 3082651 (3.0 MB)

        TX errors 0  dropped 0 overruns 0  carrier 0  collisions 0

lo: flags=73<UP,LOOPBACK,RUNNING>  mtu 65536

        inet 127.0.0.1  netmask 255.0.0.0

        inet6 ::1  prefixlen 128  scopeid 0x10

        loop  txqueuelen 1000  (Local Loopback)

        RX packets 4440  bytes 2104825 (2.1 MB)

        RX errors 0  dropped 0  overruns 0  frame 0

        TX packets 4440  bytes 2104825 (2.1 MB)

        TX errors 0  dropped 0 overruns 0  carrier 0  collisions 0

There it is, the command that made me feel a little better when I started working with Linux.

Exploring the IP configuration of your Linux host with the “ip” command!

So there you are, a network engineer sitting at the console of a Linux workstation, and you need to explore or change the network configuration. Let’s walk through a bit of “networking 101” with the “ip” command.

First up, let’s see what happens when we just run “ip.”

(main) expert@expert-cws:~$ ip

Usage: ip [ OPTIONS ] OBJECT { COMMAND | help }

       ip [ -force ] -batch filename

where  OBJECT := { link | address | addrlabel | route | rule | neigh | ntable |

                   tunnel | tuntap | maddress | mroute | mrule | monitor | xfrm |

                   netns | l2tp | fou | macsec | tcp_metrics | token | netconf | ila |

                   vrf | sr | nexthop }

       OPTIONS := { -V[ersion] | -s[tatistics] | -d[etails] | -r[esolve] |

                    -h[uman-readable] | -iec | -j[son] | -p[retty] |

                    -f[amily] { inet | inet6 | mpls | bridge | link } |

                    -4 | -6 | -I | -D | -M | -B | -0 |

                    -l[oops] { maximum-addr-flush-attempts } | -br[ief] |

                    -o[neline] | -t[imestamp] | -ts[hort] | -b[atch] [filename] |

                    -rc[vbuf] [size] | -n[etns] name | -N[umeric] | -a[ll] |

                    -c[olor]}

There’s some interesting info just in this help/usage message. It looks like “ip” requires an OBJECT on which a COMMAND is executed. And the possible objects include several that jump out at the network engineer inside of me.

◉ link – I’m curious what “link” means in this context, but it catches my eye for sure

◉ address – This is really promising. The ip “addresses” assigned to a host is high on the list of things I know I’ll want to understand.

◉ route – I wasn’t fully expecting “route” to be listed here if I’m thinking in terms of the “ipconfig” or “ifconfig” command. But the routes configured on a host is something I’ll be interested in.

◉ neigh – Neighbors? What kind of neighbors?

◉ tunnel – Oooo… tunnel interfaces are definitely interesting to see here.

◉ maddress, mroute, mrule – My initial thought when I saw “maddress” was “MAC address,” but then I looked at the next two objects and thought maybe it’s “multicast address.” We’ll leave “multicast” for another blog post.

The other objects in the list are interesting to see. Having “netconf” in the list was a happy surprise for me. But for this blog post, we’ll stick with the basic objects of link, address, route, and neigh.

Where in the network are we? Exploring “ip address”

First up in our exploration will be the “ip address” object. Rather than just go through the full command help or man page line (ensuring no one ever reads another post of mine), I’m going to look at some common things I might want to know about the network configuration on a host. As you are exploring on your own, I would highly recommend exploring “ip address help” as well as “man ip address” for more details.  These commands are very powerful and flexible.

What is my IP address?

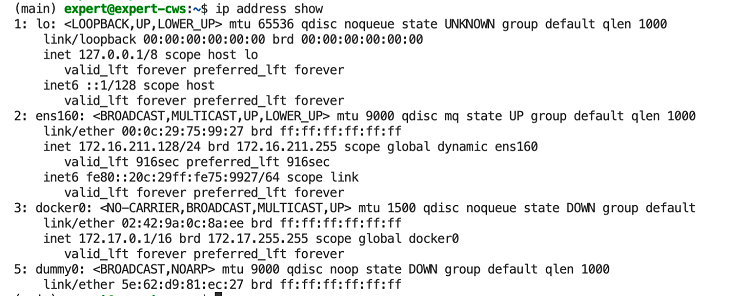
(main) expert@expert-cws:~$ ip address show

1: lo: <LOOPBACK,UP,LOWER_UP> mtu 65536 qdisc noqueue state UNKNOWN group default qlen 1000

    link/loopback 00:00:00:00:00:00 brd 00:00:00:00:00:00

    inet 127.0.0.1/8 scope host lo

       valid_lft forever preferred_lft forever

    inet6 ::1/128 scope host 

       valid_lft forever preferred_lft forever

2: ens160: <BROADCAST,MULTICAST,UP,LOWER_UP> mtu 1500 qdisc mq state UP group default qlen 1000

    link/ether 00:0c:29:75:99:27 brd ff:ff:ff:ff:ff:ff

    inet 172.16.211.128/24 brd 172.16.211.255 scope global dynamic ens160

       valid_lft 1344sec preferred_lft 1344sec

    inet6 fe80::20c:29ff:fe75:9927/64 scope link 

       valid_lft forever preferred_lft forever

3: docker0: <NO-CARRIER,BROADCAST,MULTICAST,UP> mtu 1500 qdisc noqueue state DOWN group default 

    link/ether 02:42:9a:0c:8a:ee brd ff:ff:ff:ff:ff:ff

    inet 172.17.0.1/16 brd 172.17.255.255 scope global docker0

       valid_lft forever preferred_lft forever

Running “ip address show” will display the address configuration for all interfaces on the Linux workstation. My workstation has 3 interfaces configured, a loopback address, the ethernet interface, and docker interface. Some of the Linux hosts I work on have dozens of interfaces, particularly if the host happens to be running lots of Docker containers as each container generates network interfaces. I plan to dive into Docker networking in future blog posts, so we’ll leave the “docker0” interface alone for now.

We can focus our exploration by providing a specific network device name as part of our command.

(main) expert@expert-cws:~$ ip add show dev ens160

2: ens160: <BROADCAST,MULTICAST,UP,LOWER_UP> mtu 1500 qdisc mq state UP group default qlen 1000

    link/ether 00:0c:29:75:99:27 brd ff:ff:ff:ff:ff:ff

    inet 172.16.211.128/24 brd 172.16.211.255 scope global dynamic ens160

       valid_lft 1740sec preferred_lft 1740sec

    inet6 fe80::20c:29ff:fe75:9927/64 scope link 

       valid_lft forever preferred_lft forever

Okay, that’s really what I was interested in looking at when I wanted to know what my IP address was. But there is a lot more info in that output than just the IP address. For a long time, I just skimmed over the output. I would ignore most output and simply look at the address and for state info like “UP” or “DOWN.” Eventually, I wanted to know what all that output meant, so in case you’re interested in how to decode the output above…

  • Physical interface details
    • “ens160” – The name of the interface from the operating system’s perspective.  This depends a lot on the specific distribution of Linux you are running, whether it is a virtual or physical machine, and the type of interface.  If you’re more used to seeing “eth0” interface names (like I was) it is time to become comfortable with the new interface naming scheme.
    • “<BROADCAST,MULTICAST,UP,LOWER_UP>” – Between the angle brackets are a series of flags that provide details about the interface state.  This shows that my interface is both broadcast and multicast capable and that the interface is enabled (UP) and that the physical layer is connected (LOWER_UP)
    • “mtu 1500” – The maximum transmission unit (MTU) for the interface.  This interface is configured for the default 1500 bytes
    • “qdisc mq” – This indicates the queueing approach being used by the interface.  Things to look for here are values of “noqueue” (send immediately) or “noop” (drop all). There are several other options for queuing a system might be running.
    • “state UP”- Another indication of the operational state of an interface.  “UP” and “DOWN” are pretty clear, but you might also see “UNKNOWN” like in the loopback interface above.  “UNKNOWN” indicates that the interface is up and operational, but nothing is connected.  Which is pretty valid for a loopback address.
    • “group default” – Interfaces can be grouped together on Linux to allow common attributes or commands.  Having all interfaces connected to “group default” is the most common setup, but there are some handy things you can do if you group interfaces together.  For example, imagine a VM host system with 2 interfaces for management and 8 for data traffic.  You could group them into “mgmt” and “data” groups and then control all interfaces of a type together.
    • “qlen 1000” – The interface has a 1000 packet queue.  The 1001st packet would be dropped.
  • “link/ether” – The layer 2 address (MAC address) of the interface
  • “inet” – The IPv4 interface configuration
    • “scope global” – This address is globally reachable. Other options include link and host
    • “dynamic” – This IP address was assigned by DHCP.  The lease length is listed in the next line under “valid_lft”
    • “ens160” – A reference back to the interface this IP address is associated with
  • “inet6” – The IPv6 interface configuration.  Only the link local address is configured on the host.  This shows that while IPv6 is enabled, the network doesn’t look to have it configured more widely

Network engineers link the world together one device at a time. Exploring the “ip link” command.

Now that we’ve gotten our feet wet, let’s circle back to the “link” object. The output of “ip address show” command gave a bit of a hint at what “link” is referring to. “Links” are the network devices configured on a host, and the “ip link” command provides engineers options for exploring and managing these devices.

What networking interfaces are configured on my host?

(main) expert@expert-cws:~$ ip link show

1: lo: <LOOPBACK,UP,LOWER_UP> mtu 65536 qdisc noqueue state UNKNOWN mode DEFAULT group default qlen 1000

    link/loopback 00:00:00:00:00:00 brd 00:00:00:00:00:00

2: ens160: <BROADCAST,MULTICAST,UP,LOWER_UP> mtu 1500 qdisc mq state UP mode DEFAULT group default qlen 1000

    link/ether 00:0c:29:75:99:27 brd ff:ff:ff:ff:ff:ff

3: docker0: <NO-CARRIER,BROADCAST,MULTICAST,UP> mtu 1500 qdisc noqueue state DOWN mode DEFAULT group default 

    link/ether 02:42:9a:0c:8a:ee brd ff:ff:ff:ff:ff:ff

After exploring the output of “ip address show,” it shouldn’t come as a surprise that there are 3 network interfaces/devices configured on my host.  And a quick look will show the output from this command is all included in the output for “ip address show.”  For this reason, I almost always just use “ip address show” when looking to explore the network state of a host.

However, the “ip link” object is quite useful when you are looking to configure new interfaces on a host or change the configuration on an existing interface. For example, “ip link set” can change the MTU on an interface.

root@expert-cws:~# ip link set ens160 mtu 9000

root@expert-cws:~# ip link show dev ens160

2: ens160: <BROADCAST,MULTICAST,UP,LOWER_UP> mtu 9000 qdisc mq state UP mode DEFAULT group default qlen 1000

    link/ether 00:0c:29:75:99:27 brd ff:ff:ff:ff:ff:ff

Note 1: Changing network configuration settings requires administrative or “root” privileges.

Note 2: The changes made using the “set” command on an object are typically NOT maintained across system or service restarts. This is the equivalent of changing the “running-configuration” of a network device. In order to change the “startup-configuration” you need to edit the network configuration files for the Linux host.  Check the details for network configuration for your distribution of Linux (ie Ubuntu, RedHat, Debian, Raspbian, etc.)

Is anyone else out there? Exploring the “ip neigh” command

Networks are most useful when other devices are connected and reachable through the network. The “ip neigh” command gives engineers a view at the other hosts connected to the same network. Specifically, it offers a look at, and control of, the ARP table for the host.

Do I have an ARP entry for the host that I’m having trouble connecting to?

A common problem network engineers are called on to support is when one host can’t talk to another host.  If I had a nickel for every help desk ticket I’ve worked on like this one, I’d have an awful lot of nickels. Suppose my attempts to ping a host on my same local network with IP address 172.16.211.30 are failing. The first step I might take would be to see if I’ve been able to learn an ARP entry for this host.

(main) expert@expert-cws:~$ ping 172.16.211.30

PING 172.16.211.30 (172.16.211.30) 56(84) bytes of data.

^C

--- 172.16.211.30 ping statistics ---

3 packets transmitted, 0 received, 100% packet loss, time 2039ms

(main) expert@expert-cws:~$ ip neigh show

172.16.211.30 dev ens160  FAILED

172.16.211.254 dev ens160 lladdr 00:50:56:f0:11:04 STALE

172.16.211.2 dev ens160 lladdr 00:50:56:e1:f7:8a STALE

172.16.211.1 dev ens160 lladdr 8a:66:5a:b5:3f:65 REACHABLE

And the answer is no. The attempt to ARP for 172.16.211.30 “FAILED.”  However, I can see that ARP in general is working on my network, as I have other “REACHABLE” addresses in the table.

Another common use of the “ip neigh” command involves clearing out an ARP entry after changing the IP address configuration of another host (or hosts). For example, if you replace the router on a network, a host won’t be able to communicate with it until the old ARP entry ages out and the system tries ARPing again for a new address. Depending on the operating system, this can take minutes — which can feel like years when waiting for a system to start responding again. The “ip neigh flush” command can clear an entry from the table immediately.

How do I get from here to there? Exploring the “ip route” command

Most of the traffic from a host is destined somewhere on another layer 3 network, and the host needs to know how to “route” that traffic correctly. After looking at the IP address(es) configured on a host, I will often take a look at the routing table to see if it looks like I’d expect. For that, the “ip route” command is the first place I look.

What routes does this host have configured?

(main) expert@expert-cws:~$ ip route show

default via 172.16.211.2 dev ens160 proto dhcp src 172.16.211.128 metric 100 

10.233.44.0/23 via 172.16.211.130 dev ens160 

172.16.211.0/24 dev ens160 proto kernel scope link src 172.16.211.128 

172.17.0.0/16 dev docker0 proto kernel scope link src 172.17.0.1 linkdown 

It may not look exactly like the output of “show ip route” on a router, but this command provides very usable output.

◉ My default gateway is 172.16.211.2 through the “ens160” device.  This route was learned from DHCP and will use the IP address configured on my “ens160” interface.

◉ There is a static route configured to network 10.233.44.0/23 through address 172.16.211.130

◉ And there are 2 routes that were added by the kernel for the local network of the two configured IP addresses on the interfaces.  But the “docker0” route shows “linkdown” — matching the state of the “docker0” interface we saw earlier.

The “ip route” command can also be used to add or delete routes from the table, but with the same notes as when we used “ip link” to change the MTU of an interface. You’ll need admin rights to run the command, and any changes made will not be maintained after a restart. But this can still be very handy when troubleshooting or working in the lab.

And done… or am I?

So that’s is my “brief” look at the “ip” command for Linux. Oh wait, that bad pun attempt reminded me of one more tip I meant to include. There is a “–brief” option you can add to any of the commands that reformats the data in a nice table that is often quite handy. Here are a few examples.

(main) expert@expert-cws:~$ ip --brief address show

lo               UNKNOWN        127.0.0.1/8 ::1/128 

ens160           UP             172.16.211.128/24 fe80::20c:29ff:fe75:9927/64 

docker0          DOWN           172.17.0.1/16 

(main) expert@expert-cws:~$ ip --brief link show

lo               UNKNOWN        00:00:00:00:00:00 <LOOPBACK,UP,LOWER_UP> 

ens160           UP             00:0c:29:75:99:27 <BROADCAST,MULTICAST,UP,LOWER_UP> 

docker0          DOWN           02:42:9a:0c:8a:ee <NO-CARRIER,BROADCAST,MULTICAST,UP> 

Not all commands have a “brief” output version, but several do, and they are worth checking out.

There is quite a bit more I could go into on how you can use the “ip” command as part of your Linux network administration skillset. (Checkout the “–json” flag for another great option). But at 3,000+ words on this post, I’m going to call it done for today. If you’re interested in a deeper look at Linux networking skills like this, let me know, and I’ll come back for some follow-ups. 

Source: cisco.com