Tuesday, 30 April 2019

TLS Fingerprinting in the Real World

To protect your data, you must understand the traffic on your network.  This task has become even more challenging with widespread use of the Transport Layer Security (TLS) protocol, which inhibits traditional network security monitoring techniques.  The good news is that TLS fingerprinting can help you understand your traffic without interfering with any of the security benefits TLS brings to applications and complements current solutions like Encrypted Traffic Analytics.   To help our customers better understand the benefits of the approach, and to help drive the development and adoption of defensive uses of traffic analysis, the Advanced Security Research team of Cisco’s Security and Trust Organization has published a large set of fingerprints with the support of the Cisco Technology Fund.

Cisco Tutorials and Materials, Cisco Learning, Cisco Certifications, Cisco Guides

Transport Layer Security (TLS) fingerprinting is a technique that associates an application and/or TLS library with parameters extracted from a TLS ClientHello by using a database of curated fingerprints, and it can be used to identify malware and vulnerable applications and for general network visibility. These techniques gained attention in 2009 with mod_sslhaf, in 2012 with SSL fingerprinting for p0f, in 2015 with FingerprinTLS, and most recently with JA3.  We have been using this approach at Cisco since 2016.  The attention given to TLS fingerprinting has been warranted because it is a proven method that provides network administrators with valuable intelligence to protect their networks. And while more of the TLS handshake goes dark with TLS 1.3, client fingerprinting still provides a reliable way to identify the TLS client. In fact, TLS 1.3 has increased the parameter space of TLS fingerprinting due to the added data features in the ClientHello. While there are currently only five cipher suites defined for TLS 1.3, most TLS clients released in the foreseeable future will be backwards compatible with TLS 1.2 and will therefore offer many “legacy” cipher suites. In addition to the five TLS 1.3-specific cipher suites, there are several new extensions, such as supported versions, that allows us to differentiate between clients that supported earlier draft implementations of TLS 1.3.

Why is our approach different?


But here’s the catch: the visibility gained by TLS fingerprinting is only as good as the underlying fingerprint database, and until now, generating this database was a manual process that was slow to update and was not reflective of real-world TLS usage. Building on work we first publicly released in January 2016, we solved this problem by creating a continuous process that fuses network telemetry with endpoint telemetry to build fingerprint databases automatically. This allows us to leverage data from managed endpoints to generate TLS fingerprints that give us visibility into the (much larger) set of unmanaged endpoints and do so in a way that can quickly incorporate information about newly released applications. By automatically fusing process and OS data gathered by Cisco® AnyConnect® Network Visibility Module (NVM) with network data gathered by Joy, our system generates fingerprint databases that are representative of how a diverse set of real-world applications and operating systems use network protocols such as TLS. We also apply this process to data generated from Cisco Threat Grid, an automated malware analysis sandbox, to ensure that our system captures the most recent trends in malware. With ground truth from multiple sources like real-world networks and malware sandboxes, we can more easily differentiate fingerprints that are uniquely associated with malware versus fingerprints that need additional context for a confident conviction.

Our internal database has process and operating system attribution information for more than 4,000 TLS fingerprints (and counting) obtained from real-world networks (NVM) and a malware analysis sandbox (Threat Grid). The database also has observational information such as counts, destinations, and dates observed for more than 12,000 TLS fingerprints from a set of enterprise networks. We have open sourced a subset of this database that, at more than 1,900 fingerprints (and counting), is the largest and most informative fingerprint database released to the open-source community.   This database contains information about benign processes only; we are not able to publish fingerprints for malware at this time.

Cisco Tutorials and Materials, Cisco Learning, Cisco Certifications, Cisco Guides

Given the records generated from the data fusion process, we report all processes and operating systems that use a TLS fingerprint, providing a count of the number of times we observed each process or operating system using the TLS fingerprint in real-world network traffic. This schema gives a more realistic picture of TLS fingerprint usage (in other words, many processes can map to a single fingerprint with some more likely than others).

Another advantage of our database is that it provides as much relevant contextual data per fingerprint as possible. The primary key into our database is a string that describes the TLS parameters that you would observe on the wire, which allows a system generating these keys to provide valuable information even in the case of no database matches. We associate each TLS parameter in the ClientHello with the RFC that first defined that parameter and use this information to report maximum and minimum implementation dates. These dates provide useful context on the age of the cryptographic parameters in the ClientHello and are not dependent on a database match.

Monday, 29 April 2019

Keys to a Successful Automation Project

We just finished working with the analyst firm Analysys Mason on a white paper exploring the factors behind successful automation projects. They talked to a number of tier 1 operators to capture lessons learned from the rollouts of their respective automation projects.  The white paper is more focused on process than technology and I think it’s a worthwhile read for anyone embarking on any automation project.

Automation projects tend to inspire an equal mix of excitement and fear and folks often come to us for advice on what to do.  Unfortunately, there is no one right answer to this; however, as the white paper establishes, there are a few guiding principles to keep in mind:

◈ Automation is not a “Big Bang” endeavor.  Successful companies view their automation initiatives as a series of discrete steps.  Like a staircase, each step builds upon the ones before it to increase scope and capabilties of the whole over time.

◈ Each step should have its own payoff, be it cost savings, increased efficiency or something else.  Having a backloaded payoff after several years of effort is seldom a great idea for a few reasons: 1) at some point, your leadership is going to wonder why they are spending money on a project with no apparent payoff, 2) your team will get tired of the churn, also with no apparent payoff, and 3) the needs of the organization will inevitably evolve and change and your initial plan will likely be dated in under a year. Instead, view your overall automation objective as a series of individual steps and make sure each step has tangible, measurable outcomes.  At the completion of each step, use what you learned along the way to re-asses the whole project.  By doing this, you gain credibility by showing the project is doing what you said it would do, your leadership is happy that they are seeing a return on their spend, your teams’ lives are getting better in measurable ways and they feel like their value to the company in growing, and you can be sure you are never too far out of sync with the business strategy.

◈ Of the three components of the infamous people, process, technology triangle,  “technology” is probably the most straightforward. A successful project is also going to entail investing in your teams’ skills. It’s critical to remember this is a non-compressible process: while you can install new tools in a matter of hours, your team can only absorb and operationalize new technologies at a given rate and you need to take that into account in your plans. In addition, you need processes that can be automated: spaghetti logic, gappy processes and disparate ways of doing the same task are all going to create friction in your quest to automate.  The good news is that an automation initiative is an excellent excuse to clean these all up as they are currently hurting your business whether you automate or not.  Again, allow time to do this: if you get three engineers in a room, you will have four opinions on how a task should be accomplished.

◈ Recognize that there is no one true path to automation.  Look at the image below. Some folks will follow the green line and focus on automating technical domains (i.e. data center networking, firewall policy) and then eventually stitch them all together.  Others will focus on automating specific business processes (i.e. auto-scaling video delivery, new employee on-boarding) and plan to eventually cover all the company’s activities.  Both approaches offer immediate benefits and both have longer-term implications.  Neither is right nor wrong, it’s simply which a matter of which approach best matches the needs of the company at the time.

Finally, and perhaps most importantly, it’s OK to try things and it’s OK if every step is not a complete success—it’s how you are going to learn. Internalize this but also set the expectation with your team and your leadership. Learn things and adapt. Expect to change tack–while the green and blue lines are nice and neat and look good on slides, reality more likely looks like the grey line going down the middle!

Cisco Tutorials and Materials, Cisco Guides, Cisco Learning, Cisco Certifications

Saturday, 27 April 2019

How to Find Relief for Your Network Infrastructure in the Age of Apps

If you’re like most IT people, never does a day go by that you’re not working on multiple tasks at once: ensuring on prem data centers and public cloud networks are running smoothly; monitoring the consistency of network security policies; and making sure all of it meets compliance demands. And that doesn’t even begin to address the enormous pressure applications have begun to put on the underlying network infrastructure. As a result, data centers are no longer a fixed entity, but rather a mesh of intelligent infrastructure that spans multiple clouds and geographies. With new applications constantly being added to an infrastructure, roadblocks are beginning to arise, making the role of IT teams more complicated than ever.

Dynamic Network Alignment with IT and Business Policies


The network industry has recognized its unique set of challenges and is addressing them in the form of an intent-based networking architectural approach that builds on software-defined networking to allow continuous, dynamic network alignment with IT and business policies. This means that application, security, and compliance policies can be defined once then enforced and monitored between any groups of users or things and any application or service – or even between application services themselves – wherever they are located.

Forward-looking companies are now using applications not just as a way to engage with customers but also as a means for employees and the organizations themselves to communicate and work together efficiently. To create a more streamlined infrastructure, Cisco has integrated Application Centric Infrastructure (ACI) with the application layer and the enterprise campus to help large and medium-sized organizations that need to adopt a holistic network infrastructure strategy. Designed to help businesses cope with the unique performance, security, and management challenges of highly distributed applications, data, users, and devices, Cisco ACI also addresses the issue of legacy approaches. Having relied on manual processes to secure data and applications and control access, these approaches are no longer adequate or sustainable, and therefore need to be modernized.

With the ACI and AppDynamics (AppD) integration, application performance correlates with network health, while the Cisco DNA Center and the Identity Services Engine (ISE) work together to deliver end-to-end identity-based policy and access control between users or devices on campus and applications or data anywhere.

Richer Diagnostic Capabilities for Healthier Networks and Apps


Simplifying the deployments and management of applications requires more than just providing and managing the infrastructure that supports them. Cicso’s AppD provides IT teams with the application-layer visibility and monitoring required in an intent-based architecture to validate that IT and business policies are being met across the network. The Cisco ACI and AppDynamics solution also offers high-quality app performance monitoring, richer diagnostic capability for app and network performance, and faster root-cause analysis of problems, with immediate triage sent to the right people quickly.

Cisco Tutorials and Material, Cisco Guides, Cisco Learning, Cisco Study Materials

That said, failures in applications can happen for a variety of reasons, often leading to what’s commonly known as “the blame game,” with people asking questions like, “Is it the network failure or the application failure? Who is responsible – the network team or the apps team?” Manual methods are slow, cumbersome and oftentimes simply impossible to detect failures in an assertive fashion. The ACI and AppD integration offers deep visibility into the application processes andenables faster root cause analysis bytaking the ambiguity out and pinpointing the problem – saving time, money, and, most importantly, getting the application back up and running right away.

Network Segmentation is a Must


Hyper-distributed applications and highly mobile users, increased cyber-security threats, and even more regulatory requirements make network segmentation a must for reducing risk and better compliance. Cisco ACI and Cisco DNA Center/ISE policy integration allows the marrying of Cisco ACI’s application-based microsegmentation in the data center, with Cisco SD Access user-group based segmentation across the campus and branch. This integration automates the mapping and enforcement of segmentation policy based on the user’s security profile as they access resources within the data center, enabling security administrators to manage end-to-end, user-to-application segmentation seamlessly. A common and consistent identity-based microsegmentation capability is then provided from the user to the application.

Cisco Tutorials and Material, Cisco Guides, Cisco Learning, Cisco Study Materials

Experience ACI Integrations for Yourself


To practice using Cisco ACI, we’ve put together two-minute walkthroughs to help you experience the impact of the integrations and see first-hand how they can make an IT team’s life easier.


Watch how Cisco Cloud ACI helps policy-driven connectivity between on-premises data centers and AWS and Azure public clouds. The aim is to simplify routing and to ensure consistency of network security policies, ultimately helping to meet compliance demands.


Learn how to correlate application health and network constructs for optimal app performance, deeper monitoring, and faster root cause analysis with Cisco ACI and AppDynamics integration.


See how Cisco ACI and Cisco DNA Center/ISE policy integration allows the marrying of ACI’s application-based micro-segmentation in the data center with Cisco SD-Access and user group-based segmentation across the campus and branch.

Source: Cisco.com

Friday, 26 April 2019

The New Network as a Sensor

Before we get into this, we need to talk about what the network as a sensor was before it was new. Conceptually, instead of having to install a bunch of sensors to generate telemetry, the network itself (routers, switches, wireless devices, etc.) would deliver the necessary and sufficient telemetry to describe the changes occurring on the network to a collector and then Stealthwatch would make sense of it.

The nice thing about the network as a sensor is that the network itself is the most pervasive. So, in terms of an observable domain and the changes within that domain, it is a complete map. This was incredibly powerful. If we go back to when NetFlow was announced, let’s say a later version like V9 or IPfix, we had a very rich set of telemetry coming from the routers and switches that described all the network activity. Who’s talking to whom, for how long, all the things that we needed to detect insider threats and global threats. The interesting thing about this telemetry model is that threat actors can’t hide in it. They need to generate this stuff or it’s not actually going to traverse the network. It’s a source of telemetry that’s true for both the defender and the adversary.

The Changing Network


Networks are changing. The data centers we built in the 90’s and 2000’s and the enterprise networking we did back then is different from what we’re seeing today. Certainly, there is a continuum here by which you as the customer happen to fall into. You may have fully embraced the cloud, held fast to legacy systems, or still have a foot in both to some degree. When we look at this continuum we see the origins back when compute was very physical – so called bare metal, imaging from optical drives was the norm, and rack units were a very real unit of measure within your datacenter. We then saw a lot of hypervisors when the age of VMware and KVM came into being. The network topology changed because the guest to guest traffic didn’t really touch any optical or copper wire but essentially traversed what was memory inside that host to cross the hypervisor. So, Stealthwatch had to adapt and make sure something was there to observe behavior and generate telemetry.

Moving closer to the present we had things like cloud native services, where people could just get their guest virtual machines from their private hypervisors and run them on the service providers networked infrastructure. This was the birth of the public cloud and where the concept of infrastructure as a service (IaaS) began. This was also how a lot of people, including Cisco Services and many of the services you use today, are run to this day. Recently, we’ve seen the rise of Docker containers, which in turn gave rise to the orchestration of Kubernetes. Now, a lot of people have systems running in Kubernetes with containers that run at incredible scale that can adapt to the changing workload demand. Finally, we have serverless. When you think of the network as a sensor, you have to think of the network in these contexts and how it can actually generate telemetry. Stealthwatch is always there to make sense of that telemetry and deliver the analytic outcome of discovering insider threats and global threats. Think of Stealthwatch as the general ledger of all of the activity that takes place across your digital business.

Now that we’ve looked at how networks have evolved, we’re going to slice the new network as a sensor into three different stories. In this blog, we’ll look at two of these three transformative trends that are in everyone’s life to some degree. Typically, when we talk about innovation, we’re talking about threat actors and the kinds of threats we face. When threats evolve, defenders are forced to innovate to counter. Here however, I’m talking about transformative changes that are important to your digital business in varying ways. We’re going to take them one by one and explain what they are and how they change what the network is and how it can be a sensor to you.

Cloud Native Architecture


Now we’re seeing the dawn of serverless via things like AWS: Lambda. For those that aren’t familiar, think of serverless as something like Uber for code. You don’t want to own a car or learn how to drive but just want to get to your destination. The same concept applies to serverless. You just want your code to run and you want the output. Everything else, the machine, the supporting applications, and everything that runs your code is owned and operated by the service provider. In this particular situation, things change a lot. In this instance, you don’t own the network or the machines. Serverless computing is a cloud computing execution model in which cloud solution providers dynamically manage the allocation of machine resources (i.e. the servers).

So how do you secure a server when there’s no server?

Stealthwatch Cloud does it by dynamically modeling the server (that does not exist) and holds that state overtime as it analyzes changes being described by the cloud-native telemetry.  We take in a lot of metadata and we build a model for in this case a server and overtime s everything changes around this model, we’re holding state as if there really was a server. We perform the same type of analytics trying to detect potential anomalies that would be of interest to you.

Cisco Tutorials and Materials, Cisco Learning, Cisco Guides, Cisco Certifications

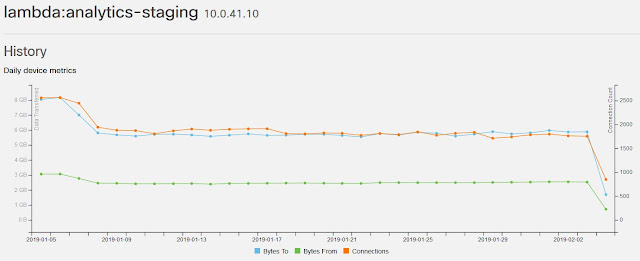
In this image you can see that the modeled device has, in a 24-hour period, changed IP address and even its virtual interfaces whereby IP addresses can be assigned. Stealthwatch Cloud creates a model of a server to solve the serverless problem and treats it like any other endpoint on your digital business that you manage.

Cisco Tutorials and Materials, Cisco Learning, Cisco Guides, Cisco Certifications

This “entity modeling” that Stealthwatch Cloud performs is critical to the analytics of the future because even in this chart, you would think you are just managing that bare metal or virtual server over long periods of time. But believe it or not, these traffic trends represent a server that was never really there! Entity modeling allows us to perform threat analytics within cloud native serverless environments like these. Entity modeling is one of the fundamental technologies in Stealthwatch and you can find out more about it here.

We’re not looking at blacklists of things like IP addresses of threat actors or fully qualified domain names. There’s not a list of bad things, but rather telling you an event of interest that has not yet made its way to a list. It catches things that you did not know to even put on a list – things in potential gray areas that really should be brought to your attention.

Software Defined Networks: Underlay & Overlay Networks


When we look at overlay networks we’re really talking about software defined networks and the encapsulation that happens on top of them. The oldest of which I think would be Multiprotocol Label Switching (MPLS) but today you have techniques like VXLAN and TrustSec. The appeal is that instead of having to renumber your network to represent your segmentation, you use encapsulation to express the desired segmentation policy of the business.  The overlay network uses encapsulation to define policy that’s not based on destination-based routing but labels. When we look at something like SDWAN, you basically see what in traditional network architectural models changing.  You still have the access-layer or edge for your network but everything else in the middle is now a programmable mesh whereby you can just concentrate on your access policy and not the complexity of the underlay’s IP addressing scheme.

For businesses that have fully embraced software defined networking or any type, the underlay is a lie!  The underlay is still an observational domain for change and the telemetry is still valid, but it does not represent what is going on with the overlay network and for this there is either a way to access the native telemetry of the overlay or you will need sensors that can generate telemetry that include the overlay labeling.

Enterprise networking becomes about as easy to setup as a home network which is an incredibly exciting prospect. Whether your edge is a regular branch office, a hypervisor on a private cloud, an IAS in a public cloud, etc. as it enters the world or the rest of the Internet it crosses an overlay network that describes where things should go and provisions the necessary virtual circuits. When we look at how this relates to Stealthwatch there are a few key things to consider. Stealthwatch is getting the underlay information from NetFlow or IPfix. If it has virtual sensors that are sitting on hypervisors or things of that nature, it can interpret the overlay labels (or tags) faithfully representing the overlay.  Lastly, Stealthwatch is looking to interface with the actual software define networking (SDN) controller so it can then make sense of the overlay. The job of Stealthwatch is to put together the entire story of who is talking to whom and for how long by taking into account not just the underlay but also the overlay.

Thursday, 25 April 2019

A Required Cloud Native Security Mindset Shift

There has been a significant shift in the public cloud infrastructure offerings landscape in the last 3-5 years. With that shift we as Information Security practitioners must also fundamentally shift our tactics and view of how these new services can be leveraged as a whole new landscape of possible vectors to be exploited into today’s public cloud infrastructure.

As a Pre-Sales Security Engineer, I talk to many customers on a daily basis that have gone all-in with their public cloud strategy and many that are hybrid with what they view as legacy on-premise workloads and those that are still relatively new to public cloud, and as such, only have lab and test workloads that they are looking to protect.

Regardless of whether an organization is cloud native from the ground up or somewhere along the path to transitioning to the public cloud, they must all recognize that the infrastructure landscape has changed drastically from what an on-premise datacenter traditionally looked like. That change includes security. Even public cloud capabilities themselves have changed drastically from server to serverless and containerized microservices from just a few short years ago.

In today’s public cloud landscape across all major providers, InfoSec teams must realize that their cloud assets that require protection stretch far beyond those of traditional virtual machines being hosted by their respective cloud provider. The introduction of point-in-time on-demand compute, serverless databases, machine learning services, public-facing storage buckets, and elastic containerized environments like Kubernetes has introduced a plethora of new attack surfaces that, if not secured properly, could potentially all be leveraged as a vector into a customer’s cloud environment.

Cisco Tutorials and Materials, Cisco Learning, Cisco Certifications, Cisco Security

Combine the sprawl of serverless capabilities that are being offered by public cloud providers with the development culture shift to DevOps and the rise in Shadow IT, and the risk to an organization is very apparent. Their concern should not only be the cloud workloads they know about, but also the ones they are completely blind to.

The traditional mindset of attackers gaining entry into a network via a public-facing application vulnerability or perimeter firewall gap must shift knowing the many services and entry points into an organization’s public cloud network. Now InfoSec teams must focus their attention on non-traditional attack vectors like compromised API access keys, weakly-permissioned file storage buckets, an expanding credentialed access surface area, or one of dozens of public cloud unique services that can easily be exposed to the Internet with no firewall or ACL to protect them from adversaries. A Kubernetes cluster in the public cloud can easily grow from a possibly vulnerable surface area of a few nodes with a few pods each to a massive cluster with hundreds or thousands of internet-facing pods in a matter of minutes.

Organizations must have visibility into the underlying infrastructure if they want to have a chance at trying to protect this rapidly-expanding public cloud landscape. You can’t rely on agents or manual human oversight to ensure workloads and assets are accounted for and secured. The surface area of virtual machine sprawl, serverless compute applications, and DevOps/Shadow IT dictates that organizations have no choice but to leverage the public cloud’s underlying network infrastructure as a catch-all security sensor grid. If an organization can ensure that they can see everything and eliminate all possible blind spots despite the stated landscape, then they can see, secure and monitor everything that’s in their cloud environment.

Cisco Tutorials and Materials, Cisco Learning, Cisco Certifications, Cisco Security

But how? This is where Cisco Stealthwatch Cloud plays an integral and necessary role in providing an organization this essential catch-all visibility layer. The solution leverages agentless API integrations and cloud-native network flow log ingestion to provide a complete record of every transaction that occurs within any public cloud environment or service, be-it server, serverless, or containerized. Stealthwatch Cloud generates a deep forensic history of every cloud entity known or unknown, learns known good behavior on each and then alerts on hundreds of indicators of compromise or policy violation that can put an organization at risk of breach.

Wednesday, 24 April 2019

Connected Car – What is Your Vehicle Reporting?

Cisco Tutorial and Material, Cisco Certifications, Cisco Learning, Cisco Study Materials, Cisco All Certifications

We looked at In-Vehicle Infotainment, focusing on streamed media and navigation services. In this blog, we’ll look at Connected vehicle services and telemetry. What is this and what data volume does it represent?

Vehicle services


Some vehicle manufacturers such as Jaguar, provide additional information services to the vehicle owner/user. For example, the InControl service includes the ability to report completed journeys. This function provides the customer with information about their journeys including the journey distance, real-time location, the duration of the journey, the average speed and data about the efficiency of the journey.

The information required to offer this function is derived from existing vehicle telemetry that is collected by the vehicle manufacturer. Such information forms a small part of the overall vehicle telemetry that is sent over a cellular connection to the vehicle manufacturer.

A growing number of manufacturers offer ‘remote-control functions’ using a cellular connection, enabling users to perform such functions as enable the heating/air-conditioning, lock or unlock the vehicle, sound the horn, flash the headlamps, check the fuel level or battery charge and effective range, check current location etc. More advanced functions include ‘summoning’ the vehicle, however, these services require a relatively small data exchange between the vehicle and the vehicle manufacturer’s data-center.

Some vehicle manufacturers such as Tesla are using software and firmware update over-the-air. In some cases, these updates are delivered via a cellular connection. In others, WiFi can be used as an alternative delivery method. Anecdotal reports from various driver forums suggest that for Tesla vehicles, the full version updates take place roughly every 6 months, with the version 9.0 update required a download of approximately 1GB. Periodic firmware updates also occur but these are unannounced and are much smaller in size (100-150MB). Over-the-air updates are of significant value to vehicle manufacturers in addressing potential defects or in delivering new capabilities to a vehicle, post-sale. Discussions with a small sample of vehicle manufacturers have identified that some are currently reluctant to use over-the-air updates for anything other than updates to non-safety related software such as infotainment services due to concerns about managing the associated risk.

What is your vehicle reporting?


Vehicle manufacturers are increasingly building their vehicles to be ‘connected’. While some manufacturers gather such information for a limited period of time (typically covering the warranty period) others gather information throughout the lifetime of the vehicle.

BMW collects information including vehicle status information (e.g. mileage, battery voltage, door and hatch status, etc.), position and movement data (e.g. time, position, speed, etc.), vehicle service data (e.g. due date of next service visit, oil level, brake wear, etc.), dynamic traffic information (e.g. traffic jams, obstacles, signs, parking spaces, etc.), environmental information (e.g. temperature, rain, etc.), user profile (personal profile picture/ avatar, settings as navigation, media, communication, driver’s position, climate/light, driver assistance, etc.) and sensor information (e.g. radar, ultrasonic devices, gestures, voice, etc.).

In cases such as a detected fault condition, the information including Diagnostic Trouble Codes (DTC) will be recorded to local storage within the vehicle. This can subsequently be used by service engineers to determine the fault condition that was encountered. Some vehicles will send a summary fault report to the vehicle manufacturer, as well. As more sensors are added to vehicles, not only will vehicle manufacturers gather information about the performance and operation of the vehicle itself but may also gather data generated from the sensors themselves­2. This does not mean that such data is gathered continuously. Vehicle systems may transmit a form of the sensor data in cases of ‘interest’ such as an accident or an unexpected set of telemetry data being recorded. Such information is of interest to not only the vehicle makers but potentially to organisations such as insurance companies.

As one can see from the information collection details, the manufacturers are collecting far more information than just fault conditions. The position and movement information can include details such as braking and acceleration styles. Traction-control indications can help determine road conditions at a location. Some vehicle makers and mapping service providers are starting to use such information to identify roadway hazards such as potholes.

Such services are designed of course, on the premise of having cellular connectivity coverage. However, very few countries are able to provide ubiquitous coverages. A 2017 report noted that the United Kingdom had 91% coverage of national highways but a much lower 58% coverage of non-highway classed roadways. A 2017 report indicates that most major urban areas in the United States have good cellular coverage but with the large geography covered by the US highway system, there are still many locations where cellular services are patchy at best.

From a vehicle manufacturer’s perspective, one cannot rely on universal cellular coverage. As a result, applications need to be designed to operate on the premise that connectivity may or may not be available and therefore vehicle systems need to include the ability to store critical data locally, transmitting valuable information when connectivity is restored.

Data volume today

How much information is the vehicle transmitting to the vehicle manufacturer and when is it taking place? The data volume varies from manufacturer to manufacturer and will also depend on the type and model of the vehicle.

A study performed by ADAC in 2016 identified that the BMW i3 electric vehicle transmits the ‘Last State Call’ automatically every time the driver switches off the car and locks the doors (vehicle is not in motion). This call includes the content of the error memory, battery details including cell temperatures and charge level, the driving mode (eco, eco plus, sport), operational data of the range extender, the mileage at various driving operations, quality of the charging point including malfunctions and the position of the last 16 charging points used.

Key to note that in the BMW case is that some information is obtained while the vehicle is in motion, with other information being collected at the end of the journey. Information provided by OEM A (a Japanese auto-maker) indicates that their personal light vehicles generate a report of ~10-15MB per duty-cycle. This is collected on a monthly basis in an upload over a cellular LTE connection. Information from OEM B (a Japanese auto-maker) indicates a volume of 15-20MB per duty-cycle collected while the vehicle is in operation where the average ‘driven-day’ in Japan is ~90 minutes, equating to a US duty-cycle volume of ~12MB.

Cisco Tutorial and Material, Cisco Certifications, Cisco Learning, Cisco Study Materials, Cisco All Certifications

How does this compare to the typical smartphone users? According to a 2018 report, monthly mobile data traffic per smartphone in North America reached 8.6GB (286MB per day) by the end of 2018.

Cisco Tutorial and Material, Cisco Certifications, Cisco Learning, Cisco Study Materials, Cisco All Certifications

Tuesday, 23 April 2019

Security that works together: Signal Sciences and Cisco Threat Response

Bring real time web application attack data into Threat Response


Signal Sciences is a leading web application security company, with a next-gen web application firewall (WAF) and runtime application self-protection (RASP) solution. Signal Sciences protects over 10,000 applications, with over a trillion production requests per month. Signal Sciences’ patented dual module-agent architecture provides organizations working in a modern development environment with comprehensive, scalable threat protection and security visibility.

In late February 2019, the Signal Sciences team was connected by Cisco Security Business Development with the Cisco Threat Response(CTR) ecosystem group. After an initial conference call about technology and APIs, it was clear the engineers should get together to build something. Using the Swagger documentation and a little guidance on which API endpoints to use, the Signal Sciences crew were able to design, build, test, document and show a functional integration within 10 days. It was demonstrated at Cisco Live Melbourne and RSA Conference, simultaneously in the Signal Sciences and Cisco booths.

Cisco Tutorial and Material, Cisco Guides, Cisco Learning, Cisco Study Materials

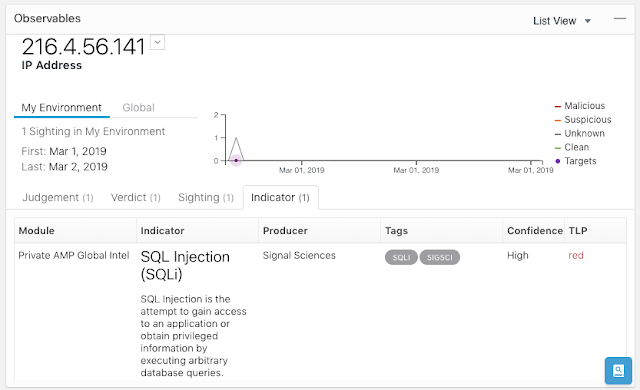
As attacks are detected and blocked, Signal Sciences next-gen (WAF sends relevant attack data to Cisco Threat Response; including IP address, indicators and additional metadata. Within Threat Response a sighting of the offending IP address is created and linked to the indicator, which can then be aggregated with all other sightings across Threat Response.

Cisco Tutorial and Material, Cisco Guides, Cisco Learning, Cisco Study Materials

An incident responder can then open a casebook on the observable and initiate a cross-functional investigation. At the same time, a workflow can be initiated within Threat Response to take any corrective actions needed. If more details are needed, the investigator can jump straight to the event in Signal Sciences from Threat Response at the click of a button.

Cisco Tutorial and Material, Cisco Guides, Cisco Learning, Cisco Study Materials

Through the integration, your Security Operations team will have immediate visibility into attacks across all web application workloads.

With the integration, you can take immediate action, including:

◈ Analyze and correlate event data using context from integrated Cisco Security products and industry leading threat intelligence from Cisco Talos

◈ Open a case to collect and store key investigative information, orchestrate resources for incident response, and manage and document your progress and findings

◈ Take corrective actions in other Cisco products to remediate and address the threats across your security stack by monitoring, filtering, and blocking known attackers

Cisco Tutorial and Material, Cisco Guides, Cisco Learning, Cisco Study Materials

Additionally, when looking at suspicious or blocked requests within Signal Sciences, the incident responder can pivot directly into Threat Response and look up any observables related to the attacker’s source IP address.

Businesses constantly innovate and find new ways to attract, engage, and transact with their customers through web and mobile applications. As a result, a dramatic shift has occurred in how applications are developed and deployed. Now more than ever, security teams need a solution that can protect modern application workloads and provide actionable insights to the professionals responsible for investigating and responding to threats. Cisco Threat Response combined with Signal Sciences next-gen WAF redefines expectations for addressing this challenge.

Monday, 22 April 2019

Trust in IOS XR

Cisco Tutorials and Materials, Cisco Guides, Cisco Certifications

I looked at the hardware Trust Anchor module (TAm) that enhances the security of Cisco Service Provider products and provides visibility into the authenticity and integrity of the platforms. In this blog I will go over the software functionalities in IOS XR that enhance the security posture of the router, defends the router against common attacks, and provides evidence of trust.

Buffer Overflow Protection


A buffer overflow attack involves a common error by developers where the input to an allocated buffer (a memory region) is not validated, and the input overflows the allocated memory. This attack can lead to execution of arbitrary code. A similar attack involves prior knowledge of where critical data is loaded into memory and then targeting that memory location.

IOS XR uses multiple runtime defenses (RTDs) to protect from such errors.

1. W^X (Write XOR Execute): This is a feature in Linux where any page of memory can either be written to or executed but not both. In the scenario where an input overflows the buffer, the overflow data exists in a memory region that can be written to but cannot be used to execute arbitrary malicious code.

2. Address Space Layout Randomization (ASLR): This is a Linux feature wherein the memory locations of running processes are randomized each time. This prevents critical data from always being loaded at the same location in memory, and makes it more difficult for an attacker to launch malicious operations on a specific, well-known memory location.

3. Object Size Checking (OSC): This is a compiler technique used to identify the size of objects, even at compile time for specific types of objects, and then detecting if the data being written will overflow the allocated memory. The compiler will flag such errors at compile time, if the errors can be detected at compile time, or it will add additional instructions to raise exceptions at run time.

4. Safe-C: Many library functions used in C are known to be quite difficult to use safely when it comes to certain memory related operations. Developers working on IOS XR use a safer and secure variant of the library functions, called the Safe-C Library. This provides an alternative to the standard C library calls, where memory accesses, particularly writes to memory locations, are first verified to be within bounds before data in memory is read from or written to. Note that not all modules in IOS XR fully utilize Safe-C libraries due to the maturity of the code base. Critical modules use Safe-C libraries and we migrate to Safe-C libraries in other modules as appropriate.

The above 4 features provide a much safer environment in which to run IOS XR software and mitigate a very common class of security problems.

Integrity Measurement Architecture (IMA)


Cisco hardware-anchored Secure Boot verifies the integrity of the image, including all firmware, to prevent inauthentic or compromised code from booting on a Cisco device. Once a router has booted up, it typically runs for months without a reboot. A malicious actor could get access to the router and tamper a binary at runtime and this would not be detected for a long time. To prevent such tampering of binaries at runtime, we are bringing Linux Integrity Measurement Architecture into IOS XR.

Linux IMA is a kernel security module which checks the integrity of every binary loaded into memory at runtime. Every binary carries a Cisco-issued signature. The Linux kernel validates this signature using Cisco’s Public IMA Certificate that is stored in the hardware-based Trust Anchor module. In the IMA measurement mode, the hashes of all binaries launched are logged into a secure location. In the IMA appraisal mode, if the signature validation fails, the binary will not be allowed to launch. Thus any accidental or malicious modification of a binary at runtime is detected and its execution prevented.  This significantly enhances security and allows the integrity the running software to be verified.

Remote Attestation

We have built a significant number of security controls into our Service Provider product and one of the important aspect of building trust in a product is the ability to verify that the router is in fact doing what it claims to be doing. If an attacker were to tamper the system, the very first action by the attacker will be to remove all evidence of the attack and to present the router as untampered. The only means of verifying the integrity of the router cannot be the router itself.

Remote Attestation will allow the operator to cryptographically verify that the router’s boot keys, boot configuration and all launched software have not been tampered. Cisco’s Trust Anchor supports Remote Attestation functionality where every aspect of the boot up process – starting from the verification of the root of trust and extending throughout the entire secure boot process – as well as the runtime IMA measurements are extended into Platform Configuration Registers (PCRs) in the Trust Anchor. Cisco’s software release process will provide Known Good Value (KGV) hashes for every software, firmware, and key material data shipped with the router.

Once the router is up and running, a verifying party will be able to request an attestation quote from the router. The Trust Anchor hardware can output the audit log and a PCR quote, signs the quote using an Attestation Private Key for that specific router and responds back to the verifying party. The verifying party will be able to use Cisco provided Known Good Value hashes and the Attestation Public Certificate to verify the attested PCR quotes and audit logs. This verification is protected against replay attacks using a nonce, and ensures the attestation is specific to a particular router by using Attestation key pairs that are unique to each router. Thus, one will be able to trust that the router hardware, boot keys, boot configuration and the running software have not been tampered.

Conclusion

Cisco Tutorials and Materials, Cisco Learning, Cisco Certifications

Figure 1 Security Technologies at All Layers

We set a target of fulfilling security requirements at every layer of the Cisco Hardware and IOS XR Network OS. Figure 1 shows the various technologies in use that satisfy these requirements. Cisco’s Trust Anchor provides a foundation of trust for the Next Generation of Security in Service Provider routers that allows service providers to deploy Trusted Platforms, especially when deployed in remote and open locations. The security features in IOS XR software provide a strong defensive environment to run Cisco and Customer applications. Together, the union of Cisco’s Trust Anchor hardware and IOS XR software provide truly Trustworthy Solutions, where the trustworthiness of the system can be measured using Remote Attestation.

As new attacks emerge, Cisco is dedicated to further strengthen security and trustworthy solutions. We are committed to transparency and accountability, acting as a trusted partner to our customers to address evolving security threats.

Saturday, 20 April 2019

Change is the only constant – vPC with Fabric Peering for VXLAN EVPN

Optimize Usage of Available Interfaces, Bandwidth, Connectivity


Dual-homing for endpoints is a common requirement, and many Multi-Chassis Link Aggregation (MC-LAG) solutions were built to address this need. Within the Cisco Nexus portfolio, the virtual Port-Channel (vPC) architecture addressed this need from the very early days of NX-OS. With VXLAN, vPC was enhanced to accommodate the needs for dual-homed endpoints in network overlays.

With EVPN becoming the de-facto standard control-plane for VXLAN, additions to vPC for VXLAN BGP EVPN were required. While the problem space of End-Point Multi-Homing changes, vPC for VXLAN BGP EVPN changes and faces the new requirements and use-cases. The latest innovation in vPC optimizes the usage of the available interfaces, bandwidth and overall connectivity – vPC with Fabric Peering removes the need for dedicating a physical Peer Link and changes how MC-LAG is done. VPC with Fabric Peering is shipping in NX-OS 9.2(3).

Active-Active Forwarding Paths in Layer 2, Default Gateway to Endpoints


At Cisco, we continually innovate on our data center fabric technologies, iterating from traditional Spanning-Tree to virtual Port-Channel (vPC), and from Fabric Path to VXLAN.

Traditional vPC moved infrastructures past the limitations of Spanning-Tree and allow an endpoint to connect to two different physical Cisco Nexus switches using a single logical interface – a virtual Port-Channel interface. Cisco vPC offers an active-active forwarding path not only for Layer 2 but also inherits this paradigm for the first-hop gateway function, providing active-active default gateway to the endpoints. Because of the merged existence of two Cisco Nexus switches, Spanning-Tree does not see any loops, leaving all links active.

Cisco Tutorial and Materials, Cisco Guides, Cisco Learning, Cisco Tutorial and Materials

vPC for VXLAN BGP EVPN


When vPC was expanded to support VXLAN and VXLAN BGP EVPN environments, Anycast VTEP was added. Anycast VTEP is a shared logical entity, represented with a Virtual IP address, across the two vPC member switches. With this minor increment, the vPC behavior itself hasn’t changed. Anycast VTEP integrates the vPC technology into the new technology paradigm of routed networks and overlays. Such an adjustment had been done previously within FabricPath. In that situation, a Virtual Switch ID was used – another approach for a common shared virtual entity represented to the network side.

While vPC to was enhanced to accommodate different network architectures and protocols, the operational workflow for customers remained the same. As a result, vPC was widely adopted within the industry.

With VXLAN BGP EVPN being a combined Layer 2 and Layer 3 network, where both host and prefix routing exists, the need for MAC, IP and prefix state information is required – in short, the exchange of routing information next to MAC and ARP/ND. To relax a hard routing table and the sync between vPC member, a selective condition for routing advertisement was introduced, “advertise-pip”. With the addition of “advertise-pip”, the selective advertisement of BGP EVPN prefix routes was changed and now advertised from the individual vPC member nodes and its Primary IP (PIP) instead of the shared Virtual IP (VIP). This had the result that unnecessary routing traffic was kept off the vPC Peer Link and instead derived directly to the correct vPC member node.

While many enhancements for convergence and traffic optimization went into vPC for VXLAN BGP EVPN, many implicit changes came with additional configuration accommodating the vPC Peer Link; at this point Cisco decided to change this paradigm of using a physical Peer Link.

The vPC Peer Link


The vPC Peer Link is the binding entity that pairs individual Switches into a vPC domain. This link is used to synchronize the two individual Switches and assists Layer 2 control-plane protocols, like BPDUs or LACP, as it would come from one single Node. In the cases where End-Points are Dual-Homed to both vPC member switches, the Peer Links sole purpose is to synchronize the state information as described before, but in cases of single-connected End-Points, so called Orphans, the vPC Peer Link can still potentially carry traffic.

With VXLAN BGP EVPN, the Peer Link was required to support additional duties and provided additional signalization when Multicast-based Underlays were used. Further, the vPC Peer Link was used as a backup routing instance in the case of an extended uplink failure towards the Spines or for the per-VRF routing information exchange for orphan networks.

With all these various requirements, it was a given requirement for making the vPC Peer Link resilient, with Cisco’s recommendation to have at least two or more physical interfaces dedicated for this role.

The aim to simplify topologies and the unique capability of the Cisco Nexus 9000 CloudScale ASICs led to the removal of the physical vPC Peer Link requirement. This freed at least two physical interfaces, increasing interface capacity by nearly 5%.

Cisco Tutorial and Materials, Cisco Guides, Cisco Learning, Cisco Tutorial and Materials

vPC with Fabric Peering


While changes and adjustment to an existing architecture can always be made, sometimes a more dramatical shift has to be considered. When vPC with Fabric Peering was initially discussed, the removal of the physical vPC Peer Link was the objective but rapidly other improvements came to mind. As such, vPC with Fabric Peering follows a different forwarding paradigm by keeping the operational consistency for vPC intact. The following four sections cover the key architecture principals for vPC with Fabric Peering.

Keep existing vPC Features

As we enhanecd vPC with Fabric Peering, we wanted to ensure that existing features are not being affected. Special focus was added to ensure the availability of Border Leaf functionality with external routing peering, VXLAN OAM and Tenant Routed Multicast (TRM).

Benefits to your Network Design

Every interface has a cost and so every Gigabyte counts. By relaxing the physical vPC Peer Link, we not only achieve architecture fidelity but also return interface and optical cost as well as optimizing the available bandwidth.

Leveraging Leaf/Spine topologies and respective N-way Spines, the available path between any 2 Leafs becomes ECMP and as such, a potential candidate for the vPC Fabric Peering. With all Spines now sharing VXLAN BGP EVPN Leaf to Leaf or East-to-West communication and vPC Fabric Peering, the overall use of provisioned bandwidth becomes more optimized. Given that all links are shared, the increased resiliency for the vPC Peer Link is equal to the resiliency of Leaf to Spine connectivity. This is a significant increase compared to the two physical direct links between two vPC members.

With the infrastructure between the vPC members now shared, the proper classification of vPC Peer Link vs. general fabric payload has to be considered. In foresight of this, the vPC Fabric Peering has the ability to be classified with a high DSCP marking to ensure in-time delivery.

Cisco Tutorial and Materials, Cisco Guides, Cisco Learning, Cisco Tutorial and Materials

Overview: vPC with Fabric Peering

Another important cornerstone of vPC was the Peer Keep Alive functionality. vPC with Fabric Peering keeps the important failsafe functions in place but relaxes the requirement of using a separate physical link. The vPC Peer Keep Alive can now be over the Spine infrastructure in parallel to the virtual Peer Link. As an alternative and to increase the resiliency, the vPC Peer Keep Alive can still be deployed over the out-of-band management network or any other routed network of choice between the vPC member nodes.

In addition to the vPC Peer Keep Alive, the tracking of the uplinks towards the Spines has been introduced to more deterministically understand the topology. As such the uplink tracking will create a dependency on the vPC primary function and respectively switch the operational primary role depending on the vPC members availability in the fabric.

Focus on individual VTEP behavior

The primary use-case for vPC has always been for dual-homed End-Points. However, with this approach, single attached End-Points (orphans) were treated like 2nd class citizen where the vPC Peer Link allowed reachability.

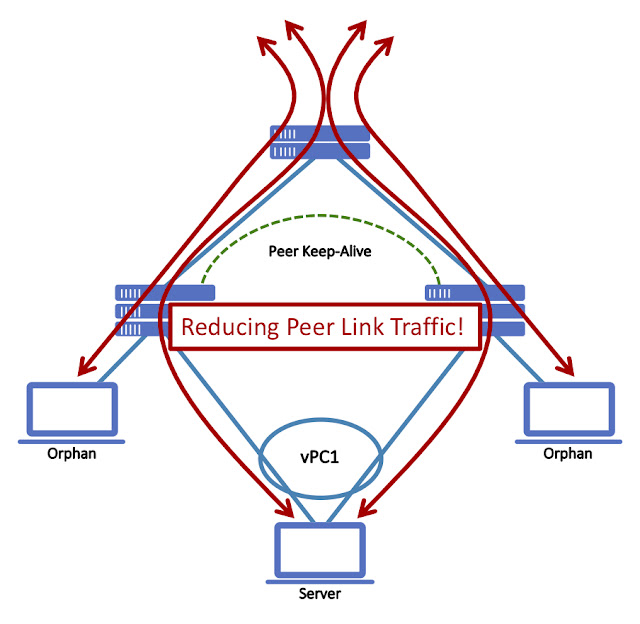
When vPC with Fabric Peering was designed, unnecessary traffic over the “virtual” Peer Link should be avoided by any means and also the need for per-VRF peering over the same.

With this decision, orphan End-Points become a 1st class citizen similar as dual-homed End-Points are and the exchange of routing information should be done through BGP EVPN instead of per-VRF peering.

Cisco Tutorial and Materials, Cisco Guides, Cisco Learning, Cisco Tutorial and Materials

Traffic Flow Optimization for vPC and Orphan Host

When using vPC with Fabric Peering, orphan End-Points and networks connected to individual vPC member are advertised from the VTEPs Primary IP address aka PIP; in vPC with physical Peer Link it would always use the Virtual IP (VIP). With the PIP approach, the forwarding decision from and to this orphan End-Point/network will be resolved as part of the BGP EVPN control-plane and forwarded with VXLAN data-plane. The forwarding paradigm of these orphan End/Point/network is the same as it would be with an individual VTEP; the dependency on the vPC Peer Link has been removed. As an additional benefit, consistent forwarding is archived for orphan End-Point/Network connected to an individual VTEP or a vPC domain with Fabric Peering. You could consider that vPC member node existing in vPC with Fabric Peering behaves primarily as an individual VTEP or “always-PIP” for orphan MAC/IP or IP Prefixes.

vPC where vPC is needed

With the paradigm shift to primarily operate an individual vPC member node as a standalone VTEP, the dual-homing functionality has to only be given to specific attachment circuits. As such, the functionality of vPC only comes into play when the vPC keyword has been used on the attachment circuit. In the case for vPC attachment, the End-Point advertisement would be originated with the Virtual IP Address (VIP) of the Anycast VTEP. Leveraging this shared VIP, routed redundancy from the fabric side is achieved with extremely fast ECMP failover times.

In the case of traditional vPC, the vPC Peer Link was also used during failure cases of an End-Points dual attachment. As the advertisement of a previous dual-attached End-Point doesn’t change from VIP to PIP during failures, the need for a Peer Link equivalent function is required. In the case traffic follows the VIP and get hashed towards the wrong vPC member node, the one with the failed link, the respective vPC member node will bounce the traffic the other vPC member.

Cisco Tutorial and Materials, Cisco Guides, Cisco Learning, Cisco Tutorial and Materials

Traffic redirected in vPC failure cases

vPC with Fabric Peering is shipping as per NX-OS 9.2(3)

Benefits


These enhancements have been delivered without impacting existing vPC features and functionality in lock-step with the same scale and sub-second convergence as existing vPC deployments achieved.

While the addition of new features and functions is simple, having an easy migration path is fundamental to deployment. Knowing this, the impact considerations for upgrades, side grades or migration remains paramount – and changing from vPC Peer Link to vPC Fabric Peering can be easily performed.

vPC with Fabric Peering was primarily designed for VXLAN BGP EVPN networks and is shipping in NX-OS 9.2(3). Even so, this architecture can be equally applied to most vPC environment, as long as routed Leaf/Spine topology exists.

Cisco Tutorial and Materials, Cisco Guides, Cisco Learning, Cisco Tutorial and Materials

Friday, 19 April 2019

Using Tetration for Application Security and Policy Enforcement

Protecting assets requires a Defense in Depth approach


Protecting assets within the enterprise requires the network manager to adopt automated methods of implementing policy on endpoints. A defense in depth approach, applying a consistent policy to the traditional firewall as well as policy enforcement on the host, takes a systemic view of the network.

Value added resellers are increasingly helping customers deploy solutions comprised of vendor hardware and software, support for open source software, and developing code which integrates these components. A great example of this, and the subject of this blog, is World Wide Technology making its integration with Ansible Tower and Cisco Tetration available as open source through Cisco DevNet Code Exchange.

I started my career in programming and analysis and systems administration, transitioned to network engineering, and now the projects I find most interesting require a combination of all those skills. Network engineers must view the network in a much broader scope, a software system that generates telemetry, analyzes it, and uses automation to implement policy to secure applications and endpoints.

The theme for Networkers/CiscoLive 1995 was ‘Any to Any.’ However, we don’t live in that world today. Then, the focus was to enable communication between nodes. Today, the focus is to enable network segmentation, restricting communication between nodes for legitimate business purposes. Today we ask, “What’s on my network?” “What is it doing?” and “Should it be?”

A Zero Trust security model, in the data center and on the endpoint, is a common topic for discussion for our customers. The traditional perimeter security model is less effective as cyber security attacks simply bypass firewalls and attack internal assets with phishing exploits. The Tetration Network Policy Publisher is one means to automate policy creation.

Tetration Network Policy Publisher


Introduced in April 2018, the Tetration Network Policy Publisher is an advanced feature enabling third parties to subscribe to the same policy applied to servers by the Tetration enforcement agent.

The Tetration cluster runs a Kafka instance and publishes the enforcement policies to a message bus. Unlike other message bus technologies, Kafka clients explicitly ‘ask’ for messages, by subscribing to a Kafka topic. Access to the policy is provided by downloading the Kafka client certificates from the Tetration user interface.

The enforcement policy messages are encoded as Google Protocol Buffers (protobuf), an efficient and extensible format for exchanging structured data between hosts. While more complex for the programmer, protobufs are both efficient on the wire and CPU compared to JSON or XML.
This feature enables ‘defense in depth’. The enforcement policy can be converted to the appropriate network appliance configuration and implemented on firewalls, router access lists, and security enabled load balancers. Ansible is one means to automate pushing policy to network assets.

Ansible Tower by Red Hat


Ansible Tower is a web-based solution which makes Ansible Engine easier to use across teams within an IT enterprise. Tower includes a REST API and CLI for ease of integration with existing tools and processes. Ansible Engine is built on the open source Ansible project. Red Hat licenses and provides support services for Ansible Tower and Engine.

Ansible has evolved into the defacto automation solution for configuration management across a wide range of compute, storage, network, firewall and load balancer resources in the cloud and on-premise.

Ansible interface to Cisco Tetration Network Policy Publisher


This project provides an abstraction layer between the Tetration Network Policy Publisher and Ansible, allowing the network administrator to push enforcement policy to ‘all the things’, without directly accessing the Tetration Kafka message bus. The code is open source and is publicly available through Cisco DevNet Code Exchange, a curated set of repos that make it easy to discover and use code related to Cisco technologies. The project repository, ansible-tetration, includes an Ansible module that retrieves enforcement policy from Tetration and exposes it as variables to an Ansible playbook. Subsequent tasks within the playbook can apply the policy to the configuration of network devices.

This functionality provides value to network operations as policy is published periodically, in an easily consumed format. NetDevOps engineers can focus on implementing policy without the need to understand the complexity of creating the policy.

Figure 1 illustrates the components of this solution.

Cisco Tutorial and Material, Cisco Guides, Cisco Learning, Cisco Study Materials

Figure 1- Ansible interface to Cisco Tetration Network Policy Publisher

Links to additional resources of this project are available on Code Exchange.

Simplify the Complex


Within IT operations, forming NetDevOps teams to integrate disparate systems is the model for high-performance organizations. While encouraging each team member to have general level of understanding of the organization’s goals, it is also important to include specialists in a technology, to leverage their deep experience in one area to increase the velocity of the team.
The project goal is to expose policy generated by Tetration in a simple format a network operator can use to enable defense in depth within their datacenter.

Figure 2 illustrates how the Python module tetration_network_policy, can be included in an Ansible playbook, retrieve a security policy and register the results as a variable.

Cisco Tutorial and Material, Cisco Guides, Cisco Learning, Cisco Study Materials

Figure 2- Tetration Network Policy task

In this example, the variable tnp contains the Tetration Network Policy (inventory_filters, intents, tenant name and catch_all policy) for the requested Kafka topic. Subsequent tasks can reference these values and apply the security policy to network devices.

Figure 3 illustrates the contents of variable tnp, which will be used to generate access control lists on an ASA firewall.

Cisco Tutorial and Material, Cisco Guides, Cisco Learning, Cisco Study Materials

Figure 3- Sample JSON formatted network policy

By exposing the policy to an Ansible playbook, the data can be easily reformatted to a traditional CLI configuration and applied to a firewall, load balancer or Cisco ACI fabric.

Use Case: Apply Policy to ASA Firewalls


Now that the network policy has been retrieved and loaded to a variable within the playbook, it can used to configure a network device. In this example, the target device is a Cisco ASA firewall.
By invoking the Ansible module asa_config, the network policy is used to create the appropriate CLI commands and apply them to one or more firewalls defined in the inventory.

Figure 4 illustrates the playbook syntax.

Cisco Tutorial and Material, Cisco Guides, Cisco Learning, Cisco Study Materials

Figure 4 – Ansible module asa_config

Following the execution of the playbook, the sample JSON formatted network policy is present in the firewall configuration, as shown in Figure 5.

Cisco Tutorial and Material, Cisco Guides, Cisco Learning, Cisco Study Materials

Figure 5 – ASA configuration

Note: Because SNMP is a well know port, the ASA CLI has substituted SNMP to reference port 161.