In order to avoid traffic, we usually turn to one common solution. Simply turn on your favorite GPS map application and find the most optimized route around traffic congestion. These applications provide us with real-time traffic reports and visualization across the GRID and in every city.
The same analogy can be applied to Cisco’s industry-unique solution: SAN Analytics for Cisco MDS 9000 series switches.
The Need for SAN Visibility
When beginning a performance review of our storage environment, we need complete visibility. Storage management solutions provide valuable insights from the fabric storage and server infrastructure perspective. But what about congestion that occurs outside of the server or storage environment? It could be a misbehaving application, a corrupt piece of hardware in the pathway, or a saturated storage port. It could even be a VM causing heavy utilization on a server port or an application with bursty behavior caused by a large number of small IOPS. It can literally be anything, right? This is precisely where Cisco SAN Analytics comes to the rescue.
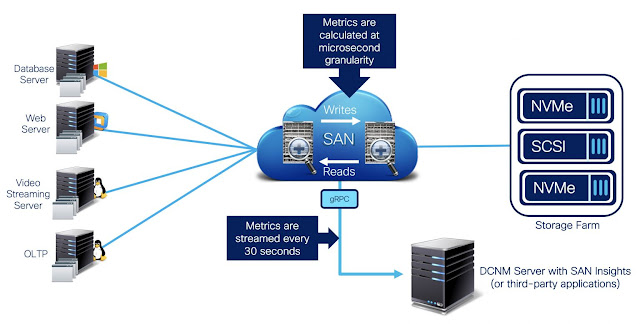
Like a trusted GPS, Cisco SAN Analytics running on the Cisco MDS 32G platform provides real-time, complete visibility across the fabric comprising of SCSI/NVMe flows. Let’s look at this very briefly and understand how it functions in Cisco’s MDS 32G switches.
How It Works
The Cisco SAN Analytics solution runs on the onboard NPU (Network Processing Unit) located on the Cisco MDS 32G platform. It runs on a dedicated network processor which carry out the analytics operation. Hence, turning on this feature is non-disruptive to any normal switching functionality. The dedicated NPU (Network Processor Unit) residing on each 32G module or switch will analyze the Fibre Channel protocol header information (SCSI or NVMe). It will then export this metadata from the switches using streaming telemetry via the management port. This metadata can be streamed into the DCNM (Data Center Network Manager) or to any 3rd party tool that has the ability to digest gRPC formatted data.
The unique features of SAN Analytics
◉ Accessibility: Turn ON or OFF anytime, without disrupting normal switching traffic through the port.
◉ Ease of configuration or administration: It is not rocket science! It’s a simple 4-step process using DCNM or a 2-line CLI command to enable it.
◉ Flexibility: It can analyze SCSI or NVMe flows, or both flows together.
◉ Security: Security does not interfere with the data payload, so there is no concern with compromising the data at any point.
◉ Simplicity: How about those extra cabling or ports? Not necessary, as this is an on-switch function requiring no extra cables or ports.
◉ Scalability: It can be turned on across selected / all of the switch ports to monitor up to 40,000 flows.
Now, if there are any issues in the fabric (or even to improve the performance of the fabric), you will know where to send the ambulance!
This is how Cisco SAN Analytics is defining the standards for storage network analytics: simple, scalable, and secure.
Take SAN Analytics for a Test Drive
Why not try it out? Both Cisco Data Center Network Manager (DCNM) and the SAN Analytics software products can be deployed and utilized with full product capabilities for up to 120 days. This will allow customers to test drive these amazing technologies in their environments to get a feel for their capabilities before they purchase.
Simply grab any Cisco MDS 32G FC switch/module, put it in any fabric (Cisco or non-Cisco), and discover issues long before they can become a real problem.


