Tuesday, 4 October 2022

CML 2.4 Now Supports Horizontal Scale With Clustering

Cisco Career, Cisco Certification, Cisco Jobs, Cisco Skills, Cisco Learning, Cisco Tutorial and Materials, Cisco Prep, Cisco Preparation, Cisco Scale

When will CML 2 support clustering?

This was the question we heard most when we released Cisco Modeling Labs (CML) 2.0 — and it was a great one, at that. So, we listened. CML 2.4 now offers a clustering feature for CML-Enterprise and CML-Higher Education licenses, which supports the scaling of a CML 2 deployment horizontally.

But what does that mean? And what exactly is clustering? Read on to learn about the benefits of Cisco Modeling Labs’ new clustering feature in CML 2.4, how clustering works, and what we have planned for the future.

Cisco Career, Cisco Certification, Cisco Jobs, Cisco Skills, Cisco Learning, Cisco Tutorial and Materials, Cisco Prep, Cisco Preparation, Cisco Scale

CML clustering benefits


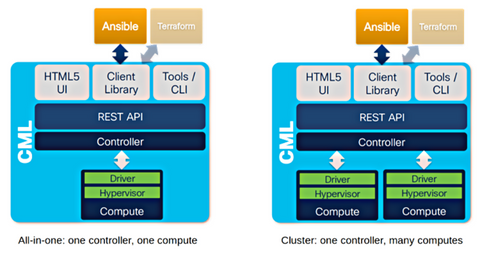
When CML is deployed in a cluster, a lab is no longer restricted to the resources of a single computer (the all-in-one controller). Instead, the lab can use resources from multiple servers combined into a single, large bundle of Cisco Modeling Labs infrastructure.

In CML 2.4, CML-Enterprise and CML-Higher Education customers who have migrated to a CML cluster deployment can leverage clustering to run larger labs with more (or larger) nodes. In other words, a CML instance can now support more users with all their labs. And when combining multiple computers and their resources into a single CML instance, users will still have the same seamless experience as before, with the User Interface (UI) remaining the same. There is no need to select what should run where. The CML controller handles it all behind the scenes, transparently!

How clustering works in CML v2.4 (and beyond)


A CML cluster consists of two types of computers:

◉ One controller: The server that hosts the controller code, the UI, the API, and the reference platform images

◉ One or more computes: Servers that run node Virtual Machines (VMs), for instance, the routers, switches, and other nodes that make up a lab. The controller controls these machines (of course), so users will not directly interact with them. Also, a separate Layer 2 network segment connects the controller and the computes. We chose the separate network approach for security (isolation) and performance reasons. No IP addressing or other services are required on this cluster network. Everything operates automatically and transparently through the machines participating in the cluster.
This intracluster network serves many purposes, most notably:

    ◉ serving all reference platform images, node definitions, and other files from the controller via NFS sharing to all computes of a cluster.

    ◉ transporting networking traffic in a simulated network (which spans multiple computes) on the cluster network between the computes or (in case of external connector traffic) to and from the controller.

    ◉ conducting low-level API calls from the controller to the computes to start/stop VMs, for example, and operating the individual compute.

Defining a controller or a compute during CML 2.4 cluster installation


During installation, and when multiple network interface cards (NICs) are present in the server, the initial setup script will ask the user to choose which role this server should take: “controller” or “compute.” Depending on the role, the person deploying the cluster will enter additional parameters.

For a controller, the important parameters are its hostname and the secret key, which computes will use to register with the controller. Therefore, when installing a compute, the hostname and key parameters serve to establish the cluster relationship with the controller.

Every compute that uses the same cluster network (and knows the controller’s name and secret) will then automatically register with that controller as part of the CML cluster.

CML 2.4 scalability limits and recommendations


We have tested clustering with a bare metal cluster of nine UCS systems, totaling over 3.5TB of memory and more than 630 vCPUs. On such a system, the largest single lab we ran (and support) is 320 nodes. This is an artificial limitation enforced by the maximum number of node licenses a system can hold. We currently support one CML cluster with up to eight computes.

Plans for future CML releases

While some limitations still exist in this release in terms of features and scalability, remember this is only Phase 1. This means the functionality is there, and future releases promise even more features, such as the:

◉ ability to de-register compute

◉ ability to put computes in maintenance mode.

◉ ability to migrate node VMs from one compute to another.

◉ central software upgrade and management of compute

Source: cisco.com

Saturday, 1 October 2022

Empowering the four IT personas using Cisco DNA Center with Rings of Power

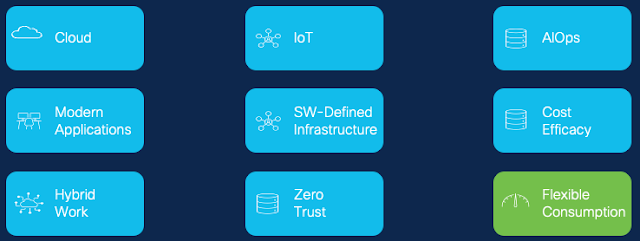
There are many variations of the “Law of Constant Change”; while they all have their own spin on it, the common thread is that change is constant and that it needs to be harnessed. When looking at changes and disruptions in technology, it comes as no surprise that there are numerous transformations and trends which are reshaping the IT landscape. The megatrends and change drivers span a wide range of business changes and transformation agents such as:

Cisco, Cisco Exam, Cisco Exam Prep, Cisco Preparation, Cisco Tutorial and Materials, Cisco Career, Cisco Skills, Cisco Jobs, Cisco IT Prep, Cisco Certification

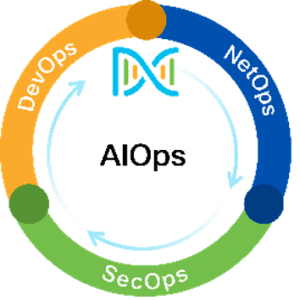
To keep up with the rapidly changing IT landscape, many IT organizations have been able to ascend and transform into new operational paradigms with the xOps transformation. Conversations around agility, AIOps, NetOps, SecOps, and DevOps are an outcome of a combination of organizational behavior and tooling in the networking and infrastructure realms. Separately, Gartner has also identified four IT personas (NetOps, SecOps, AIOps, and DevOps) which Gartner defined as predominant roles in today’s network operations realm.

In looking at key challenges, organizations are struggling with:

◉ Reducing time recovery objectives due to the reactive nature of traditional network operations practices.
◉ Bridging the growing IT skill gap.
◉ Keeping up with changing business requirements.
◉ Delivery of secure services in the hybrid workplace.
◉ Having to deliver more with less.

With Cisco’s years of expertise in designing, operating, and supporting networks of all sizes across the globe. Cisco has been an instrumental part in helping IT organizations move forward to the next operational level with tools to embrace and enable the xOps personas and embark on the transformation journey. This boils down to providing tools with analytics capabilities from the infrastructure and cultivating staff skills to use them effectively.

Speaking of how tooling can enable the transition, Cisco DNA Center is at the center of the IT/OT transition into the four IT personas, providing the digital agility to drive network insight automation and security while promoting key capabilities and tools to help in skill cultivation and changed operational models.

Cisco, Cisco Exam, Cisco Exam Prep, Cisco Preparation, Cisco Tutorial and Materials, Cisco Career, Cisco Skills, Cisco Jobs, Cisco IT Prep, Cisco Certification

Network Operations or “NetOps” is the front line of administrators in the IT organization. The term NetOps is a way to classify the common tasks and responsibilities, or “Jobs to be Done,” by these individuals. With Cisco DNA Center at the heart of the network infrastructure, the NetOps persona is enhanced with varying levels of automation to simplify the creation and maintenance of networks with agile flexibility to move from manual tasks to AI-assisted to selectively autonomous network management. For example, the SWIM (Software Image Management) and network profiles feature not only save time but allow for consistency and elimination of human error with routine tasks. The NetOps automation brought into DevOps provides agility and scalability to IT organizations to keep up with changing demands and integration into the larger IT ecosystem. Gartner has stated that the next generation of Netops, which Gartner coined as “Netops 2.0” is the evolution of network operations towards automation.

Cisco, Cisco Exam, Cisco Exam Prep, Cisco Preparation, Cisco Tutorial and Materials, Cisco Career, Cisco Skills, Cisco Jobs, Cisco IT Prep, Cisco Certification

Network, application, and user security is a key requirement for any enterprise network, and no network can operate safely without security. The security team is responsible for providing a safe digital experience in today’s connect-from-anywhere hybrid work environment and networks with countless numbers of endpoint devices. Also, many IT organizations in different market segments have various network security and architecture recruitments. Cisco DNA Center empowers the SecOps persona by enabling the complete zero-trust workplace solution with AI-driven security to classify endpoints and automated enforcement of security policies. This is achieved with Cisco’s fully integrated platform, which incorporates hardware and software designed to provide contextual security insights and automation. Cisco DNA Center SecOps can help eliminate security vulnerabilities with proactive security scans, automated security advisory alerting Cisco’s Product Security Incident Response Team (PSIRT), and proactive bug scans powered by Cisco AI Network Analytics engine to ensure the network is always secure.

Cisco, Cisco Exam, Cisco Exam Prep, Cisco Preparation, Cisco Tutorial and Materials, Cisco Career, Cisco Skills, Cisco Jobs, Cisco IT Prep, Cisco Certification

The DevOps persona brings integration, automation, and orchestration together. Traditionally, DevOps teams focused on very specialized, proprietary, and home-spun applications. Today, these individuals are tasked with taking these apps and integrating them into a connected universe of corporate solutions. DevOps depends on manufacturer-supplied software tool kits (STKs) and standards-based application programming interfaces (APIs) in order to share information and intelligence between applications. With Cisco DNA Center, IT organizations can quickly utilize pre-built integrations to Cisco products and 3rd party enterprise applications such as ServiceNow, Splunk, PagerDuty, and a growing selection of partner integrations. Cisco DNA Center’s mature APIs enable the extraction of data and network management, leveraging and harnessing the power of Cisco DNA Center’s NetOps, AIOps and SecOps via the API interface.

Cisco, Cisco Exam, Cisco Exam Prep, Cisco Preparation, Cisco Tutorial and Materials, Cisco Career, Cisco Skills, Cisco Jobs, Cisco IT Prep, Cisco Certification

AIOps defines the technologies that implement AI/ML (Artificial Intelligence and Machine Learning) and the individuals that leverage these technologies. Evidently, AI/ML is being implemented in so many of our networking components that it has become imperative that a specialized team of experts manage and amplify the use of this intelligence. Cisco DNA Center provides a simplified view into the complexities of big data and machine learning so that your AIOps teams can make the most of this rich data.  Additionally, Cisco DNA Center provides best-in-class AI-driven visibility, observability, and insights, ensuring the health and experience of users, applications, and infrastructure. AI/ML is packaged within Cisco DNA Center in an easy consumption interface that can deliver value in minutes and allow IT teams to work smarter and elevate the level of service to the users and organization. Hence, with Cisco DNA Center AIOps, IT organizations can gain visibility and insights otherwise not attainable without AI/ML combined with Cisco’s deep networking knowledge. Simply put, this powerful combination makes the IT team more agile and smarter and helps bridge growing IT skills gaps.

The xOps Rings of power

While the four IT personas were explained as distinct roles, in many organizations, they are simply different hats that IT staff can wear at different times depending on the business need.  It is also essential to keep the perspective that each of the personas enables and provides services to other personas, yielding the “Rings of Power” for example, with AI centricity, Cisco DNA Center empowers, enables, and enhances the NetOps, SecOps, and DevOps personas by providing interactions with all personas in the ring. Similarly, NetOps persona-centricity enables and empowers DevOps, SecOps, and AIOps personas.

An example of the AIOps ring of power:

Cisco, Cisco Exam, Cisco Exam Prep, Cisco Preparation, Cisco Tutorial and Materials, Cisco Career, Cisco Skills, Cisco Jobs, Cisco IT Prep, Cisco Certification
AIOps
discovers security vulnerabilities and recommends an upgrade.

NetOps performs the SWIM process to upgrade the software.

DevOps connects to ServiceNow for the change management and ticket creation processes.

SecOps reports the new network security posture, eliminating the security vulnerability from the network.

Leveraging Cisco DNA Center to enable and empower the new IT personas model, IT organizations can quickly and easily gain visibility, observability, insights, and out-of-the-box automation. While organizations with more modern operational models are also able to yield zero trust, and programmability from the Cisco Network infrastructure. This enables IT organizations to be more agile and transform into the new xOps operational paradigm, allowing the IT organization to progress on the operational maturity journey, become proactive and leave the reactive persona behind.

Source: cisco.com
Thursday, 29 September 2022

[New] 200-301 CCNA: Cisco 200-301 Free Exam Questions & Answers


Cisco CCNA Exam Description:

This exam tests a candidate's knowledge and skills related to network fundamentals, network access, IP connectivity, IP services, security fundamentals, and automation and programmability. The course, Implementing and Administering Cisco Solutions (CCNA), helps candidates prepare for this exam.

Cisco 200-301 Exam Overview:

Cisco 200-301 Exam Topics:

  • Network Fundamentals- 20%
  • Network Access- 20%
  • IP Connectivity- 25%
  • IP Services- 10%
  • Security Fundamentals- 15%
  • Automation and Programmability- 10%
Related Articles:-

Monitoring for Your “Pets.” Observability for Your “Cattle.”

What’s the difference between monitoring and observability


Today, the second most active project in CNCF is the Open Telemetry project that provides a solution to the Observability problem of modern cloud native applications.

A question often asked is – I have monitoring for my legacy applications that I can extend to include any new apps, so why do I need observability? And what’s the difference between monitoring and observability anyways? There is much debate in the industry about this and if you ask ten people about their take on this, you will probably get ten different answers. Let us see some common interpretations of the two.

How legacy monitoring systems worked


Remember those times when we deployed our applications on a bunch of servers? We even knew those servers by name – just like our pets! To assess the health and performance of our applications, we collected events from every application and every network entity. We deployed centralized monitoring systems that collected standard (remember SNMP?) and vendor proprietary notifications. Correlation engines, which were basically vendor specific, executed on this vast number of events and identified failure objects with custom rules.

Here’s a very simplistic view of a legacy monitoring system:

Simplistic view of a legacy monitoring system

Trend analysis with custom dashboards came to our aid when we had to trouble shoot a production problem. Traditional monitoring worked off a known set of anticipated problems. Monitoring systems were built around that, reacting to issues as and when they occurred with a prebuilt set of actions. Failure domains were known ahead of time and identified with customized correlation rules. Telemetry data such as logs, metrics, and traces were siloed. Operators did a manual correlation of the three sets of data. Alerting was after the fact (or reactive) when thresholds exceeded a preset minor, major or critical threshold.

Servers hosting our critical applications were our “pets”


The entire application landscape, including infrastructure, was operationalized with proprietary monitoring systems. It seemed quite adequate. Operators had a deep understanding of the architecture of applications and the systems hosting them. Operating guides laid out alerting and details on resolutions. Everything seemed to function like a well-oiled machine aligned with the goal of those times – to help I&O teams keep the lights on.

And then the applications split and spread their wings, migrating to the clouds!

Enter microservices


We now deal with “cattle.” That is, short lived containers that come and go – everything seems dispensable, replaceable, and scalable. Considering the magnitude of containers, traditional monitoring systems prove totally insufficient to manage this new breed of applications with their unimaginable number of events. This scenario is only made more complex considering that there are no standards for cloud monitoring with each public cloud provider inserting their own little stickiness into the mix.

Microservices make it hard to update monitoring systems


Microservices no longer deal with long release cycles. With monolithic apps, there used to be a sync up among various teams on architecture changes to the services being updated. However,  it’s hard on I&O teams to update monitoring systems as microservices change. The bottom line is that I&O teams will possibly be operating apps that they don’t totally understand architecturally.

Enter “observability”


Observability promises to address the complexities of tracking cloud native application health and performance.

Observability is for systems that can be pretty much of a black box. It helps I&O teams who are trying to identify the internal state of the black box from telemetry data collected. It involves finding an answer to the unknown unknowns – meaning we cannot predict what’s going to happen but need the ability to ask questions and get answers so we can best formulate an action to the issue. Observability is about deriving signals from raw telemetry data as an integrated platform for logs, metrics, and traces.

Cisco Career, Cisco Skills, Cisco Jobs, Cisco Tutorial and Materials, Cisco Guides, Cisco Certification, Cisco Prep, Cisco Preparation

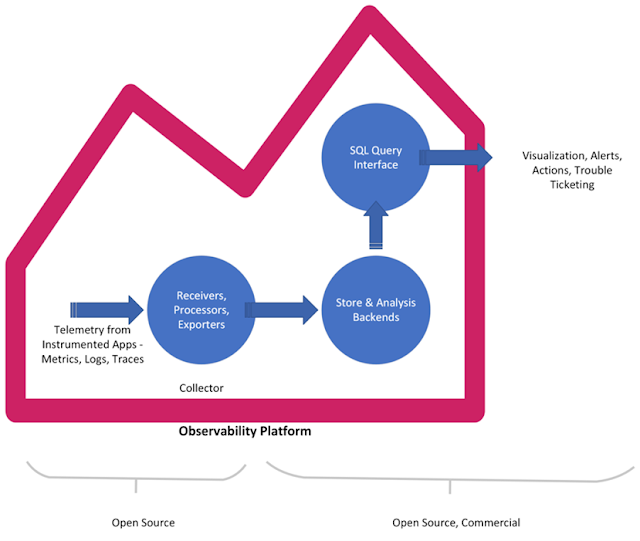
In today’s dynamic, polyglot ecosystem where services are individually scaling to meet demands, simple monitoring built around a known set of events and alerts will fail. An Observability platform will ingest an insightful set of data generated by instrumentation of apps. Then, transform and collate trace/metrics/log data and funnel it into data stores that can then be queried to gauge the system health and performance. The key here is the context that can be attached to any aggregated data that can help decipher the internal state of the system and failures.

Extracting valuable signals from correlated data


In conclusion, the nirvana that we are striving for seems to be a scenario where we have literally all the data we need from instrumented apps as a correlated set of metrics, logs, and traces. Following this, the right set of tools will extract valuable signals from this correlated data revealing not only the service model but also failure objects to address health and performance issues.

Watch out for future blogs where we will explore OpenTelemetry as a solution to observability and explore MELT (metrics, events, logs, traces) with open source and commercial tools.

Source: cisco.com
Tuesday, 27 September 2022

Cisco MDS 9000 FSPF Link Cost Multiplier: Enhancing Path Selection on High-Speed Storage Networks

Cisco MDS, Cisco, Cisco Prep, Cisco Preparation, Cisco Career, Cisco Skills, Cisco Jobs, Cisco FSPF, Cisco Certification, Cisco Tutorial and Materials, Cisco News

The need for optimal path selection


When embarking on a journey from one location to another one, we always try to determine the best route to follow. This happens according to some preference criteria. Having a single route is the simplest situation but that would lead to long delays in case of any problem occurring along the way. Availability of multiple paths to destination is good in terms of reliability. Of course, we would need an optimal path selection tool and clear street signs, or a navigation system with GPS, to avoid loops or getting lost.

In a similar way, data networks are designed with multiple paths to destination for higher availability. Specific protocols enable optimal path selection and loop avoidance. Ethernet networks have used the Spanning Tree Protocol or more recent standards like TRILL. IP networks rely on routing protocols like BGP, OSPF and RIP to determine the best end-to-end path. Fibre Channel fabrics have their own standard routing protocol, called Fabric Shortest Path First (FSPF), defined by INCITS T11 FC-SW-8.

FSPF on Cisco MDS switches


The FSPF protocol is enabled by default on all Cisco Fibre Channel switches. Normally you do not need to configure any FSPF parameters. FSPF automatically calculates the best path between any two switches in a fabric. It can also select an alternative path in the event of the failure of a given link. FSPF regulates traffic routing no matter how complex the fabric might be, including dual datacenter core-edge designs.

Cisco MDS, Cisco, Cisco Prep, Cisco Preparation, Cisco Career, Cisco Skills, Cisco Jobs, Cisco FSPF, Cisco Certification, Cisco Tutorial and Materials, Cisco News

FSPF supports multipath routing and bases path status on a link state protocol called Shortest Path First. It runs on E ports or TE ports, providing a loop free topology. Routing happens hop by hop, based only on the destination domain ID. FSPF uses a topology database to keep track of the state of the links on all switches in the fabric and associates a cost with each link. It makes use of Dijkstra algorithm and guarantees a fast reconvergence time in case of a topology change. Every VSAN runs its own FSPF instance. By combining VSAN and FSPF technologies, traffic engineering can be achieved on a fabric. One use case would be to force traffic for a VSAN on a specific ISL. Also, the use of PortChannels instead of individual ISLs makes the implementation very efficient as fewer FSPF calculations are required.

FSPF link cost calculation


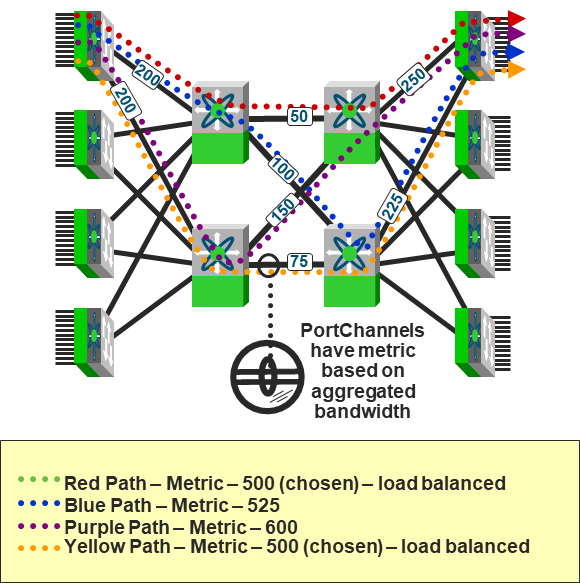
FSPF protocol uses link costs to determine the shortest path in a fabric between a source switch and a destination switch. The protocol tracks the state of links on all switches in the fabric and associates a cost with each link in its database. Also, FSPF determines path cost by adding the costs of all the ISLs in each path. Finally, FSPF compares the cost of various paths and chooses the path with minimum cost. If multiple paths exist with the same minimum cost, FSPF distributes the load among them.

You can administratively set the cost associated with an ISL link as an integer value from 1 to 30000. However, this operation is not necessary and typically FSPF will use its own default mechanism for associating a cost to all links. This is specified within INCITS T11 FC-SW-8 standard. Essentially, the link cost is calculated based on the speed of the link times an administrative multiplier factor. By default, the value of this multiplier is S=1. Practically the link cost is inversely proportional to its bandwidth. Hence the default cost for 1 Gbps links is 1000, for 2 Gbps is 500, for 4 Gbps is 250, for 32 Gbps is 31 and so on.

FSPF link cost calculation challenges


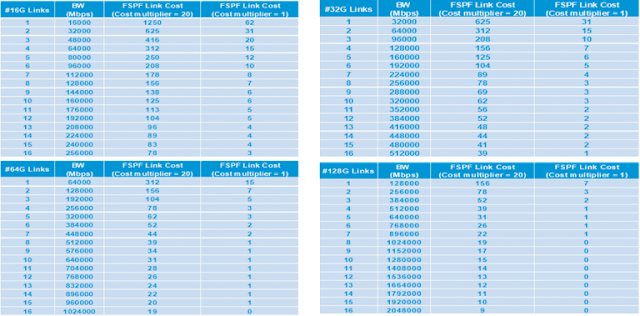
It is easy to realize that  high-speed links introduce some challenges because the link cost computes smaller and smaller. This becomes a significant issue when the total link bandwidth is over 128 Gbps. For these high-speed links, the default link costs become too similar to one another and so leading to inefficiencies.

The situation gets even worse for logical links. FSPF treats PortChannels as a single logical link between two switches. On Cisco MDS 9000 series, a PortChannel can have a maximum of 16 member links. With multiple physical links combined into a PortChannel, the aggregate bandwidth scales upward and the logical link cost reduces accordingly. Consequently, different paths may appear to have the same cost although they have a different member count and different bandwidths. Path inefficiencies may occur when PortChannels with as low as 9 x 16 Gbps members are present. This leads to poor path selection by FSPF. For example, imagine two alternative paths to same destination, one traversing a 9x16G PortChannel and one traversing a 10x16G PortChannel. Despite the two PortChannels have a different aggregate bandwidth, their link cost would compute to the same value.

FSPF link cost multiplier feature


To address the challenge, for now and the future, Cisco MDS NX-OS 9.3(1) release introduced the FSPF link cost multiplier feature. This new feature should be configured when parallel paths above the 128 Gbps threshold exist in a fabric. By doing so, FSPF can properly distinguish higher bandwidth links from one another and is able to select the best path.

All switches in a fabric must use the same FSPF link cost multiplier value. This way they all use the same basis for path cost calculations. This feature automatically distributes the configured FSPF link cost multiplier to all Cisco MDS switches in the fabric with Cisco NX-OS versions that support the feature. If any switches are present in the fabric that do not support the feature, then the configuration fails and is not applied to any switches. After all switches accept the new FSPF link cost multiplier value, a delay of 20 seconds occurs before being applied. This ensures that all switches apply the update simultaneously.

The new FSPF link cost multiplier value is S=20, as opposed to 1 in the traditional implementation. With a simple change to one parameter, Cisco implementation keeps using the same standard based formula as before. With the new value for this parameter, the FSPF link cost computation will stay optimal even for PortChannels with 16 members of up to 128 Gbps speed.

Cisco MDS, Cisco, Cisco Prep, Cisco Preparation, Cisco Career, Cisco Skills, Cisco Jobs, Cisco FSPF, Cisco Certification, Cisco Tutorial and Materials, Cisco News

Source: cisco.com

Sunday, 25 September 2022

Cisco User Defined Network: Better Serviceability, Better Insights

With our higher educational universities welcoming their students back to campus post-Covid, network admins are having a tough time handling the cumbersome and tedious task of onboarding student devices onto the network. With students bringing in their own devices all of which come alive only with network connectivity, it’s quite a tough task to ensure only the right devices are onboarded onto the network.

Cisco’s user-defined network solution helps in seamless onboarding. It also helps in providing a home-like environment to students. There are elaborate blogs that already cover the various benefits UDN 1.0 brings.


With 1000s of students depending on the solution for their daily routines, it is crucial for admins to be equipped with the right set of tools to have visibility into their network. With the adoption of Cisco UDN solutions increasing, the network admin would love to have tools that can provide improved insights into their network and triage issues with lesser downtime. Cisco UDN 1.5 brings in a new dashboard and workflows to help admins have greater visibility of their network & identify any downtimes in their network sooner.

Improved Visibility into Cisco User Defined Network


With more and more students getting onboarded to the solution it is essential that IT admins have greater visibility & control over how their network is being used. This helps in effectively managing the network and deciding on how they need to channel their future investments.

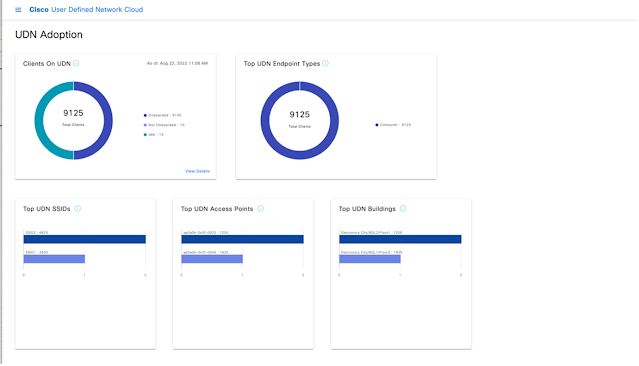
UDN 1.5 brings in a detailed dashboard on Cisco User Defined Network cloud. This dashboard provides insights to the admin on how the Solution is deployed and how well it’s adopted by their students. These dashboards integrate data from Cisco DNAC Assurance, Automation & UDN Cloud and provide a single pane of glass to understand how their network is behaving.  The IT admin can easily understand how well the solution is adopted including details of the denser sites in their network with respect to UDN usage.

The dashboard shows up data on which Sites/SSIDs/RLANs UDN is enabled & the list of sites where it could be enabled to improve UDN adoption.

Cisco Career, Cisco Certification, Cisco Learning, Cisco Prep, Cisco Preparation, Cisco Tutorial and Materials, Cisco Networks, Cisco News
Figure 1. Summary & Sites View of your university

Customers have a view on how well the solution is being adopted on their campus and how many more clients could potentially be part of their UDN network. They also have a view of how many users are actively registering to the UDN network and the number of devices they are bringing to the rooms. It has several other insights like Top Failure/Top UDN User /Top SSIDs and Top Endpoint Type which enables the administrators to decide how they want to optimize their network.

Cisco Career, Cisco Certification, Cisco Learning, Cisco Prep, Cisco Preparation, Cisco Tutorial and Materials, Cisco Networks, Cisco News

Cisco Career, Cisco Certification, Cisco Learning, Cisco Prep, Cisco Preparation, Cisco Tutorial and Materials, Cisco Networks, Cisco News
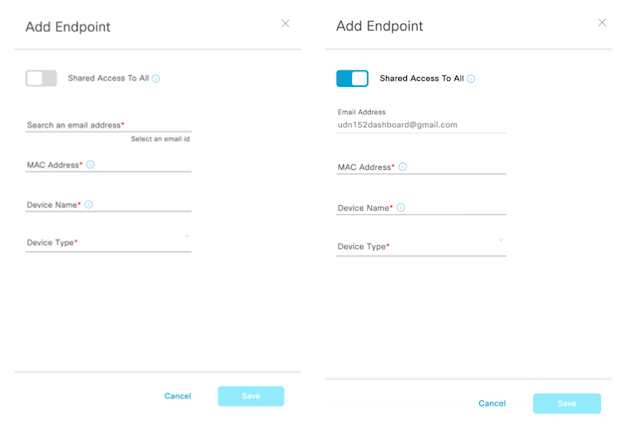
Figures 2 and 3: Dashboards on Cisco UDN Cloud

Endpoint Management


In UDN 1.4, the ability to create rooms was limited to users with Cisco UDN apps. A user with the mobile app only had the ability to create UDN rooms. They could perform various actions on the endpoints like add/delete/move/reclaim the endpoints using the mobile app. This gave a lot of flexibility to the end user to decide which devices are part of his room, however, the IT admin of the university had no view/control over how the UDN rooms were designed. To solve this endpoint management and shared devices support are added in Cisco UDN 1.5 on the admin interface.

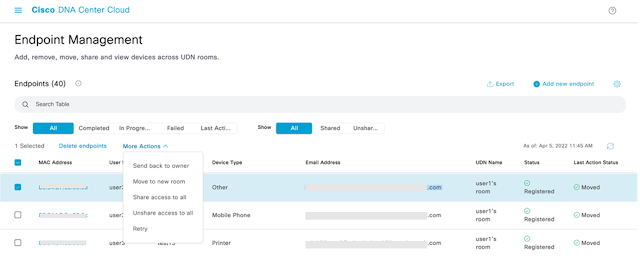
Endpoint Management screens on Cisco User Defined Network cloud do exactly what the student can do from a mobile app, however, the tenant admin has a view across various users in his network. The admin can add & remove endpoints from the student’s room, perform actions of bulk move and reclaim endpoints across the UDN room.

Cisco Career, Cisco Certification, Cisco Learning, Cisco Prep, Cisco Preparation, Cisco Tutorial and Materials, Cisco Networks, Cisco News

Cisco Career, Cisco Certification, Cisco Learning, Cisco Prep, Cisco Preparation, Cisco Tutorial and Materials, Cisco Networks, Cisco News
Figures 4 and 5: Dashboards for adding new device/ Sharing a device

In university networks, there are different use cases where users would want to share some common resources like printers across different endpoints. Such devices are not part of any rooms but are visible to all endpoints which are connected to UDN SSID. UDN 1.5 brings in the functionality to let tenant admin designate devices owned by the admin as ” Shared”. Admin user can provide the list of devices he intends to share with the students through the endpoint management screens on Cisco User-Defined Network Cloud.

UDN Network Health


Since the UDN solution had multiple touch points triaging any failures in the customer network was not always easy. Cisco UDN Health dashboard envisions identifying the issues which may happen in customers’ networks while trying to register/de-register the endpoints to UDN rooms. UDN dashboards expose an option to run test traffic on UDN network to identify any issues on their network. Any issues on adding/moving devices across UDN rooms can be triaged using UDN Health.

UDN Health requires the IT administrator to provide a mac address which the UDN health will try to add & remove from the tenant admin’s room. While doing this action, it traces through all the touch points in the system and queries other systemic data to identify the potential cause of device onboarding failure. The UDN health identifies the potential cause of onboarding failure and the possible corrective actions the IT administrator can take.

In cases when the onboarding failure is a result of misconfiguration in the customer network, UDN health will point out the potential next steps which the IT admin can take to fix his network. UDN health framework also allows customers to download the trace logs of the failed run which can be forwarded to Cisco TAC teams to triage issues further if needed.

UDN Health also supports scheduling of the trace runs every 6hr & 24hrs where a custom mac address will be added/removed from the tenant admin’s UDN room. This scheduled run helps ascertain the health of the network at different points of time during the day.

Cisco Career, Cisco Certification, Cisco Learning, Cisco Prep, Cisco Preparation, Cisco Tutorial and Materials, Cisco Networks, Cisco News

Cisco Career, Cisco Certification, Cisco Learning, Cisco Prep, Cisco Preparation, Cisco Tutorial and Materials, Cisco Networks, Cisco News
Figures 6 and 7: UDN Health

Issues Dashboard on UDN Cloud Service


The issues dashboard provides comprehensive visibility of the UDN network. The dashboard is integrated with Cisco DNA C Assurance and lists all issues seen on their wireless network. The IT administrator can isolate  UDN issues seen in their network and resolve the same using Cisco DNAC Assurance.

Cisco Career, Cisco Certification, Cisco Learning, Cisco Prep, Cisco Preparation, Cisco Tutorial and Materials, Cisco Networks, Cisco News
Figure 8: Issues Dashboard on UDN

Support for UDN extended globally


UDN Cloud solution is now available in US/European regions. Customers can benefit from multi-region support in UDN that ensures all customer data is stored in their respective regions. This helps in adhering to local regulations.

Source: cisco.com

Saturday, 24 September 2022

New Networking Capabilities on Cisco Intersight

Bringing simplicity to complex hybrid cloud operations is the fundamental goal of Cisco Intersight. With a SaaS form factor, which alleviates the burden of installation and ongoing maintenance, Intersight provides comprehensive visibility, consistent day-to-day operations, and automated orchestration to ensure infrastructure is secure and compliant across all hybrid assets. In addition to the cloud SaaS option, we also provide a Connected Virtual Appliance (CVA) or a fully air-gapped Private Virtual Appliance (PVA) options to run on-premises.

To start, Cisco Intersight focused on the management and operations of compute, storage, and virtualization domains from a single cohesive user interface. The compute domain includes Cisco UCS servers and 3rd party servers, the storage domain includes Cisco HyperFlex, NetApp, Pure Storage, and Hitachi, and the virtualization domain spans VMware ESXi, and Amazon Web Services. We are very happy to extend Intersight’s management capabilities to the network domain. Cisco Nexus 9000 series data center switch support is now made generally available in Intersight platform.

What’s new?


Here are few things you can start doing at the get-go with these newly introduced capabilities:

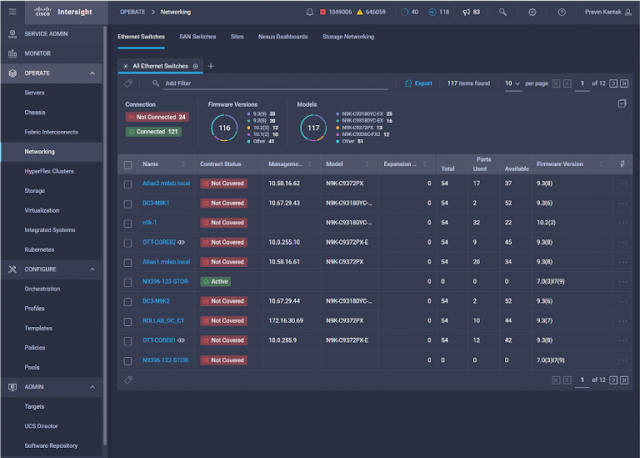
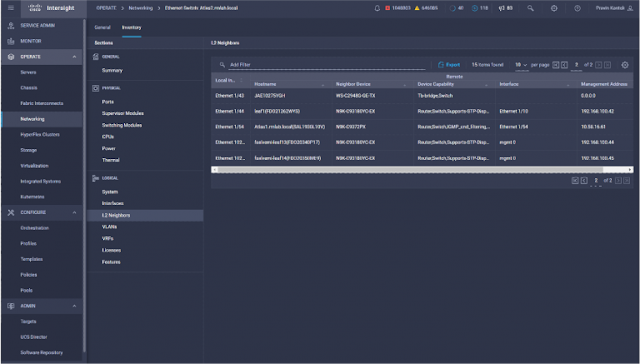
1. Network visibility and operations: Like servers and storage arrays you can view and monitor your ethernet switches from the Intersight unified user interface and benefit from up-to-date network inventory knowledge. L2 neighbors view extends this infrastructure view beyond the switch itself to the identities of devices connected to the respective switch.

2. Cross-domain orchestration: You can construct end-to-end workflows for routine cross-domain orchestration functions such as provisioning a server in a particular VLAN and enabling respective switch ports, or consistently deploy private cloud infrastructure configuration to servers, switches, and storage arrays. Think NTP/DNS/Syslog/SNMP servers and MTUs across the network.

3. Management of Converged Infrastructure (CI) systems: Network domain capabilities facilitate creation comprehensive inventory for CI systems, such as FlexPod and elevate them as first-class citizens in the Intersight platform. Programmatic management of routine operations for these systems can be supported.

Cisco Certification, Cisco Career, Cisco Tutorial and Materials, Cisco Career, Cisco Jobs, Cisco Prep, Cisco Preparation
Cisco Intersight ethernet switch grid view

Cisco Certification, Cisco Career, Cisco Tutorial and Materials, Cisco Career, Cisco Jobs, Cisco Prep, Cisco Preparation
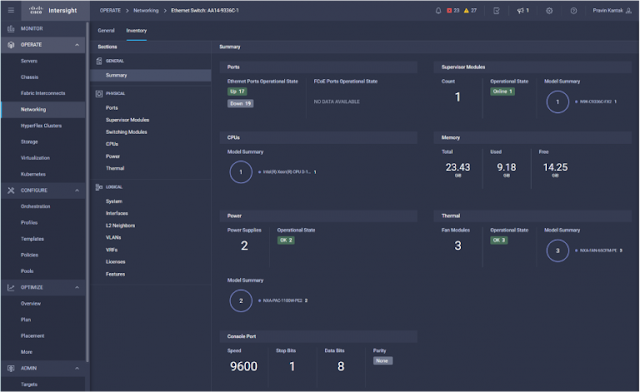
Cisco Intersight switch summary view

How it works?


Now you can onboard Cisco Nexus 9000 datacenter switches in NX-OS mode on Intersight. After claiming any Nexus 9K switches, Intersight presents rich inventory views including a summary, variety of switch hardware sub-systems, and switch configuration for that device.

Automate your network with the rest of the datacenter


Intersight Cloud Orchestrator (ICO) provides end-to-end orchestration and automated operations across the many infrastructure domains managed by Intersight. With Intersight workflow designer, you can construct cross-domain workflows in a no/low code environment using a curated Task Library of turnkey platform-integrated tasks and actions.

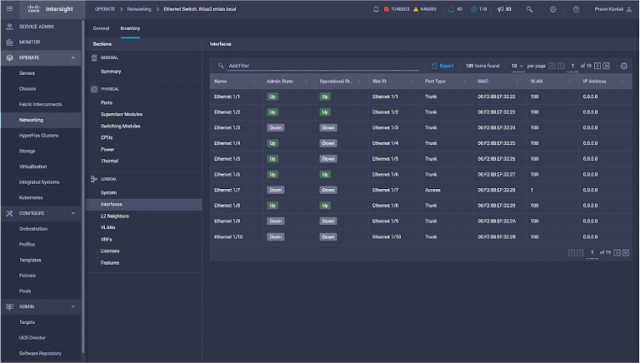
Intersight Task Library is inducted with a rich set of everyday switch management tasks for the Nexus 9000 datacenter switching family in NX-OS mode. These native tasks are backed by comprehensive inventory views, which deliver no-code experience for constructing and executing the cross-domain orchestration workflows. The task categories include basic system management tasks, comprehensive switch port management, and VLAN management. The granularity of these automation tasks is extended all the way to Create/Read/Update/Delete (CRUD) operations levels for the supported switch management objects. This allows you to construct automation workflows very closely aligned with your deployment.

Cisco Certification, Cisco Career, Cisco Tutorial and Materials, Cisco Career, Cisco Jobs, Cisco Prep, Cisco Preparation
Cisco Intersight switch port inventory view

Cisco Certification, Cisco Career, Cisco Tutorial and Materials, Cisco Career, Cisco Jobs, Cisco Prep, Cisco Preparation
Cisco Interisght switch L2 neighbor inventory view

Stay in control


You can effectively define and enforce your organization’s Role Based Access Control (RBAC) policies using Intersight Roles and Privilege Sets. Intersight has introduced two new Privilege Sets for Network Domain: Network Administrator and Network Operator. These Privilege Sets can be used to define appropriate Roles in the organization for governing the access to management functions of the network assets in Intersight. For example, a user with Network Administrator Privilege Set can only define and execute workflows using Network Task.

Getting Connected with Intersight


If you want to try it for yourself, you can create a free account on www.intersight.com and request a free trial of any Intersight capability, including orchestration. Feel free to onboard your Nexus 9000 switches and monitor those along with the compute and storage resources from a unified UI. End-to-end orchestration workflows supported by Nexus native task library, such as provisioning a server in a VLAN and turn-up respective switch ports, will help you reduce your Hybrid Cloud OpEx, deliver time-to-service acceleration, and reduce operational risks for everyday datacenter management operations.

Source: cisco.com